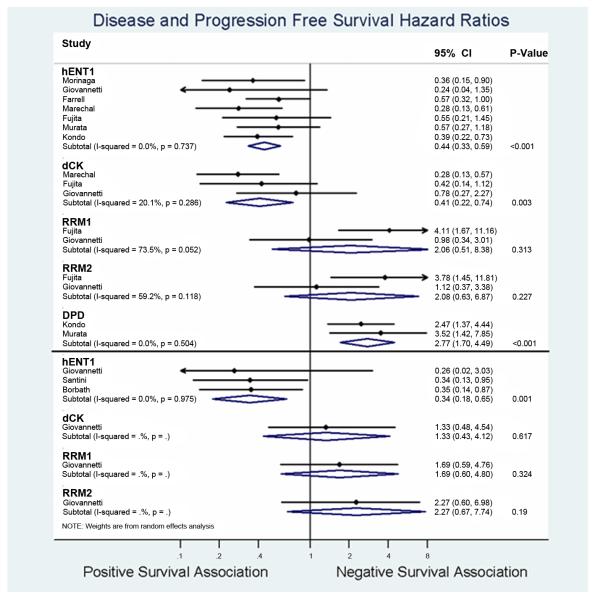
Figure 4a and 4b. Forest plot summarizing hazards ratios comparing high versus low expression levels of the individual biomarkers.
Forest plot for disease free survival (a) and progression free survival (b). Data from each study are summarized. Hazards ratios and their 95% confidence bounds are reported. Study heterogeneity are represented by p-val derived from the Cochrane Q test (p >0.1 denotes significance), with corresponding magnitude represented by I2 value. P-value column denotes statistical significance of the summarized HRs.

