Abstract
Background
We wanted to determine the sensitivity and specificity of serial changes in visual acuity and visual evoked potentials (VEPs) to detect radiological progression of tumor volume in children with optic pathway gliomas.
Methods
From a retrospective review of a cohort of 69 patients, 54 patients met inclusion criteria (31 with primary chemotherapy, 4 with primary radiotherapy, and 19 with stable tumor volume and no treatment). Age at presentation ranged from 0.3 to 13 years. Patients were serially followed by MRI, age-corrected visual acuity in log minimum angle of resolution (logMAR), and pattern VEP. Longitudinal data averaged 7.9 years (range 0.5–16 y). Visual assessments were aligned with MRI data within 6-month intervals. Tumor progression was defined by 25% or greater increase in volume.
Results
Visual acuity in the better eye had poor sensitivity and specificity for detecting tumor volume progression (0.5 and 0.5, respectively). Visual acuity in the worse eye showed worse sensitivity and specificity because false positives (visual decline without tumor progression) were more frequent than true positives (visual decline with tumor progression). VEPs showed slightly better sensitivity and specificity (0.69 and 0.58, respectively). In patients with stable tumors, visual acuity fluctuated ±0.55 logMAR (SD = 0.15) between examinations. VEP amplitude fluctuated −0.74 to 0.48 log units (SD = 0.19) between examinations.
Conclusions
Serial changes in visual function do not reliably detect tumor progression. Conversely, tumor progression does not reliably indicate decreased visual function. Objective visual function and serial MRIs are complementary in management of optic pathway gliomas.
Keywords: optic pathway glioma, tumor progression, visual acuity
Optic pathway gliomas (OPGs) account for 4%–6% of all brain tumors in childhood. Approximately 65% of these cases are detected in children <5 years of age and most cases are diagnosed before 15 years of age.1–4 The tumor involves the optic chiasm in ∼80% of cases and the optic nerve in the remaining 20%.1,4–6 OPGs are usually low-grade pilocytic astrocytomas but show a highly variable growth pattern, ranging from indolent to rapidly progressive.5 Treatment of OPG is prompted by neuroradiological evidence of tumor growth, progressive visual loss, or neurological signs.7 Chemotherapy has been shown to be an effective first-line therapy in young children who require treatment.8–13 Although chemotherapy stabilizes or reduces the tumor, up to 60% of children have tumor progression after 5 years4,12,14 and will require further treatment with chemotherapy or radiation therapy.
Detection of tumor progression consists of serial MRIs with or without objective assessments of visual function in young children. Previous studies have examined the relationship of tumor location and volume at presentation with long-term outcomes.14–16 However, longitudinal data depicting a strong relationship between visual function and tumor volume are lacking. Fisher et al7 reported MRI and visual acuity in 71 patients with neurofibromatosis type 1 (NF1) in whom assessments were performed pre- and postchemotherapy. Of 67 patients with improved or stable MRIs, visual acuity improved in 33%, remained stable in 39%, and worsened in 28%. One conclusion of this study was that a poor correlation exists between radiographic response and visual acuity outcomes immediately after treatment. In comparison, longitudinal monitoring of the visual evoked potential (VEP) showed a higher correspondence with MRI findings (68%–86%) than visual acuity.17,18 Unlike previous work, this study systematically measured visual acuities and VEPs over a long-term follow-up in a large cohort of children with OPG. The purpose of this study was to determine the sensitivity and specificity of between-visit variations in visual acuity and VEP amplitude with changes in tumor volume. Furthermore, we characterized between-visit variations in visual function with between-visit variations in tumor volume.
Materials and Methods
The study population was derived from a retrospective chart review of a cohort of 69 patients (38 males, 31 females), who were evaluated for an optic glioma involving any portion of the visual pathway. Patients were seen at Seattle Children's Hospital between July 1988 and June 2007. From this cohort, 54 patients were selected based on having serial data including MRI, age-corrected visual acuity measurements in log minimum angle of resolution (logMAR), and pattern VEPs. A biopsy was not necessary for inclusion into the study. The institutional review board approved this chart review study. Some details of the methods used in this study have already been published14 and are briefly described below.
Neuroimaging
MRI included fluid-attenuated inversion recovery (FLAIR) and T1-weighted, T2-weighted, and contrast-enhanced T1-weighted sequences. The diagnosis of OPG was based primarily on MRI findings of a tumor arising from the optic pathways (optic nerve, chiasm with or without hypothalamic involvement, optic tracts, and/or optic radiations). Whenever possible, a biopsy was performed to confirm the diagnosis.
Longitudinal tumor volumes were estimated from MRI from the report of the radiologist, who was blind to the visual status of the patient. Tumor volume was represented by maximal dimensions in 3 orthogonal planes. Two patients had initial imaging on CT scans in which a biopsy confirmed diagnoses. Two other patients had longitudinal tumor volumes estimated using a 3-dimensional segmentation tool (ITK-SNAP19) from T2 or FLAIR imaging. For these manual measurements, tumor margins were accentuated using the ITK-SNAP windowing tool. Borders of the signal abnormality were outlined and tumor volumes were then estimated from the ITK-SNAP program. Interval enlargement of cystic components was included in estimated tumor volume measurements because these components contribute to the overall mass effect. For each patient, follow-up measurements were obtained from images using the same imaging sequence as the initial MRI scan. Between-visit change in tumor volume was defined as the ratio of each volume to the prior measurement.
Treatment Protocols
Observation with serial examinations and MRI was the preferred management for children without clinical or radiological signs of progressive tumor. Treatment was based on clinical or radiological signs of progression. Visual loss, endocrine dysfunction, or other neurologic symptoms were considered signs of clinical progression.
Children with OPG were treated according to standard institutional practice, including enrollment in cooperative group research trials if available. The most common low-dose chemotherapy regimen was vincristine and carboplatin. However, several chemotherapy regimens were used, all of which are considered equally effective in low-grade glioma.8–13 Radiation therapy was reserved for older children without NF1, or children who had failed at least one chemotherapy regimen due to potential for second malignancy as well as long-term neurocognitive sequelae resulting from radiation. No patient underwent simultaneous chemotherapy and radiotherapy.
Ophthalmological Examination
Visual acuity was assessed by Teller Acuity Cards and HOTV, Allen, or Snellen optotypes depending on age or cognitive ability. Visual acuities were converted to logMAR. For example, 0.0 logMAR was 20/20 acuity and 1.0 logMAR was 20/200 acuity. For Teller Acuity Card measurements in subjects ≤4 years old, logMAR acuity was corrected for age by taking the difference in logMAR between observed acuity from the average of age-matched normative data.20 In older patients using Allen, HOTV, or Snellen optotypes, no age correction was used and normal acuity was assumed to be 0.0 logMAR (20/20). Between-visit change in acuity was defined as the difference in logMAR acuity from the prior visit.
Details of the VEP recordings can be found elsewhere.14,21 In brief, the VEP response was recorded from at least 3 active electrodes over the occiput (Oz, O3, O4 in standard 10–20 coordinates) with a reference electrode placed at the vertex and a ground electrode placed between the vertex and Oz. Signals were amplified 5000× and bandpass filtered 1–40 Hz. In this study, we report only signals from the Oz channel, as this location consistently generated the largest amplitude. Stimuli consisted of white/black checkerboards of 163 and 84 arc minutes, at 80% contrast reversing at 1.4 Hz. To compensate for potential artifacts due to horizontal nystagmus,22 subjects were additionally tested to pattern onset-offset of equiluminant white/black sinewave gratings (0.5 and 2 cycles/degree) of 99% contrast, presented for 150 ms followed by 500 ms of a blank screen of the same mean luminance. A small toy dangled at the center of the stimulus enhanced fixation and attention. In verbal children, attention was monitored by having the child count the number of times the toy was “twitched.” VEP amplitude was the voltage difference between the dominant positive peak near 100 msec and the preceding negative peak. Latency was the time from the stimulus onset to the dominant positive peak. When waveforms were severely reduced or distorted, latency was defined as the time to the largest deflection that was repeatable from a prior VEP test, and amplitude was the difference from this peak from the prior deflection. The analysis used the larger amplitude from either the 163- or 84-arc minute, and from the 0.5 or 2 cycles/degree stimuli. VEP data were not obtained from eyes with 20/2000 or worse acuity. Between-visit change in VEP amplitude was defined as the ratio of each measurement to the prior measurement.
Only 18 of 54 patients (33%) in this study could cooperate with longitudinal visual field testing, either by static or by kinetic visual field testing. Twelve of these 18 patients were treated and all had an abnormal visual field ranging from severe generalized loss to temporal hemianopia. The remaining 36 patients (66%) were too young or were cognitively limited. Longitudinal changes in visual fields were not analyzed due to limited follow-up or inconsistent results owing to visual fixation losses.
Sensitivity and Specificity
In this study, longitudinal (between-visit) changes in visual acuity and in VEP amplitude were compared with longitudinal changes in tumor volume. We assessed the sensitivity and specificity of visual acuity or VEPs to identify tumor progression vs nonprogression. Sensitivity is the ratio of true positives to true positives plus false negatives. We defined a true positive as decreased visual acuity with tumor progression, while a false negative was stable visual acuity with tumor progression. Specificity is the ratio of true negatives to true negatives plus false positives. A true negative is stable visual acuity without tumor progression, while a false positive is a decrease in visual acuity without tumor progression. Ideal sensitivity would identify only patients with an increase in tumor volume (true positives = 100%). Ideal specificity would correctly identify patients with stable tumor volume (true negative = 100%). However, no test is ideal and there will be some false positives (patients with an abnormal test with stable tumor volume) and false negatives (patients without a change in visual function with progressive tumor volume). Data were plotted in standard receiver-operator curves (ROCs) and relative area under the ROC was compared across specific tests and criteria. An ideal test generates an ROC curve that follows the extreme upper left portion of the graph. A test without reliable detection falls along the diagonal. Conversely, a curve that bends toward the lower right of the graph has inverse detection (true positives are less frequent than false positives). For sensitivity and specificity analyses, visual assessment data were aligned to MRI data within 6-month intervals. Data from the unaffected eye in patients with unilateral optic nerve were excluded from the analysis. The criterion for an increase in tumor volume was defined as an increase of 25% or more in tumor volume.7,17,23 Separate analyses were done to examine sensitivity and specificity by (i) changing the criterion to be any increase in tumor volume, or (ii) excluding patients with severe visual acuity loss worse than 20/200, or (iii) the absence of hydrocephalus. Statistical analysis was performed by Microsoft Excel v2003.
Results
Age at presentation ranged from 0.3 to 13 years. Longitudinal data were on average 7.9 years (range, 0.5–16 y). The average duration between ophthalmological examinations in treated patients was 0.9 years (SD = 1.2; range, 0.06–10.3 y apart). The average duration between ophthalmological examinations in untreated patients was 1.0 years (SD = 1.0; range, 0.11–7.5 y apart).
In patients with progressive disease, initial treatment was with chemotherapy (n = 31) or radiotherapy (n = 4). Of these 35 patients receiving treatment, 11 had NF1 (all but 1 patient with NF1 had primary chemotherapy). Of the 35 treated patients, the most posterior location of the tumor was the optic nerve (n = 2), the chiasm (n = 31), or the chiasm extending to the optic radiations (n = 2). Sixteen of these 35 patients (46%) had associated hydrocephalus, and 17 of 35 patients (49%) had hypothalamic involvement with endocrine dysfunction.
Nineteen patients had stable tumor volumes and no subsequent treatment (all but 3 of these patients had NF1). In these 19 patients with stable tumor volume, the most posterior location of the tumor was the optic nerve (n = 8; one bilateral) or the chiasm (n = 11). None of these 19 patients had associated hydrocephalus, and 5 of 19 patients (26%) had hypothalamic involvement with endocrine dysfunction.
Visual Acuity
Table 1 shows longitudinal visual acuity measurements for 35 patients undergoing treatment versus 19 patients with stable tumors. Treated patients had a significant decrease in averaged logMAR visual acuity from the first to last examination, whereas untreated patients did not. The between-visit variation was greater than 2-fold higher in treated patients vs untreated patients.
Table 1.
Longitudinal visual acuity and VEP measurements
| First Examination | Last Examination | Between-visit | First vs Last | |
|---|---|---|---|---|
| SD | P value | |||
| Visual acuity | ||||
| Treated | 0.59 (0.72) | 0.95 (0.99) | 0.31 | .017 |
| Untreated | 0.28 (0.34) | 0.28 (0.38) | 0.15 | .96 |
| Check VEP latency (ms) | ||||
| Treated | 147.6 (40.8) | 144.6 (46.7) | 36.5 | .72 |
| Untreated | 125.4 (28.4) | 117.7 (22.1) | 25.1 | .19 |
| Check VEP amplitude (microvolts) | ||||
| Treated | 9.2 (8.3) | 8.0 (7.1) | 99% | .41 |
| Untreated | 14.4 (7.6) | 11.5 (5.9) | 40% | .07 |
| Onset VEP latency (ms) | ||||
| Treated | 144.5 (52.0) | 138.1 (27.9) | 36.4 | .42 |
| Untreated | 129.3 (18.1) | 129.1 (20.0) | 25.4 | .97 |
| Onset VEP amplitude (microvolts) | ||||
| Treated | 11.9 (6.7) | 8.1 (6.5) | 78% | .004 |
| Untreated | 16.9 (7.9) | 15.0 (8.1) | 45% | .48 |
Values are mean (SD); visual acuity = age-correct log minimum angle of resolution; VEP = visual evoked potential to check reversal or pattern-onset. Between-visit represents the difference in visual acuity, VEP latency, and VEP amplitude ratio from the prior examination.
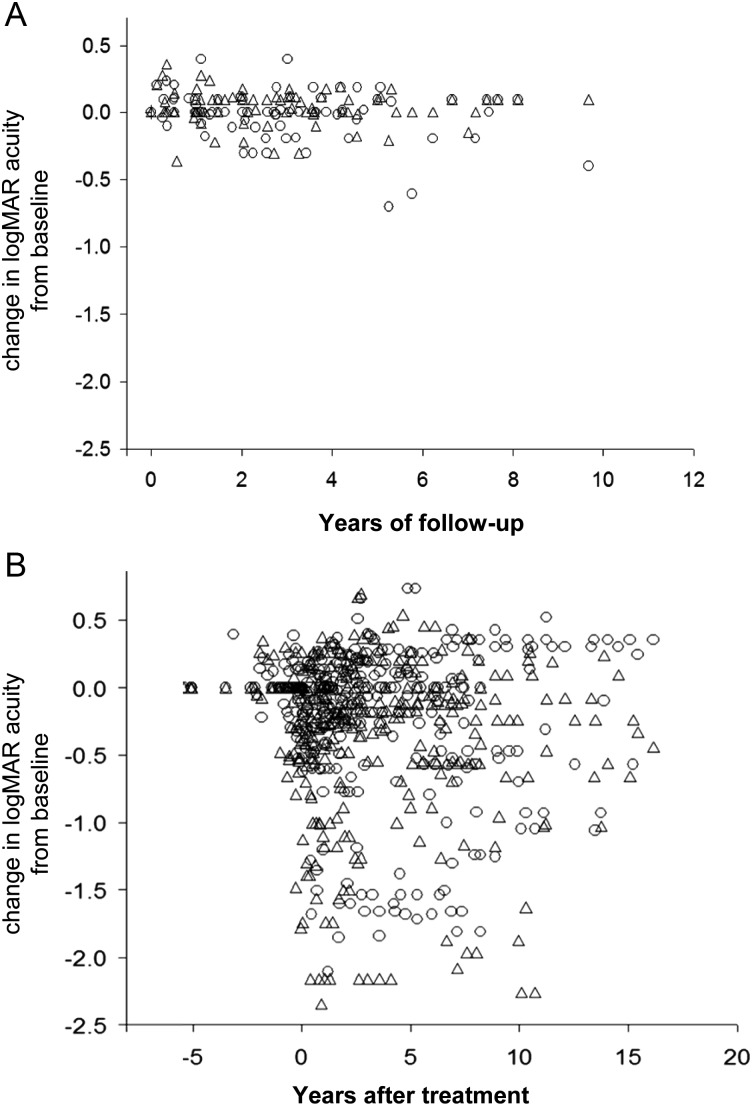
Figure 1 graphs the longitudinal variation of visual acuity in treated and untreated patients. The data represent changes in visual acuity relative to the initial examination. The plot highlights the large amount of scatter in the treated patients compared with the untreated patients. There is considerable amount of overlap between treated and untreated patients. For untreated patients with stable tumor volumes, the maximum change in logMAR acuity ranged from −0.55 to 0.55 logMAR (SD = 0.15).
Fig. 1.
(A) Longitudinal changes in age-corrected visual acuity in patients with stable optic pathway gliomas. Visual acuity is represented as difference in logMAR from the baseline measurement, in which negative numbers represent worse visual acuity. (B) Longitudinal changes in logMAR in treated patients with respect to the initiation of treatment. Circles and triangles represent the right eye and left eye, respectively.
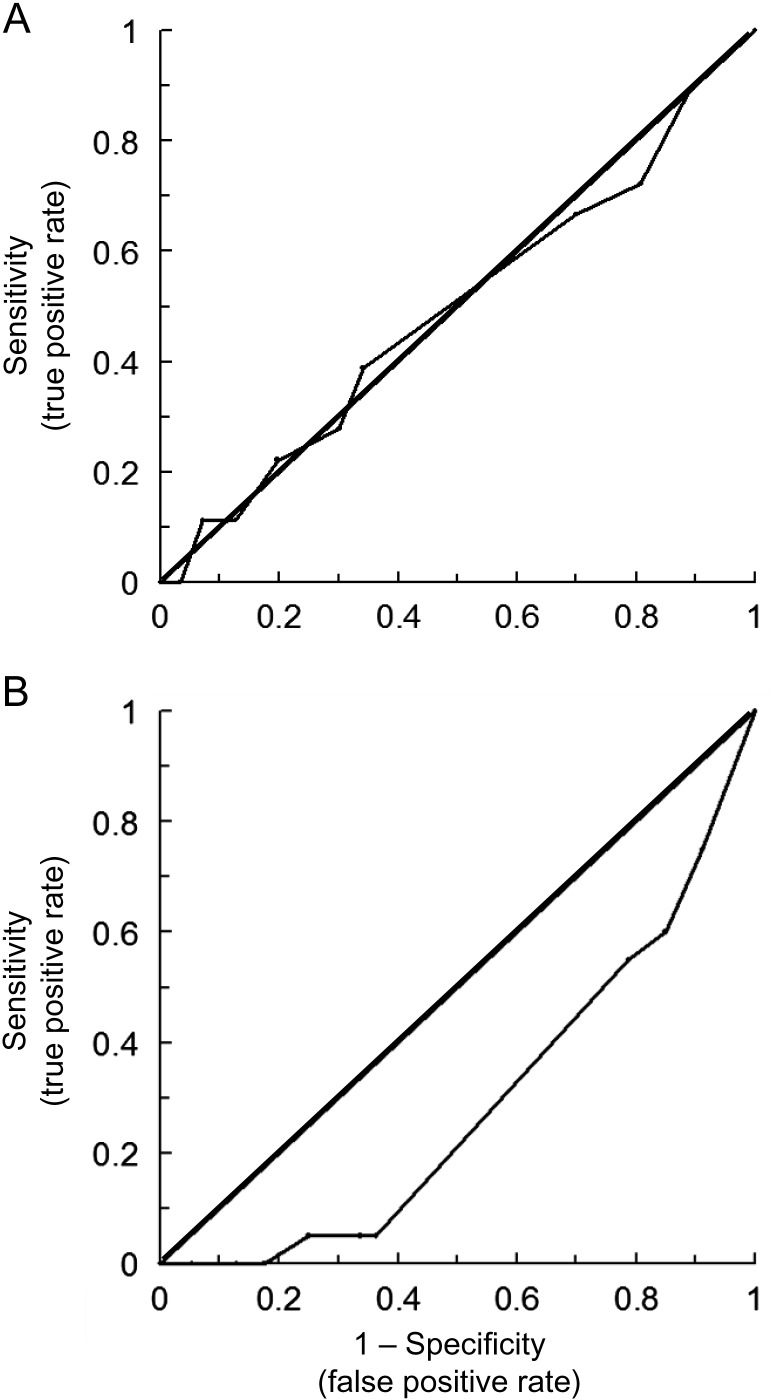
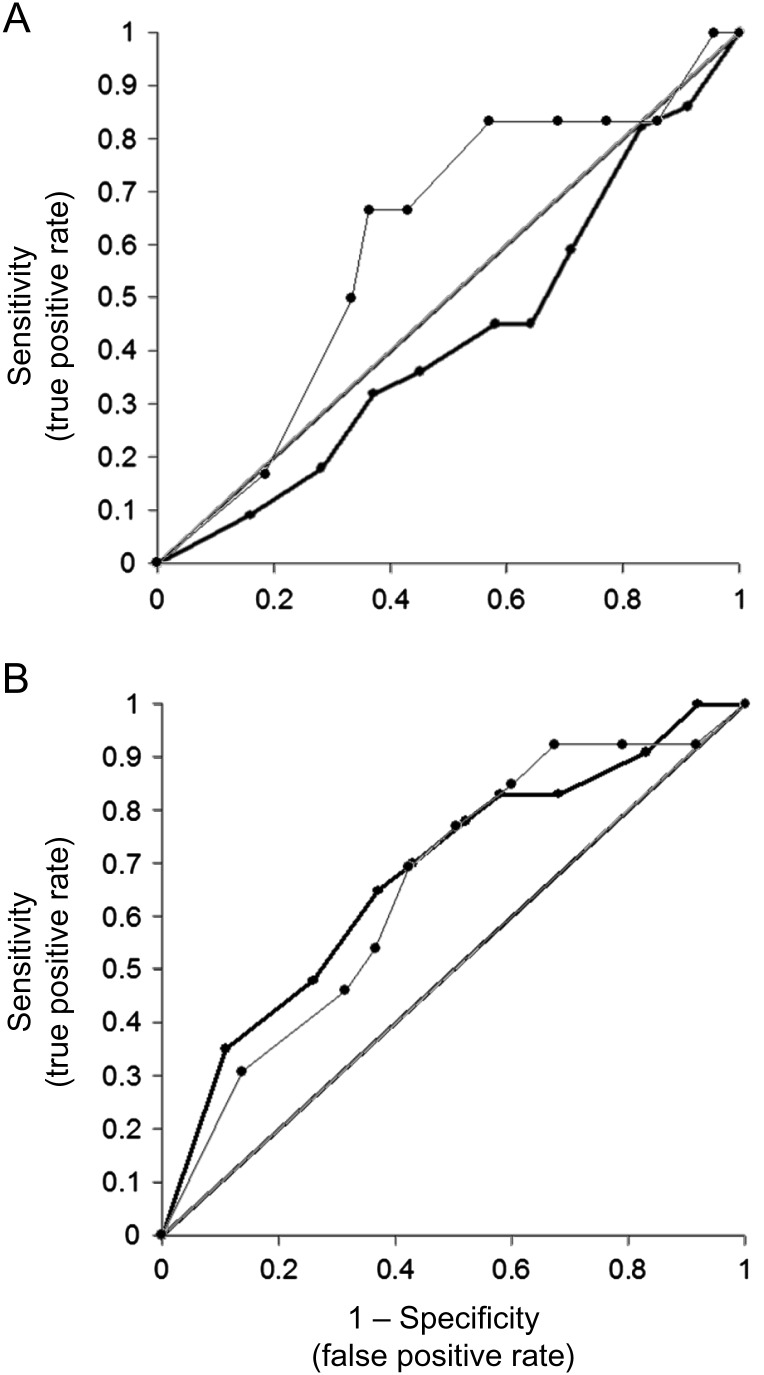
Figure 2 shows ROC curves for detection of tumor progression using changes in visual acuity. Curves plot separate results from the eye with better visual acuity vs the eye with worse acuity. For the better eye, the ROC curve falls near the diagonal, indicating unreliable detection (sensitivity and specificity ∼0.50 for both). Sensitivity and specificity were identical if the analysis used a subset of patients with 1.0 logMAR or better acuity and if patients with hydrocephalus were removed. If the criterion for tumor progression was any increase in tumor volume, then sensitivity was 0.41 and specificity was 0.76 for any decrease in visual acuity. The ROC curves in Fig. 2 were calculated from 18 data points with tumor progression in treated patients, 164 data points with stable tumor in treated patients, and 76 data points with stable tumor in untreated patients.
Fig. 2.
ROC curves for detecting tumor progression by serial changes in age-corrected visual acuity. (A) Data from the eye with better visual acuity. (B) Data from the worse eye. Data within 6 months after treatment were included in the analysis.
For visual acuity in the worse eye, the ROC curve falls below the diagonal; that is, false positives are more frequent than true positives. Furthermore, the ROC curve continues to show a high false positive rate even if (i) only eyes with 1.0 logMAR or better acuity are included in the analysis, (ii) the criterion for tumor progression is any increase in tumor volume, and (iii) patients with hydrocephalus are excluded. Furthermore, the ROC curve indicates that visual acuity is not sensitive to tumor progression. For example, using a criterion of 0.3 logMAR decrease in visual acuity, there were no true positives and 20 false negatives.
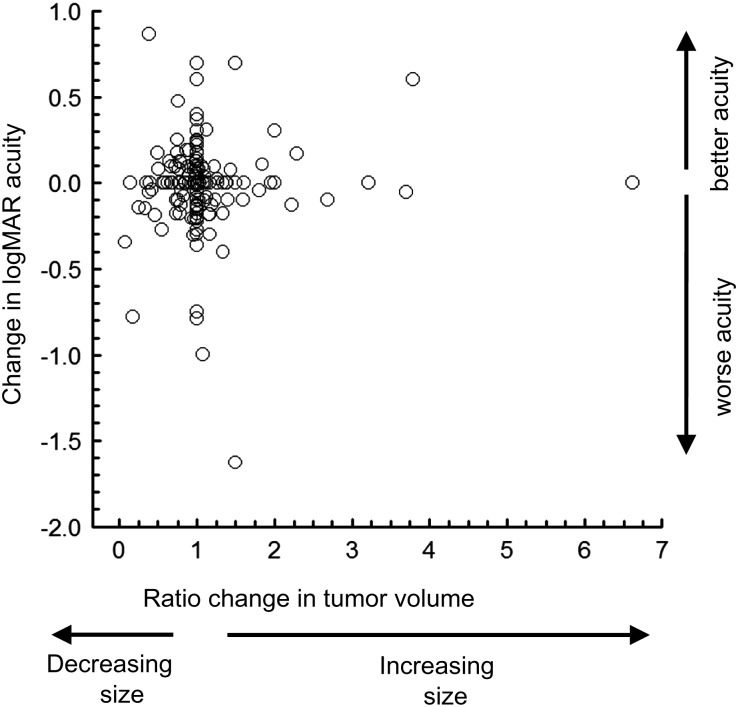
An underlying reason for the poor ROC curve is the lack of a significant relationship between changes in tumor volume with changes in logMAR visual acuity in treated patients (Fig. 3). The change in tumor was the ratio between the observed volume and the prior volume for all longitudinal MRI scans. The change in logMAR visual acuity was the difference from the prior visit. Also, there was no correlation between the change in tumor volume and change in logMAR acuity for the better eye (r = 0.05; P = .45). Results were similar for the worse eye (r = −0.05; P = .54).
Fig. 3.
The relationship between changes in tumor volume with relative changes in age-corrected visual acuity. Data are from serial longitudinal assessments of the better eye in 35 treated patients. Visual acuity is represented as difference in logMAR from the prior examination such that a negative logMAR represents a decrease in visual acuity. Change in tumor volume represents the ratio of volume from the prior examination, ie, 2.0 is a 2-fold increase in volume. Data within 6 months after treatment are excluded.
Visual Evoked Potentials
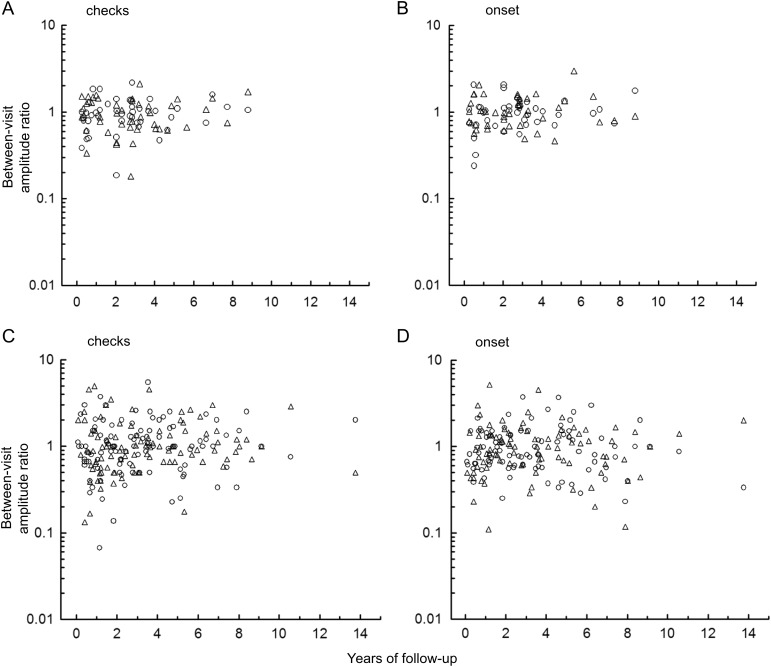
Table 1 shows longitudinal VEP measurements for treated and untreated patients. VEP latency did not show significant longitudinal change with either the check reversal or pattern-onset stimuli. VEP amplitude shows a significant decrease for the pattern-onset stimuli only. Figure 4 demonstrates the variation in amplitude from one visit to the next in treated patients and untreated patients. For untreated patients, the maximum change in between-visit VEP amplitude ranged from −0.74 to 0.48 log units (SD = 0.19).
Fig. 4.
Top, longitudinal changes in VEP amplitude in patients with stable optic pathway glioma using (A) check reversal stimuli and (B) pattern-onset stimuli. Bottom, longitudinal changes in VEP amplitude in patients with progressive disease using (C) check reversal stimuli and (D) pattern-onset stimuli. Circles and triangles represent the right eye and left eye, respectively.
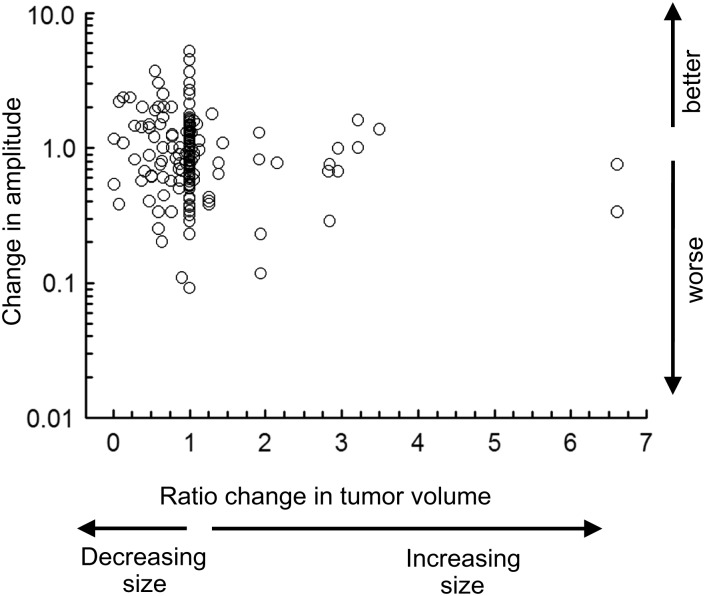
Figure 5 shows ROC curves for detection of tumor progression using changes in VEP amplitude. Curves were similar when using the eye with better or worse visual acuity, and therefore the curve shows both eyes combined. For check reversal stimuli, the ROC curve falls below the diagonal; that is, false positives are more frequent than true positives. Using a subset of patients having VEPs with at least 8-microvolt amplitude, there is a significant improvement in the ROC curve. A 20% reduction in VEP amplitude was the optimum criterion (sensitivity = 0.67, specificity = 0.57). For pattern-onset stimuli, the ROC curve shows an optimum detection at a 20% reduction in VEP amplitude (sensitivity = 0.69, specificity = 0.58). There is no improvement in detection if the analysis uses the subset of VEPs with at least 8-microvolt amplitude. There is no change in the ROC curve if patients with hydrocephalus are excluded. If the criterion for tumor progression is any increase in tumor volume, then sensitivity = 0.59 and specificity = 0.47 for any decrease in amplitude.
Fig. 5.
ROC curves for detecting increased size of tumor volume from serial changes in VEP amplitude in treated patients. Both eyes are included in the analysis, since there was no difference between the better and worse eye. The ROC curve is for (A) check reversal stimuli and (B) pattern-onset stimuli.
As was found for visual acuity, the poor ROC curve could be attributed to the lack of a significant relationship between changes in tumor volume and changes in VEP amplitude in treated patients (Fig. 6). There was no correlation between the change in tumor volume and change in amplitude for the pattern-onset stimuli (r = −0.13; P = .07). Results were similar for the check reversal stimuli (r = 0.05; P = .13).
Fig. 6.
Relationship between changes in tumor volume with changes in VEP amplitude to pattern-onset stimuli. Data are from serial longitudinal assessments from either eye in 35 treated patients. Similar results occurred for check reversal stimuli. Change in tumor volume represents the ratio of volume from the prior examination, ie, 2.0 is a 2-fold increase in volume.
Discussion
We found that serial changes of visual acuity in treated patients with OPG after presentation were not correlated with serial changes in tumor volume. Conversely, radiological evidence of tumor progression did not reliably correlate with changes of visual function. Consequently, serial MRI and assessments of visual function provide complementary information important to the management of OPG. Our results support previous work in children with and without NF1 showing a low correlation between visual acuity and radiographic outcomes.7,17,18,24 For the eye with worse acuity, we found a high false positive rate, which indicates visual decline without tumor progression. The high false positive rate results from the inability to distinguish progressive optic nerve damage due to tumor growth from superimposed amblyopia. Specifically, the eye with worse acuity may be more sensitive to subtle increases in the tumor volume not detected by MRI. On the other hand, the finding of a high false positive rate of visual decline without tumor progression is consistent with superimposed amblyopia.
VEPs had higher sensitivity and specificity compared with visual acuity for detection of radiological tumor progression, which is consistent with previous studies.14,17,18 Differences in detection of tumor progression between visual acuity and VEPs could be related to the origins of each measure. For example, visual acuity represents the central 2 degrees of the visual field, while the VEP is generated by cortical neurons representing the macula and the surrounding central 20 degrees of the visual field.25,26 Sensitivity and specificity of the check reversal VEP improves if patients with a severely reduced VEP are removed from the analysis. This finding suggests that severe preexisting damage in the visual system limits detection of OPG progression using the check reversal VEP.
The lack of a systematic relationship between serial changes in tumor progression and visual function is problematic for 2 reasons. One reason is that a radiological increase in tumor volume may not be associated with loss of visual function because tumor growth is confined to adjacent neural structures but does not directly compromise visual pathway axons. The second reason is that visual function can decline when tumor volume is radiologically stable.14 Pilocytic astrocytomas can invade optic nerve fascicles,27 thereby compromising blood supply or interfering with neuronal-glial interactions. In addition, tumor invasion of the visual pathway axons may be below the resolution of the MRI.
The large variation in between-visit measures in children with stable radiological appearance of the OPG is another factor relevant to sensitivity and specificity. In untreated patients, the standard deviation of between-visit visual acuity changes was 0.15 in logMAR acuity with a maximum range of −0.55 to 0.55 logMAR. Our data support a criterion of at least 0.2 logMAR (2 or more lines on an acuity chart) as a significant change in visual acuity given the variance in this population.14 The VEP amplitude also showed large between-visit variation in untreated patients (−0.74 to 0.48 log units from the prior visit). On repeat testing, the few outliers with large between-visit variation showed a return toward baseline levels. Our measurements of between-visit variation in visual acuity are consistent with previous estimates of longitudinal variation in OPG patients with stable tumors.28,29
Funding
This work was supported by an unrestricted grant from the Peter LeHaye, Barbara Anderson, and William O. Rogers Endowment Funds.
Conflict of interest statement. None declared.
References
- 1.Dutton JJ. Gliomas of the anterior visual pathway. Surv Ophthalmol. 1994;38:427–452. doi: 10.1016/0039-6257(94)90173-2. [DOI] [PubMed] [Google Scholar]
- 2.Lee AG, Dutton JJ. A practice pathway for the management of gliomas of the anterior visual pathway: an update and an evidence-based approach. Neuroophthalmology. 1999;22:139–155. [Google Scholar]
- 3.Jahraus CD, Tarbell NJ. Optic pathway gliomas. Pediatr Blood Cancer. 2006;46:586–596. doi: 10.1002/pbc.20655. [DOI] [PubMed] [Google Scholar]
- 4.Thiagalingam S, Flaherty M, Billson F, North K. Neurofibromatosis type 1 and optic pathway gliomas: follow-up of 54 patients. Ophthalmology. 2004;111:568–577. doi: 10.1016/j.ophtha.2003.06.008. [DOI] [PubMed] [Google Scholar]
- 5.Alvord EC, Jr, Lofton S. Gliomas of the optic nerve or chiasm: outcome by patients’ age, tumor site, and treatment. J Neurosurg. 1988;68:85–98. doi: 10.3171/jns.1988.68.1.0085. [DOI] [PubMed] [Google Scholar]
- 6.Laithier V, Grill J, Le Deley MC, et al. Progression-free survival in children with optic pathway tumors: dependence on age and the quality of the response to chemotherapy—results of the first French prospective study for the French Society of Pediatric Oncology. J Clin Oncol. 2003;21:4572–4578. doi: 10.1200/JCO.2003.03.043. [DOI] [PubMed] [Google Scholar]
- 7.Fisher MJ, Loguidice M, Gutmann DH, et al. Visual outcomes in children with neurofibromatosis type 1–associated optic pathway glioma following chemotherapy: a multicenter retrospective analysis. Neuro Oncol. 2012;14:790. doi: 10.1093/neuonc/nos076. [DOI] [PMC free article] [PubMed] [Google Scholar]
- 8.Packer RJ, Sutton LN, Bilaniuk LT, et al. Treatment of chiasmatic/hypothalamic gliomas of childhood with chemotherapy: an update. Ann Neurol. 1988;23:79–85. doi: 10.1002/ana.410230113. [DOI] [PubMed] [Google Scholar]
- 9.Packer RJ, Ater J, Allen J, et al. Carboplatin and vincristin chemotherapy for children with newly diagnosed progressive low-grade gliomas. J Neurosurg. 1997;86:747–754. doi: 10.3171/jns.1997.86.5.0747. [DOI] [PubMed] [Google Scholar]
- 10.Petronio J, Edwards SB, Prados M, et al. Management of chiasmal and hypothalamic gliomas of infancy and childhood with chemotherapy. J Neurosurg. 1991;74:701–708. doi: 10.3171/jns.1991.74.5.0701. [DOI] [PubMed] [Google Scholar]
- 11.Castello MA, Schiavetti A, Padula A, et al. Does chemotherapy have a role in low-grade astrocytoma management? A report of 13 cases. Med Pediatr Oncol. 1995;25:102–108. doi: 10.1002/mpo.2950250210. [DOI] [PubMed] [Google Scholar]
- 12.Janss AJ, Grundy R, Cnaan A, et al. Optic pathway and hypothalamic/chiasmatic gliomas in children younger than age 5 years with a 6-year follow-up. Cancer. 1995;75:1051–1059. doi: 10.1002/1097-0142(19950215)75:4<1051::aid-cncr2820750423>3.0.co;2-s. [DOI] [PubMed] [Google Scholar]
- 13.Garvey M, Packer RJ. An integrated approach to the treatment of chiasmatic-hypothalamic gliomas. J Neurooncol. 1996;28:167–183. doi: 10.1007/BF00250197. [DOI] [PubMed] [Google Scholar]
- 14.Kelly JP, Leary S, Khanna P, Weiss AH. Longitudinal measures of visual function, tumor volume, and prediction of visual outcomes after treatment of optic pathway gliomas. Ophthalmology. 2012;119(6):1231–1237. doi: 10.1016/j.ophtha.2011.12.035. [DOI] [PubMed] [Google Scholar]
- 15.Tow SL, Chandela S, Miller NR, Avellino AM. Long-term outcome in children with gliomas of the anterior visual pathway. Pediatr Neurol. 2003;28:262–270. doi: 10.1016/s0887-8994(02)00628-8. [DOI] [PubMed] [Google Scholar]
- 16.Campagna M, Opocher E, Viscardi E, et al. Optic pathway glioma: long-term visual outcome in children without neurofibromatosis type–1. Pediatr Blood Cancer. 2010;55:1083–1088. doi: 10.1002/pbc.22748. [DOI] [PubMed] [Google Scholar]
- 17.Ng YT, North KN. Visual-evoked potentials in the assessment of optic gliomas. Pediatr Neurol. 2001;24:44–48. doi: 10.1016/s0887-8994(00)00230-7. [DOI] [PubMed] [Google Scholar]
- 18.Falsini B, Ziccardi L, Lazzareschi I, et al. Longitudinal assessment of childhood optic gliomas: relationship between flicker visual evoked potentials and magnetic resonance imaging findings. J Neurooncol. 2008;88:87–96. doi: 10.1007/s11060-008-9537-1. [DOI] [PubMed] [Google Scholar]
- 19.Yushkevich PA, Piven J, Hazlett HC, et al. User-guided 3D active contour segmentation of anatomical structures: significantly improved efficiency and reliability. Neuroimage. 2006;31:1116–1128. doi: 10.1016/j.neuroimage.2006.01.015. [DOI] [PubMed] [Google Scholar]
- 20.Salomão SR, Ventura DF. Large sample population age norms for visual acuities obtained with Vistech-Teller Acuity Cards. Invest Ophthalmol Vis Sci. 1995;36:657–670. [PubMed] [Google Scholar]
- 21.Odom JV, Bach M, Barber C, et al. Visual evoked potentials standard (2004) Doc Ophthalmol. 2004;108:115–123. doi: 10.1023/b:doop.0000036790.67234.22. [DOI] [PubMed] [Google Scholar]
- 22.Saunders KJ, Brown G, McCulloch DL. Pattern-onset visual evoked potentials: more useful than reversal for patients with nystagmus. Doc Ophthalmol. 1998;94:265–274. doi: 10.1007/BF02582984. [DOI] [PubMed] [Google Scholar]
- 23.Packer RJ, Lange B, Ater J, et al. Carboplatin and vincristine for recurrent and newly diagnosed low-grade gliomas of childhood. J Clin Oncol. 1993;11:850–856. doi: 10.1200/JCO.1993.11.5.850. [DOI] [PubMed] [Google Scholar]
- 24.Dalla Via P, Opocher E, Pinello ML, et al. Visual outcome of a cohort of children with neurofibromatosis type 1 and optic pathway glioma followed by a pediatric neuro-oncology program. Neuro Oncol. 2007;9:430–437. doi: 10.1215/15228517-2007-031. [DOI] [PMC free article] [PubMed] [Google Scholar]
- 25.Rabin J, Switkes E, Crognale M, et al. Visual evoked potentials in three-dimensional color space: correlates of spatio-chromatic processing. Vision Res. 1994;34:2657–2671. doi: 10.1016/0042-6989(94)90222-4. [DOI] [PubMed] [Google Scholar]
- 26.Kelly JP, Weiss AH. Comparison of pattern visual-evoked potentials to perimetry in the detection of visual loss in children with optic pathway gliomas. J AAPOS. 2006;10:298–306. doi: 10.1016/j.jaapos.2006.02.003. [DOI] [PubMed] [Google Scholar]
- 27.Rodriguez FJ, Perry A, Gutmann DH, et al. Gliomas in neurofibromatosis type 1: a clinicopathologic study of 100 patients. J Neuropathol Exp Neurol. 2008;67:240–249. doi: 10.1097/NEN.0b013e318165eb75. [DOI] [PMC free article] [PubMed] [Google Scholar]
- 28.Iannaccone A, McCluney RA, Brewer VR, et al. Visual evoked potentials in children with neurofibromatosis type 1. Doc Ophthalmol. 2002;105:63–81. doi: 10.1023/a:1015719803719. [DOI] [PubMed] [Google Scholar]
- 29.North K, Cochineas C, Tang E, Fagan E. Optic gliomas in neurofibromatosis type 1: role of visual evoked potentials. Pediatr Neurol. 1994;10:117–123. doi: 10.1016/0887-8994(94)90043-4. [DOI] [PubMed] [Google Scholar]


