

Abstract
Six monophyletic groups of charophycean green algae are recognized within the Streptophyta. Although incongruent with earlier studies based on genes from three cellular compartments, chloroplast and nuclear phylogenomic analyses have resolved identical relationships among these groups, placing the Zygnematales or the Zygnematales + Coleochaetales as sister to land plants. The present investigation aimed at determining whether this consensus view is supported by the mitochondrial genome and at gaining insight into mitochondrial DNA (mtDNA) evolution within and across streptophyte algal lineages and during the transition toward the first land plants. We present here the newly sequenced mtDNAs of representatives of the Klebsormidiales (Entransia fimbriata and Klebsormidium spec.) and Zygnematales (Closterium baillyanum and Roya obtusa) and compare them with their homologs in other charophycean lineages as well as in selected embryophyte and chlorophyte lineages. Our results indicate that important changes occurred at the levels of genome size, gene order, and intron content within the Zygnematales. Although the representatives of the Klebsormidiales display more similarity in genome size and intron content, gene order seems more fluid and gene losses more frequent than in other charophycean lineages. In contrast, the two members of the Charales display an extremely conservative pattern of mtDNA evolution. Collectively, our analyses of gene order and gene content and the phylogenies we inferred from 40 mtDNA-encoded proteins failed to resolve the relationships among the Zygnematales, Coleochaetales, and Charales; however, they are consistent with previous phylogenomic studies in favoring that the morphologically complex Charales are not sister to land plants.
Keywords: Streptophyta, Charophyceae, charophytes, mitochondrial DNA, phylogenomics, genome evolution
Introduction
Between 500 and 450 Ma, the first land plants emerged on Earth from green algal ancestors related to the contemporary freshwater green algae classified in the Charophyceae (Gensel 2008; Kenrick et al. 2012). Charophycean green algae and land plants form the Streptophyta (Bremer et al. 1987), whereas all other green algae belong to the sister lineage Chlorophyta (Lewis and McCourt 2004). Six monophyletic groups of charophycean green algae are currently recognized: the Mesostigmatales, Chlorokybales, Klebsormidiales, Zygnematales, Coleochaetales, and Charales, given here in order of increasing cellular complexity.
Which charophycean group gave rise to the land plants? As indicated by several phylogenetic studies of multigene data sets, this is a difficult question to address. Analyses of four genes from the nucleus (18S rRNA gene), chloroplast (atpB and rbcL), and mitochondria (nad5) of 25 charophycean green algae, 8 land plants, and 5 chlorophytes identified with great support the Charales as the closest green algal relatives of land plants; however, the positions of the other charophycean groups received moderate support (Karol et al. 2001; McCourt et al. 2004). The best trees inferred in this four-gene analysis supported an evolutionary trend toward increasing cellular complexity; undeniably, this was an appealing result. The same topology was recovered in another analysis of combined genes from the three cellular compartments (Qiu et al. 2006). The latter two studies turned out to conflict with analyses of multiple chloroplast and nuclear genes. In agreement with trees inferred from the chloroplast small and large subunit rRNA genes (Turmel, Ehara et al. 2002), a whole-chloroplast genome study by our group resolved the Charales before the divergence of the Coleochaetales and Zygnematales and showed that either the Zygnematales or a clade composed of the Zygnematales and Coleochaetales are the closest relatives of land plants (Turmel et al. 2006, 2007b). Recently, this conclusion received support from three independent nuclear phylogenomic analyses (Wodniok et al. 2011; Laurin-Lemay et al. 2012; Timme et al. 2012), thus reinforcing confidence in the basal position of the Charales. Furthermore, Laurin-Lemay et al. (2012) have provided strong evidence that the Coleochaetales + Zygnematales are sister to land plants. Why the analyses of combined genes yielded a different topology is unclear, but it is worth mentioning here that the misleading signal supporting the strong affiliation of the Charales with the land plants in the four-gene analysis was mainly contributed by nad5, the sole mitochondrial gene in the data set (Turmel et al. 2006). When using multigene sequence alignments for resolving deeply diverging relationships, misleading information due to violations of evolutionary models, bias in sequence composition, or sequence heterotachy may yield the wrong tree topology (Phillips et al. 2004; Jeffroy et al. 2006; Philippe et al. 2011b).
In the present investigation, we undertook a detailed analysis of streptophyte mitochondrial genomes in order to explore the evolutionary patterns of mitochondrial DNA (mtDNA) and also to determine whether a mitochondrial phylogeny congruent with those previously inferred from chloroplast and nuclear genes can be reconstructed. To date, the mitochondrial genomes of five charophyceans representing four distinct lineages, i.e., the genomes of Mesostigma viride (Mesostigmatales), Chlorokybus atmophyticus (Chlorokybales), Chaetosphaeridium globosum (Coleochaetales), and Chara vulgaris (Charales), have been described in the literature (Turmel et al. 2002a, 2002b, 2003, 2007a). These genomes show substantial variability in size, gene order, gene density, and intron content. The Chara mtDNA was found to be the most similar to its bryophyte counterparts at the levels of gene order and intron content, and it was also the closest to land plants mtDNAs in phylogenetic analyses of multiple genes (Turmel et al. 2003). More recently, the mtDNA sequence of another charalean green alga, Nitella hyalina, has become available (GenBank accession NC_017598).
Here, we report the mtDNA sequences of two charophyceans representing the Klebsormidiales, Entransia fimbriata and Klebsormidium spec., and of two others representing the Zygnematales, Closterium baillyanum and Roya obtusa. These genome sequences were compared with those previously reported for the abovementioned charophycean green algae and for selected embryophytes and chlorophytes. The results unveiled the dynamic nature of the mitochondrial genome in both the Klebsormidiales and Zygnematales. At the levels of gene order and gene content, we found that the Zygnematales and the Zygnematales + Coleochaetales uniquely share more structural genomic characters with bryophytes than the Charales. Our phylogenetic studies of 40 concatenated proteins were complicated by systematic errors causing the affiliation of the Charales with land plants, but when we minimized the impact of these errors, trees weakly supporting the notion that the Charales are not sister to land plants were recovered.
Materials and Methods
Strains and Culture Conditions
Strains of Klebsormidium spec. (SAG 51.86), Closterium baillyanum (SAG 50.89), and Roya obtusa (SAG 168.80) were obtained from the Sammlung von Algenkulturen Göttingen, whereas Entransia fimbriata (UTEX LB 2353) originated from the Culture Collection of Algae at the University of Texas at Austin. All four strains were grown in C medium (Andersen 2005) under alternating 12-h light/dark periods.
DNA Sequencing and Sequence Analyses
For each strain, an A + T rich organellar DNA fraction was obtained by CsCl–bisbenzimide isopycnic centrifugation of total cellular DNA as described earlier (Turmel et al. 1999). The Entransia and Roya organellar fractions were sequenced using 454 GS FLX Titanium technology at the Plate-forme d’Analyses Génomiques of Laval University (http://pag.ibis.ulaval.ca/seq/en/index.php, last accessed September 27, 2013). The 454 pyrosequencing reads were assembled using Newbler v2.5 (Margulies et al. 2005) with default parameters. For the Klebsormidium and Closterium mitochondrial genomes, random clone libraries were prepared from 1,500 to 2,000 bp fragments derived from the A + T rich DNA fractions using the pSMART-HCKan (Lucigen Corporation, Middleton, WI) plasmid. Positive clones were selected by hybridization of each plasmid library with the original DNA used for cloning. DNA templates were amplified using the Illustra TempliPhi Amplification Kit (GE Healthcare, Baie d’Urfé, Canada) and sequenced with the PRISM BigDye terminator cycle sequencing ready reaction kit (Applied Biosystems, Foster City, CA) on ABI model 373 or 377 DNA sequencers (Applied Biosystems), using T3 and T7 primers as well as oligonucleotides complementary to internal regions of the plasmid DNA inserts. The resulting sequences were edited and assembled using SEQUENCHER 4.8 (Gene Codes Corporation, Ann Arbor, MI). Genomic regions not represented in the sequence assemblies or plasmid clones were directly sequenced from polymerase chain reaction-amplified fragments using internal primers.
Genes and open reading frames (ORFs) were identified using a custom-built suite of bioinformatic tools as described previously (Pombert et al. 2005). tRNA genes were localized using tRNAscan-SE (Lowe and Eddy 1997). Intron boundaries were determined by modeling intron secondary structures (Michel et al. 1989; Michel and Westhof 1990) and by comparing intron-containing genes with intronless homologs using FRAMEALIGN of the Genetics Computer Group software (version 10.3) package (Accelrys, San Diego, CA). To estimate the proportion of repeated sequences, repeats ≥30 bp were retrieved using REPFIND of the REPuter 2.74 program (Kurtz et al. 2001) with the options -f (forward) -p (palindromic) -l (minimum length = 30 bp) -allmax and then masked on the genome sequence using REPEATMASKER (http://www.repeatmasker.org/, last accessed September 27, 2013) running under the Crossmatch search engine (http://www.phrap.org/, last accessed September 27, 2013).
Analyses of Gene Order Data
We used a custom-built program to identify the regions that display the same gene order in selected pairs of streptophyte mtDNAs. This program was also employed to convert gene order in each of 16 streptophyte mtDNAs to all possible pairs of signed genes (i.e., taking into account gene polarity). The presence/absence of the signed gene pairs in two or more genomes was coded as binary Dollo characters using MacClade 4.08 (Maddison and Maddison 2000). The resulting gene order data set was subjected to maximum parsimony (MP) analysis using PAUP 4.0b10 (Swofford 2003). Confidence of branch points was estimated by 1,000 bootstrap replications.
Phylogenies based on inversion medians were inferred with GRAPPA 2.0 (http://www.cs.unm.edu/∼moret/GRAPPA/, last accessed September 27, 2013) using the algorithm of Caprara (2003) and a data set of 55 gene/pseudogene positions. Although this software can use breakpoint medians to compute trees, we used inversion medians because this method has been shown to outperform breakpoint medians in phylogeny reconstructions (Moret et al. 2002).
Phylogenetic Reconstructions from Sequence Data
Mitochondrial genome sequences were retrieved from GenBank for the 25 green plant taxa listed in table 1. We selected for analysis the protein-coding genes that are shared by at least 14 of the 25 taxa. Forty genes met this criterion: atp1, 4, 6, 8, 9, cob, cox1, 2, 3, mttB, nad1, 2, 3, 4, 4L, 5, 6, 7, 9, rpl2, 5, 6, 10, 16, rps1, 2, 3, 4, 7, 10, 11, 12, 13, 14, 19, sdh3, 4, and yejR, U, V. An amino acid data set was prepared as follows. The deduced amino acid sequences from the 40 individual genes were aligned using MUSCLE 3.7 (Edgar 2004), and the ambiguously aligned regions in each alignment were removed using TRIMAL 1.3 (Capella-Gutierrez et al. 2009) with the following options: block = 7, gt = 0.7, st = 0.001, and sw = 3, and the protein alignments were concatenated. Missing characters represented 12.5% of the amino acid data set. This data set is available upon request to the corresponding author.
Table 1.
General Features of the Streptophyte and Chlorophyte mtDNAs Compared in This Study
 |
aDifferent colors, also used in figures, denote the distinct charophycean and bryophyte lineages.
bNumber of trans-spliced introns is given in parentheses.
cNonoverlapping repeat elements were mapped on each genome with RepeatMasker using the repeats ≥30 bp identified with REPuter as input sequences.
dThis species was formally called Microspora stagnorum (Mikhailyuk et al. 2008).
eThis species name has been changed to Nothoceros (Villarreal et al. 2010).
Phylogenies were inferred from the amino acid data set using the maximum likelihood (ML) and Bayesian inference (BI) methods. ML analyses were carried out using RAxML 7.2.8 (Stamatakis 2006) and the site-homogeneous LG + Γ4 + F and GTR + Γ4 models of sequence evolution. Confidence of branch points was estimated by fast-bootstrap analysis (f option = a) with 100 pseudoreplicates. BI analyses were performed with PhyloBayes 3.3e (Lartillot et al. 2009) using the site-heterogeneous CAT + Γ4 and CATGTR + Γ4 models (Lartillot and Philippe 2004). To establish the appropriate conditions for these analyses, two independent chains were run for 10,000 cycles under the CAT + Γ4 model and for 2,000 cycles under the CATGTR + Γ4 model, and consensus topologies were calculated from the saved trees using the BPCOMP program of PhyloBayes after a burn-in of 2,000 and 500 cycles, respectively. Under these conditions, the largest discrepancy we observed across all bipartitions in the consensus topologies (maxdiff) was lower than 0.10, indicating that convergence between the two chains was achieved. For the bootstrap analyses, 100 pseudoreplicates were generated using the SEQBOOT program of the PHYLIP package (Felsenstein 1989), and BI chains were run on these pseudoreplicates using the conditions just described. In the CAT + Γ4 analyses, one chain was thus run for 10,000 cycles (with each cycle sampled) for each pseudoreplicate and a consensus tree was computed with the READPB program of PhyloBayes after elimination of 2,000 burn-in trees. The same procedure was applied to each pseudoreplicate in the analysis done under the CATGTR + Γ4 model, except that the chain was run for 2,000 cycles with a burn-in of 500 cycles. In both analyses, a bootstrap consensus tree was generated from the 100 resulting consensus trees using the CONSENSE program of the PHYLIP package.
Cross-validation tests were conducted to evaluate the fits of the four models of amino acid substitutions to the data set. They were carried out with PhyloBayes using ten randomly generated replicates. Cross-validation is a very general statistical method for comparing models. The procedure can be summarized as follows. The data set is randomly partitioned into two unequal subsets, the learning set (also called the training set) and the test set. The learning set serves to estimate the parameters of the model and these parameters are then used to compute the likelihood of the test set. To reduce variability, multiple rounds of cross-validation are performed using different partitions and the resulting log-likelihood scores (which measure how well the test sets were predicted by the model) are averaged over the rounds.
To analyze the amino acid composition of the data set, we first assembled a 20 × 25 matrix containing the frequency of each amino acid per species using the program Pepstats of the EMBOSS package (Rice et al. 2000). A correspondence analysis of this data set was then performed using the R package ca (Nenadic and Greenacre 2007).
Testing Robustness of Trees by Removal of Fast-Evolving Sites
The influence of removing increasing proportions of fast-evolving sites in the amino acid data set was investigated as follows. Substitution rates among sites in the data set were estimated with CODEML in PAML 4.6 (Yang 2007) for the four alternative topologies observed for the streptophyte green algal lineages in bootstrap analyses with the CAT + Γ4 and CATGTR + Γ4 models. These rates were averaged for each site, and the fastest evolving sites were incrementally removed in 5% intervals using MESQUITE 2.75 (Maddison and Maddison 2011) in order to generate five subsets of data. RAxML analyses of these data subsets were performed as described above for the original amino acid data set. The five trimmed data sets were also analyzed with PhyloBayes under the CAT + Γ4 and CATGTR + Γ4 models. Two independent chains were run for 5,000 cycles (with each cycle sampled) with a burn-in of 1,000 cycles in each of the analyses under the CAT + Γ4 model, whereas the two chains were run for 2,000 cycles with a burn-in of 500 cycles in the analyses under the CATGTR + Γ4 model. Consensus trees and posterior probability values were computed from saved trees after burn-in, using the BPCOMP program of PhyloBayes.
Bootstrap analyses of the trimmed data set lacking 20% of the fastest evolving sites were carried out with RAxML and PhyloBayes essentially as described for the original amino acid data set. For the BI analyses under the CAT + Γ4 and CATGTR + Γ4 models, we confirmed that the largest discrepancy across all bipartitions in the consensus trees obtained from two independent chains was lower than 0.10.
Saturation levels of the original amino acid data set and of the trimmed data set lacking 20% of the fastest evolving sites were estimated by computing the slopes of the regression plots of patristic distances versus observed distances using KaleidaGraph 4.1.3 (Synergy Software, Reading, PA). For each data set, patristic distances were calculated using PATRISTIC 1.0 (Fourment and Gibbs 2006) from the branch lengths of the best tree inferred under the CATGTR + Γ4 model, whereas the observed distances were derived from pair-wise comparisons between the raw sequences of the data set using MEGA 5 (Tamura et al. 2011).
Results
The members of the Klebsormidiales we selected for mtDNA sequencing, Entransia and Klebsormidium, represent distinct major lineages (Karol et al. 2001; Mikhailyuk et al. 2008). In the Zygnematales, we also sampled two distantly related species, Closterium and Roya. Although Closterium is known to belong to the Desmidiales, it remains unclear whether Roya is part of the other major lineage recognized in the Zygnematales (McCourt et al. 2000; Gontcharov et al. 2004; Hall et al. 2008). Concerning the phylogenetic positions of the members of the Charales whose mtDNAs were compared here, it has been shown that the Chara and Nitella genera are part of separate major lineages (Karol et al. 2001).
Comparison of Structural Genomic Features
The gene maps of the klebsormidialean and zygnematalean mitochondrial genomes are shown in supplementary figures S1 and S2, Supplementary Material online, respectively. The structural features of these four newly sequenced genomes were compared with those previously observed for five charophyceans and seven bryophytes (table 1). The latter land plants represent all three known lineages of bryophytes and consist of three liverworts (Marchantia polymorpha, Treubia lacunosa, and Pleurozia purpurea), two hornworts (Megaceros aenigmaticus and Phaeceros laevis), and two mosses (Physcomitrella patens and Anomodon rugelii). For certain analyses, we have also included representatives of chlorophytes and seed plants (table 1).
Genome Size and Gene Content
All compared charophycean mitochondrial genomes, except the mtDNAs of Chlorokybus and of the zygnematelean Closterium, are smaller in size than their bryophyte counterparts (table 1 and fig. 1). Important differences in mitochondrial genome size are found among distinct charophycean lineages as well as within individual lineages, in particular the Mesostigma/Chlorokybus clade and the Zygnematales. In this regard, it is noteworthy that the two representatives of the Charales, Chara and Nitella, carry very similar mitochondrial genomes; these mtDNAs, which differ by only 12,447 bp, contain the same gene complement and display exactly the same gene order. Overall, the total lengths of both the intergenic and intronic regions in mtDNA changed substantially during charophycean evolution, even though the total lengths of coding regions remained similar (fig. 1). Repeated sequences account for less than 7.5% of the total mitochondrial genome size in charophyceans, the observed variation being comparable to that found in bryophyte mtDNAs (table 1).
Fig. 1.—

Total lengths of coding, intronic, and intergenic sequences in the streptophyte mtDNAs examined in this study. Note that intron-encoded genes were not considered as coding sequences but rather as intron sequences and that trans-spliced introns were not taken into account to estimate the total lengths of intron sequences because their sizes are usually not annotated in the GenBank accessions. Species names are abbreviated as in table 1.
Among the 16 charophycean and bryophyte mtDNAs examined in this study, the total number of standard genes ranges from 42 (in the hornwort Megaceros) to 71 (in Chlorokybus and the zygnematelean Closterium), with most genomes exhibiting between 65 and 71 genes (table 1). As in other charophycean mtDNAs, all protein-coding genes in the newly sequenced genomes were annotated using the standard genetic code, thus providing no evidence for RNA editing. The few genes that were lost from the mitochondrial genome during charophycean evolution code mainly for tRNAs (trn genes), ribosomal proteins (rps and rpl), and subunits involved in cytochrome c biogenesis (yej, also designated as ccm) (fig. 2). In land plant mtDNAs, the same categories of genes are prone to extinction (see fig. 2) (Adams et al. 2002; Knoop 2013). Certain mitochondrial genes were lost in a lineage-specific fashion, whereas others were lost in two or more lineages. Lineage-specific gene losses occurred at highest frequency in the Klebsormidiales and in the hornworts. The genes whose absence was recorded in multiple lineages are of special interest as they can be phylogenetically informative. In this context, we note that trnI(gau) is uniformly absent from the three bryophyte lineages and the Zygnematales, whereas rpl14 is missing from the bryophyte lineages, the Zygnematales and the Coleochaetales.
Fig. 2.—
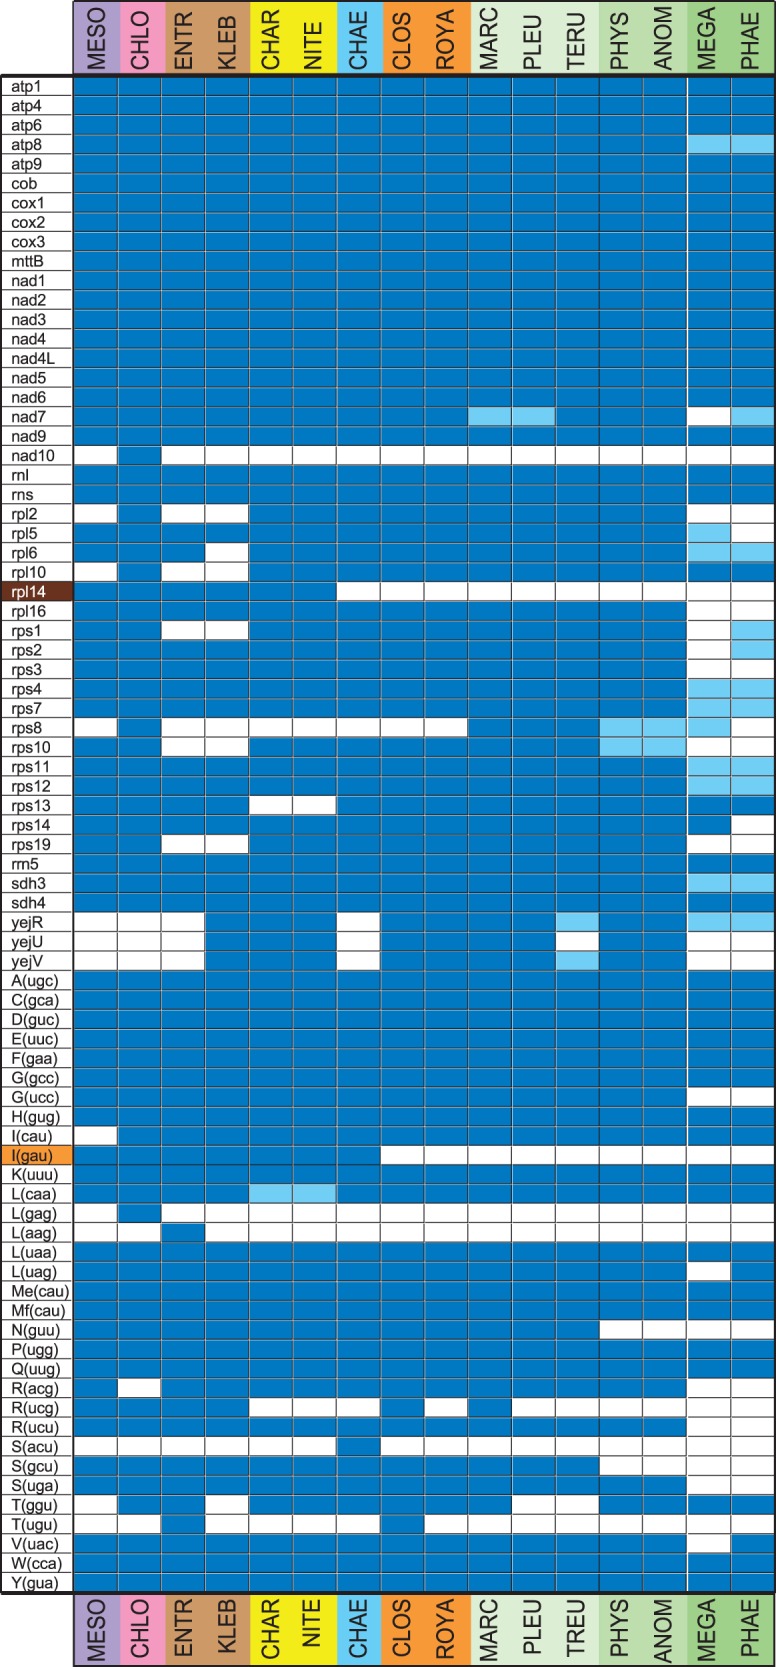
Gene repertoires of the streptophyte mitochondrial genomes examined in this study. The presence of a standard gene is indicated by a dark blue box and the presence of a pseudogene by a light blue box. The different colors on the left of the figure refer to gene distributions supporting distinct hypotheses concerning the sister group of land plants: orange, Zygnematales; brown, Coleochaetales + Zygnematales.
Two tRNA genes not previously identified in streptophyte mitochondria, trnL(aag) and trnT(ugu), were annotated in the course of this study. The trnT(ugu) gene is present in the klebsormidialean Entransia and the zygnematalean Closterium, whereas trnL(aag) is found only in Entransia. Given that these mitochondrial genes have been described so far in only a few chlorophytes and are also rarely found or absent in other algal groups, they were almost certainly not inherited vertically from the common ancestor of all streptophytes. Our similarity searches against the nonredundant database of the National Center for Biotechnology Information using Entransia trnL(aag) as the query sequence failed to reveal any tRNA gene sharing substantial sequence identity. However, both the Entransia and Closterium trnT(ugu) genes were found to exhibit high sequence similarities with trnT(ugu) genes originating from the chloroplasts of red algae and glaucocystophytes. Two other tRNA genes showing a restricted distribution in streptophytes and other algal groups, trnS(acu) et trnR(ucg), have presumably not been inherited through vertical inheritance from the last common ancestor of streptophytes. Our similarity searches suggest that trnS(acu), documented uniquely in Chaetosphaeridium mtDNA, originates in part from the mitochondrial trnT(ggu), as we detected substantial sequence similarity between the 3′ portions of these two genes from Chaetosphaeridium. The evolutionary history of trnR(ucg) is more complex, given the evidence that it arose in chlorophyte and streptophyte mtDNAs through duplication and mutation of either trnR(acg) (in the Mesostigma and Nephroselmis lineages) or trnR(ucu) (in the Chlorokybus and Marchantia lineages) (Oda et al. 1992; Turmel et al. 2003; Wang et al. 2009). Our analyses showed that the mitochondrial trnR(ucg) genes of the two klebsormidialeans and the zygnematalean Closterium are highly similar to one another and also share high similarity with the mitochondrial trnR(acg) gene.
In the Klebsormidium and Roya mtDNAs, we discovered potential coding sequences that are not usually found in green plant mitochondrial genomes. The orf209 of Klebsormidium, which is embedded within a 7.1-kb region containing only three tRNA genes (supplementary fig. S1, Supplementary Material online), shows strong sequence homology (E = e−50) with bacterial and phycodnavirus genes encoding C-5 cytosine-specific DNA methyltransferases. The nonstandard gene (orf235) in the Roya mtDNA also resides in a relatively long intergenic region (supplementary fig. S2, Supplementary Material online) and its predicted product is related to phage integrases/recombinases (E = 1e−09) and to putative proteins encoded by the mtDNAs of Chaetosphaeridium (orf202, E = 9e−31) and the chlorophyte Prototheca wickerhamii (orf304, E = 4e−24). In both the Roya and Chaetosphaeridium mtDNAs, the putative integrase/recombinase gene is located downstream of the large subunit rRNA gene (rnl).
Intront Content
In contrast to their land plant counterparts, charophycean mtDNAs are extremely variable in intron content (table 1 and figs. 3 and 4). All the introns identified so far in charophycean and bryophyte genomes, except for two group II introns in the tightly packed mtDNA of Mesostigma viride, are cis-spliced. Charophycean group I and group II introns lie at 37 and 44 distinct genomic sites (in 8 and 24 genes), respectively. Even within individual charophycean lineages, there are sharp differences in intron content. For instance, within the Zygnematales, the Closterium and Roya mtDNAs harbor as many as 31 introns and as few as two introns, respectively; the latter, which are both inserted into tRNA genes and belong to the group II family, are conserved between the two zygnematalean taxa and are also present in other charophycean or bryophyte lineages. Within the Klebsormidiales, the five Entransia and nine Klebsormidium introns share no homolog, although similar introns reside at identical insertion sites in other charophycean mtDNAs. Moreover, the mtDNAs of the charalean Chara (27 introns) and Nitella (20 introns), both of which contain numerous group I and group II introns, have in common a high proportion of group II introns but share only two group I introns at the same sites.
Fig. 3.—

Distribution of group I introns among the chlorophyte and streptophyte mtDNAs examined in this study. The presence of an intron containing an ORF is denoted by a dark blue box, whereas the presence of an intron lacking an ORF is denoted by a lighter blue box. Intron insertion sites in protein-coding and tRNA genes are given relative to the corresponding genes in Mesostigma mtDNA; insertion sites in rns and rnl are given relative to the Escherichia coli 16S and 23S rRNAs, respectively. For each insertion site, the position corresponding to the nucleotide immediately preceding the intron is reported.
Fig. 4.—

Distribution of group II introns among the chlorophyte and streptophyte mtDNAs examined in this study. The presence of a cis-spliced intron containing an ORF is denoted by a dark blue box, whereas the presence of a cis-spliced intron lacking an ORF is denoted by a lighter blue box. Trans-spliced introns are represented by purple boxes. Intron insertion sites in protein-coding and tRNA genes are given relative to the corresponding genes in Mesostigma mtDNA; insertion sites in rns and rnl are given relative to the Escherichia coli 16S and 23S rRNAs, respectively. For each insertion site, the position corresponding to the nucleotide immediately preceding the intron is reported.
In a previous study (Turmel et al. 2003), we found that four group II introns within cox2 (site 71), nad3 (site 140), nad4 (site 949), and rps3 (site 77) are shared between Chara and some land plant lineages, including bryophytes (fig. 4). The expanded data reported here confirm that these sites are occupied by introns that are shared solely by members of the Charales (three of the four introns are present in both Chara and Nitella) and one or more land plant linages. In addition, we identified an extra site in cox2 (site 343) that is occupied by a group II intron shared between Nitella, mosses, hornworts, and some seed plants. Moreover, a group II intron at another site in cox2 (site 220) as well as a group I intron in nad5 (site 723) were found only in the zygnematalean Closterium and some bryophyte lineages (figs. 3 and 4).
Gene Order
To compare the gene organizations of the charophycean and bryophyte mtDNAs in our study group, we examined the gene pairs and gene clusters they share and also inferred a scenario of genome rearrangements. Figure 5 presents one of the two gene-pair analyses that we performed. The mtDNAs of four green algae representing early diverging lineages of the Chlorophyta (i.e., three members of the Prasinophyceae and Prototheca wickerhamii, a representative of the Trebouxiophyceae) were included in this analysis in an attempt to distinguish conserved gene clusters that predate the divergence of chlorophytes and streptophytes (i.e., ancestral clusters) from those that arose during charophycean evolution. The ancestral gene pairs appear to be more prevalent in the Klebsormidiales and Charales than in the other streptophyte lineages. With regard to the gene pairs that are streptophyte-specific, they are most abundant in the Zygnematales and Charales and their proportions in these lineages are comparable to those observed in liverworts and mosses. We identified the streptophyte-specific gene pairs (synapomorphies) that are shared exclusively between the Charales and bryophytes; between the Coleochaetales, Zygnematales, and bryophytes; and also between the Zygnematales and bryophytes in order to evaluate which of the three current hypotheses concerning the identity of the charophycean lineage(s) being sister to land plants is best supported (fig. 5, compare the gene pairs shown in different colors). The hypothesis that the Coleochaetales + Zygnematales are sister to the land plant lineage received the strongest support. In this context, it is worth pointing out that several gene pairs are uniquely shared between the Charales, Zygnematales, and land plants (fig. 5), thus providing support for a basal position of the Coleochaetales relative to these lineages. In a separate analysis, we assembled a data set of 134 gene pairs from 16 streptophytes (128 phylogenetically informative characters), in which the gene pairs were coded as binary Dollo characters (presence/absence), and used this data set to infer a phylogeny using MP (fig. 6). The majority-rule consensus tree of the bootstrap replicates resolved with weak bootstrap (BP) support the Coleochaetales and Zygnematales as sister to land plants and the Charales as sister to the Coleochaetales + Zygnematales + land plants.
Fig. 5.—

Distribution of mitochondrial gene/pseudogene pairs that are shared by at least two charophycean and two chlorophyte taxa, by at least three charophycean taxa, or by at least one charophycean and two bryophyte lineages. The presence of a gene pair is denoted by a dark blue box. A light green box refers to a gene pair in which at least one gene is missing in some lineages due to gene loss. Ancestral gene pairs, that is, gene pairs common to chlorophytes and streptophytes, are presented first. The yellow, orange, and brown colors on the left of the figure refer to derived gene pairs (synapomorphies) supporting the three current hypotheses concerning the sister group of land plants: yellow, Charales; orange, Zygnematales; brown, Coleochaetales + Zygnematales. The blue color on the left of the figure refers to the gene pairs supporting the alternative hypothesis that the Coleochaetales are sister to the Charales, Zygnematales, and land plants. Note that the 3′yejV–5′yejU pair was considered to be an ancestral linkage because it is found in the few protist lineages that have retained these genes, more specifically in the bacteria-like and gene-rich mitochondrial genomes of jakobids (Burger et al. 2013).
Fig. 6.—

Majority-rule consensus tree inferred by MP analysis using a data set of 134 gene pairs. BP support values are indicated on the nodes.
Conserved gene pairs in streptophyte mtDNAs form larger conserved clusters whose numbers, sizes, and arrangements differ according to the lineage examined. The gene clusters in the Chara/Nitella, Roya, Closterium, and Chaetosphaeridium mtDNAs that are conserved with the mtDNA of the moss Physcomitrella are highlighted in supplementary figure S3, Supplementary Material online. It can be seen that the mtDNAs of Chara/Nitella show the highest level of synteny with the Physcomitrella genome, as they feature both the minimal number of gene clusters and the maximal number of genes in these clusters. A phylogeny based on inversion medians was inferred from a data set of 55 gene positions from eight streptophytes using GRAPPA and the algorithm of Caprara (which minimizes the number of reversals) (supplementary fig. S4, Supplementary Material online). Note here that inversions might not be the predominant mode of rearrangements for the mtDNAs we examined, as models involving duplication and deletion have been proposed to explain structural variation for the complex mitochondrial genomes of two angiosperms, maize (Darracq et al. 2010) and Brassica (Chang et al. 2011). No representative of the hornworts was included in our analysis because too many mitochondrial genes were lost in this bryophyte lineage (see fig. 2) and only the genes common to all taxa can be analyzed using GRAPPA. We recovered a single best tree with 109 inversion medians. This tree shows that the two zygnematalean genomes are the most similar to their bryophyte counterparts; however, they do not form a clade. The branch corresponding to the mtDNAs of the Charales is basal relative to those corresponding to the mtDNAs of the Coleochaetales and Zygnematales.
Phylogenetic Analyses of Sequence Data
We assembled an amino acid data set of 9,013 unambiguously aligned positions from 40 mitochondrial protein-coding genes of 21 streptophytes and four chlorophytes. The chlorophyte sequences served as outgroup to root the trees. The data set was analyzed by ML and BI methods using the site-homogeneous LG + Γ4 and GTR + Γ4 models of amino acid substitutions (ML) and the site-heterogeneous CAT + Γ4 and CATGTR + Γ4 models (BI). The fits of these models of sequence evolution to the data set of 9,013 positions were assessed using cross-validation (supplementary table S1, Supplementary Material online). As expected, the site-heterogeneous models proved to be superior to the site-homogeneous models. The CATGTR + Γ4 model is the model that best fits the data set, whereas the CAT + Γ4 model has a better fit than the GTR + Γ4 and LG + Γ4 models. Considering that the GTR + Γ4 model has a better fit than the LG + Γ4 model, it appears that the size of the data set is sufficiently large to estimate a GTR amino acid substitution matrix that models more accurately our data than the empirical LG matrix. We analyzed the amino acid composition of the data set of 9,013 positions because heterogeneity in amino acid composition may violate the stationarity assumption made by most models of sequence evolution (Lockhart et al. 1994; Gowri-Shankar and Rattray 2006). No large deviations in amino acid composition of mitochondrial proteins were found among the taxa examined (supplementary fig. S5, Supplementary Material online).
Regardless of the method of analysis and the model of sequence evolution used, we observed with high BP support that the Mesostigma + Chlorokybus clade occupies the first branch of the Streptophyta and that the clade formed by the two klebsormidialean green algae represents the second deepest divergence (fig. 7). In contrast, the relationships among the Coleochaetales, Zygnematales, and Charales were influenced by the model used. The ML analyses under the LG + Γ4 and GTR + Γ4 models as well as the BI phylogeny under the CAT + Γ4 model favored the placements of the Charales as sister to the land plants and of the Zygnematales as sister to the Charales + land plants clade (T1 topology). On the other hand, the BI analysis done under the CATGTR + Γ4 model favored a sister group relationship between the Zygnematales and land plants and placed the Charales just before the divergence of the Zygnematales (T2 topology), albeit BP support for these positions was weak. Use of the best-fitting model not only lowered the frequency with which the T1 topology was detected among the bootstrap pseudoreplicates but also increased the frequencies of the alternative topologies T3 and T4 in which the Charales diverged earlier than the Coleochaetales and Zygnematales (table 2). The sister group to all land plants is the Coleochaetales + Zygnematales clade in T3, whereas it is the Zygnematales in T4. Regarding the relationships among land plants, the method of analysis used was found to influence the branching order of the three major bryophyte lineages. Consistent with previously reported phylogenies inferred from multiple genes (Qiu et al. 2006), the liverworts are sister to all other land plants in the mitochondrial trees constructed with the BI method (CATGTR + Γ4 and CAT + Γ4 models); however, both the liverworts and the mosses are united in the same clade in the ML trees (GTR + Γ4 and LG + Γ4 models).
Fig. 7.—

Majority-rule consensus tree inferred by PhyloBayes under the CAT + Γ4 model using a data set of 9,013 positions assembled from 40 mtDNA-encoded proteins. BP support values are reported on various nodes: from top to bottom are shown the values for the PhyloBayes CATGTR + Γ4 and CAT + Γ4 analyses and for the RAxML GTR + Γ4 and LG + Γ4 analyses. Black dots indicate that the corresponding branches received 100% BP support in all four analyses. The histograms on the left indicate the proportion of missing data for each taxon. The scale bar denotes the estimated number of amino acid substitutions per site.
Table 2.
Alternative Topologies Recovered among 100 Bootstrap Pseudoreplicates in BI Analyses of the Amino Acid Data Sets of 9,013 and 7,210 Positions under the CAT + Γ4 and CATGTR + Γ4 Models
| Data Set of 9,013 Positions |
Data Set of 7,210 Positions |
||||
|---|---|---|---|---|---|
| Topology | CAT + Γ4 | CATGTR + Γ4 | CAT + Γ4 | CATGTR + Γ4 | |
| T1 | ((Meso,Chlo),(Kleb,(Cole,(Zygn,(Char,LP))))) | 55 | 32 | 33 | 21 |
| T2 | ((Meso,Chlo),(Kleb,(Cole,(Char,(Zygn,LP))))) | 25 | 34 | 64 | 59 |
| T3 | ((Meso,Chlo),(Kleb,(Char,((Coleo,Zygn),LP)))) | 17 | 24 | 3 | 12 |
| T4 | ((Meso,Chlo),(Kleb,(Char,(Coleo,(Zygn,LP))))) | 2 | 8 | 0 | 7 |
| Unresolved topologies | 1 | 2 | 0 | 1 | |
Note.—Meso, Mesostigmatales; Chlo, Chlorokybales; Kleb, Klebsormidiales; Cole, Coleochaetales; Zygn, Zygnematales; Char, Charales; LP, land plants.
We tested whether eliminating various proportions of the fastest evolving sites (i.e., the sites prone to yield a non-phylogenetic signal) from the amino acid data set has any effect on the robustness of the consensus tree and on the frequencies of the alternative topologies recovered. Five trimmed data sets, in which the sites with the highest rates of sequence evolution were deleted by 5% increment, were analyzed using the ML (LG-Γ4 model) and BI (CAT + Γ4 and CATGTR + Γ4 models) methods. As illustrated in figure 8, removal of the fastest evolving sites (5–25%) markedly lowered support for the placement of the Charales as sister to all land plants (i.e., the T1 topology) and concomitantly increased support for the sister group relationship of the Zygnematales to the land plants (i.e., T2 topology). For the data set lacking 20% of the fastest evolving sites, we also showed that it is much less saturated with substitutions than the original data set (supplementary fig. S6, Supplementary Material online). This reduced data set of 7,210 positions was further analyzed by bootstrapping using the ML and BI methods (fig. 9). The consensus trees derived from all four analyses uncovered identical relationships among the charophycean lineages, that is, the relationships corresponding to the T2 topology. The sister group relationship of the Zygnematales to the land plants received weak BP support (56–66%); however, the better fitting was the model of sequence evolution, the higher was the observed support level for this grouping. It is also worth noting that, as the fit of the model improved, the clade uniting the Charales, Zygnematales, and land plants received lowered support due to the increased frequencies of the T3 and T4 topologies (table 2).
Fig. 8.—

Changes in statistical support for the sister group of land plants in ML (RAxML LG + Γ4) and BI (PhyloBayes CAT + Γ4 and CATGTR + Γ4) analyses when increasing proportions of the fastest evolving sites were removed from the data set of 9,013 amino acid positions.
Fig. 9.—

Majority-rule consensus tree inferred by PhyloBayes under the CATGTR + Γ4 model using a data set of 7,210 positions assembled from 40 mtDNA-encoded proteins. This data set was generated from the data set of 9,013 positions by removing 20% of the fastest evolving sites. BP support values are reported on various nodes: from top to bottom are shown the values for the PhyloBayes CATGTR + Γ4 and CAT + Γ4 analyses and for the RAxML GTR + Γ4 and LG + Γ4 analyses. Black dots indicate that the corresponding branches received 100% BP support in all four analyses. The scale bar denotes the estimated number of amino acid substitutions per site.
Discussion
Prior to this study, the mtDNA of Chara was known to bear more resemblance to its bryophyte counterparts than the mtDNAs of the Mesostigmatales/Chlorokybales and Coleochaetales lineages (Turmel et al. 2003, 2007a). Although this observation is consistent with the view that the Charales are sister to land plants, it conflicts with a chloroplast phylogeny based on the small and large subunit rRNA genes (Turmel, Ehara et al. 2002) and with chloroplast and nuclear phylogenomic analyses placing the Charales before the divergence of the Zygnematales and Coleochaetales (Turmel et al. 2006, 2007b; Wodniok et al. 2011; Laurin-Lemay et al. 2012; Timme et al. 2012). In the present investigation, we have examined, for the first time, mtDNAs from representatives of the Klebsormidiales and Zygnematales to determine whether the branching order recovered in the latter studies is supported by the mitochondrial genome and also to gain insights into the dynamics of mtDNA evolution during the diversification of charophyceans and the transition from green algae to land plants.
Phylogenetic Relationships among Charophyceans and Interrelationships with Land Plants
At the gene content and gene order levels, the mtDNAs of the zygnemataleans Closterium and Roya closely resemble both their charalean and bryophyte homologs, making it difficult to identify at a glance which of these two green algal groups has the most affinity with land plants. Even though the Chara and Nitella mitochondrial genomes appear to be the least rearranged relative to bryophyte mtDNAs in comparisons of shared gene clusters (supplementary fig. S3, Supplementary Material online), the distribution patterns of rpl14 and trnI(gau) (fig. 2), both analyses of gene pairs (figs. 5 and 6) as well as the best scenario of gene rearrangements inferred with GRAPPA (supplementary fig. S4, Supplementary Material online) lend support to the hypothesis that the Zygnematales or a clade consisting of the Zygnematales and Coleochaetales are sister to land plants. Taken altogether, the gene content and gene order data reported here offer ample evidence that there exist close relationships among the Charales, Coleochaetales, and Zygnematales.
Overall, our phylogenetic analyses of two mitochondrial data sets derived from the same alignments of 40 proteins using two inference methods and four alternative evolutionary models failed to resolve unambiguously the relationships among the Charales, Coleochaetales, and Zygnematales (figs. 7 and 9). The Charales were robustly recovered as sister to land plants in the analyses of the data set of 9,013 positions under the site-homogeneous models (fig. 7), but under the most complex and best-fitting model (the site-heterogeneous CATGTR + Γ4 model), the Zygnematales or the Zygnematales + Coleochaetales clade were recovered as sister to land plants with weak BP support (42% and 24%, respectively; see table 2). Systematic errors stemming from the difficulties to detect and interpret multiple substitutions most likely caused the Charales to affiliate with land plants when suboptimal models of amino acid substitutions were used. Systematic errors are common in phylogenomic studies with sparse taxon sampling and also when some of the taxa produce long branches (Philippe et al. 2011b); in trees inferred with ML, these long branches tend to associate erroneously with those of other taxa showing high sequence divergence, yielding the well-known, long-branch attraction artifact (Felsenstein 1978). Our analyses may have been hampered by this long-branch attraction phenomenon, as the branches leading to the Zygnematales, Chaetosphaeridium, the Klebsormidiales, and Mesostigma are longer than those leading to the Charales, liverworts, and mosses. As reported in a number of studies (e.g., Philippe et al. 2011a, 2011b), our results demonstrate that the impact of non-phylogenetic signal can be substantially reduced by using the most realistic model of sequence evolution. Another approach for reducing the misleading effect of nonphylogenetic signal is to remove the fastest evolving sites from the alignment (Delsuc et al. 2005; Rodriguez-Ezpeleta et al. 2007). This approach proved effective in our study: when 20% of the fastest evolving sites were deleted from the data set of 9,013 positions, we observed that, irrespective of the model of sequence evolution used, one of the topologies displaying the sister group relationship between the Zygnematales and land plants (T2) became predominant among the bootstrap pseudoreplicates, whereas the frequency observed for the topology showing the Charales as sister to land plants (T1) decreased concomitantly (table 2). In light of chloroplast and nuclear phylogenomic studies (Turmel et al. 2006, 2007b; Wodniok et al. 2011; Laurin-Lemay et al. 2012; Timme et al. 2012), the Charales would be expected to be basally positioned relative to the Coleochaetales, Zygnematales, and land plants (T3 or T4); however, in all analyses of the reduced data set, this placement received less support than that showing the Charales as sister to the Zygnematales and land plants (table 2), suggesting that Chaetosphaeridium is still attracted to the other taxa at the base of the tree. Improving taxon sampling by including additional representatives of the Klebsormidiales, Coleochaetales, and Zygnematales should be helpful to infer more precisely multiple substitutions and hence resolve the correct relationships among the Charales, Coleochaetales, and Zygnematales, provided that sufficient phylogenetic signal has been retained in the mitochondrial genome during the radiation of these lineages.
Therefore, taken altogether, our analyses of mitochondrial gene content, gene order, and amino acid sequences concur with previously reported chloroplast and nuclear phylogenomic studies (Turmel et al. 2006, 2007b; Wodniok et al. 2011; Laurin-Lemay et al. 2012; Timme et al. 2012) in favoring the notion that the Charales are not the closest relatives of land plants. The only mtDNA data reported here that do favor the Charales as sister to land plants are the distributions we observed for the introns uniquely shared between charophyceans and land plants (fig. 4). However, introns cannot be regarded as reliable phylogenetic indicators because they are often mobile and can be lost frequently (see next section).
Evolutionary Trends of mtDNA During Charophycean Evolution and the Transition to Land Plants
We concluded in our report on the comparison of the Mesostigma and Chlorokybus mtDNAs—two genomes differing extensively in size, gene order, and intron content—that these DNAs “exemplify the marked fluidity of the mitochondrial genome in streptophyte green algae” (Turmel et al. 2007a). It was then thought that the mitochondrial genome remained compact during charophycean evolution and expanded near the time the first land plants appeared and later when the seed plants evolved (Li et al. 2009; Liu et al. 2011). The four newly sequenced genomes we report here for representatives of the Klebsormidiales and of the Zygnematales as well as our comparison of the Nitella and Chara mtDNAs now provide us with a better understanding of the dynamics of mitochondrial genome evolution in other charophycean lineages, throwing also further light into the events that occurred during the radiation of charophyceans and the origin of land plants. Our comparative analyses indicate that the charophycean mitochondrial genome experienced structural changes mainly at the levels of gene order, intron content, and sizes of intergenic regions, with the rate of changes depending on the lineage.
As in the deepest branch of the Charophyceae, the mitochondrial genome evolved in a rather dynamic fashion in the Zygnematales. Relative to the mtDNA of Roya, the 152.1-kb Closterium mtDNA is 2.2 times larger in size and 13% richer in A + T (boasting the highest A + T content among the streptophyte mtDNAs examined in our study) (table 1), contains 15 times as many introns (being the most intron-rich charophycean mtDNA identified to date), and is separated from the latter genome by as many rearrangements as found between the liverwort and moss mtDNAs (supplementary fig. S4, Supplementary Material online). The only two extra genes it contains are trnR(ucg) and trnT(ugu), two genes missing in many charophyceans and land plants (fig. 2). In this context, it is interesting to mention that, although the mtDNAs of Closterium and the liverwort Marchantia both encode trnR(ucg), this gene has different origins in the two streptophytes. Indeed, contrary to the Chlorokybus and Marchantia trnR(ucg) genes, which have been hypothesized to be independently derived from trnR(ucu) (Oda et al. 1992; Turmel et al. 2007a; Wang et al. 2009), the Closterium trnR(ucg) resembles its Mesostigma and klebsormidialean counterparts in being closely related to trnR(acg). Another interesting difference between the two zygnematalean mtDNAs concerns the structure of yejR. The Roya yejR gene resembles its land plant homologs in being split into two ORFs; however, here again, this attribute must have originated from convergent events as the sites of break-up in the zygnematalean and land plant genes are different. In light of the wide diversity of the Zygnematales—at least 4,000 species divided into two major clades, Zygnematales and Desmidiales (Gerrath 2003)—and the remarkable differences in architecture uncovered for the Closterium and Roya mtDNAs, it is almost certain that we have sampled only part of the spectrum of mtDNA variations displayed by the Zygnematales. Examination of more zygnematalean taxa will be required to determine what was the ancestral condition of the mitochondrial genome in this lineage, an information that is also needed to better understand the mtDNA changes that occurred during the transition from green algae to land plants. In this regard, our results concerning the mtDNAs of both the Zygnematales and Coleochaetales support the hypotheses that important alterations took place at the level of intron content and that RNA editing was acquired during the emergence of the first land plants (Liu et al. 2011). On the other hand, our finding that the size of the Closterium mtDNA is comparable or even higher relative to those of their liverwort and moss counterparts calls into question the notion that the mitochondrial genome increased significantly in size during this period (Li et al. 2009; Liu et al. 2011). It is entirely possible, however, that the large size of the Closterium genome was not inherited from the most recent common ancestor of land plants and charophyceans but resulted rather from genome expansion events that took place in a specific zygnematalean lineage.
Although the mtDNAs of the representatives of the Klebsormidiales exhibit less important differences in genome size and intron content than their zygnematelean homologs (table 1), they appear to be more fluid at the level of gene order as evidenced by MP analysis of gene pairs (fig. 6) and the inferred scenario of genome rearrangements (supplementary fig. S4, Supplementary Material online). Moreover, they tend to be more prone to gene losses (fig. 2) than other charophycean mtDNAs. Indeed, a distinctive feature of the Entransia and Klebsormidium mtDNAs is the absence of several standard genes in one or both of these genomes. Most of these genes are missing in both Entransia and Klebsormidium, indicating that they were lost from the common ancestor of the two algae. Included in this category are rps8, rps10, rpl2, and rps19, which are found in the cluster of ribosomal protein genes inherited from the prokaryotic progenitor of mitochondria, that is, the stretch delimited by rps10 and rps11 in other charophycean genomes. Because rps10, rpl2, and rps19 are contiguous, they were probably transferred together to the nucleus in the common ancestor of Entransia and Klebsormidium. Mitochondrial gene losses also characterize mitochondrial genome evolution in the hornworts; but in contrast to what we observed in the Klebsormidiales, these events were more frequent and vestiges of many of the transferred genes, that is, pseudogenes, are still detectable in the mitochondria of extant hornworts (Li et al. 2009; Xue et al. 2010).
In sharp contrast to the charophycean lineages discussed above, the two representatives of the Charales display an extremely conservative pattern of mitochondrial genome evolution, sharing exactly the same gene content (fig. 2) and gene order (fig. 5) as well as a high proportion of group II introns (fig. 4). This gene organization includes ancestral gene linkages that have been retained in liverworts and/or mosses but have been disrupted in the Zygnematales and Coleochaetales (e.g., the clusters containing the yej genes, rns and rrn5, and trnR(ucu) and trnY(gua)). The strong conservation of structural features between the Chara and Nitella mtDNAs is correlated with the very high level of similarity found at the sequence level, which is illustrated by the short distance separating Nitella and Chara in mitochondrial trees (figs. 7 and 9). This observation suggests that the mitochondrial genome evolves extremely slowly within the Charales, both at the structural and sequence levels. Obviously, sampling of mtDNAs from earliest diverging lineages will be needed to determine whether Nitella and Chara are representative of all extant members of the Charales. With regard to land plants, mitochondrial genome evolution has been reported to be exceptionally conservative in liverworts and mosses since their origins (Terasawa et al. 2007; Wang et al. 2009; Liu et al. 2011) as well as in the magnoliid Liriodendron tulipifera (Richardson et al. 2013); however, the mitochondrial genomes of later-diverging angiosperms are known to evolve more rapidly. Considering that the differences between the evolutionary pattern of the magnoliid mtDNA and those of other angiosperms are thought to be related to differences in growth and mode of reproduction, it is possible that such factors could explain the seemingly slower pattern observed for the morphologically complex Charales compared with other charophycean lineages.
Our comparative analysis of mitochondrial gene order highlights the less conservative evolutionary trajectory followed by the mitochondrial genome in the major lineage of the Coleochaetales occupied by Chaetosphaeridium. We have inferred that the emergence of the Charales gave rise to a number of gene linkages that have been preserved in the Zygnematales, liverworts, and mosses but not in the representative of the Coleochaetales (fig. 5). Given that the Coleochaetales represent a branch that emerged after the Charales or is sister to the Zygnematales in chloroplast and nuclear phylogenomic trees (Turmel et al. 2006, 2007b; Wodniok et al. 2011; Laurin-Lemay et al. 2012; Timme et al. 2012), extensive genome rearrangements likely led to the disappearance of these derived clusters in Chaetosphaeridium. This is consistent with our MP analysis of gene pairs (fig. 6) and scenario of genome rearrangements (supplementary fig. S4, Supplementary Material online), which reveal that the Chaetosphaeridium mtDNA forms a longer branch than its charalean and zygnematalean homologs. Whether a more conservative evolutionary pattern characterizes the other recognized main lineage known in the Coleochaetales will await sampling of Coleochaete species.
Introns are highly volatile components of the charophycean mitochondrial genome (figs. 3 and 4), making it difficult to trace their origins and use them as phylogenetic indicators. Regarding the group II introns, only six sites of insertion are conserved between two or more charophycean groups (cox2_351, nad3_211, rnL 575, rnL 2078, trnN(guu)_37, and trnS(gcu)_43) (fig. 4), implying that they may have been transmitted by vertical inheritance from a common ancestor. The putatively ancestral intron insertion site in trnS(gcu) has also been identified in liverworts (this gene is missing in other land plant lineages); four separate sites (in cox2, nad3, nad4, and rps3) are shared by the Charales and some land plant lineages (mainly bryophytes); and a single site in cox2 is shared specifically between the Zygnematales and the liverworts. It is intriguing that the Charales have more group II introns in common with land plants than the Zygnematales; this may reflect a higher retention of ancestral characters in land plant mtDNAs compared with the investigated coleochaetalean and zygnematalean genomes. Considering that most of the group II introns found in the Mesostigmatales/Chlorokybales, Klebsormidiales, and Zygnematales are lineage-specific and are not shared by the two members sampled in these individual lineages, we hypothesize that they arose by horizontal transfer or transposition of existing introns, although we cannot exclude the possibility that some are the result of differential losses from a common ancestor. In contrast, the group I introns reveal a broader distribution of insertion sites across charophycean lineages, with sites 909 and 1149 in cox1 being presumably the most ancient (fig. 3). Our data suggest that five of the eight insertion sites found in bryophyte mtDNAs (one in cob, three in cox1, and the nad5 site) trace back to a charophycean ancestor. The site in nad5 is the only one that is shared specifically between a single charophycean lineage (i.e., the Closterium lineage) and land plants. Given the broad distribution of group I introns across charophycean lineages, the total absence of members of this family from the compact mtDNA of Roya makes credible the hypothesis that many events of intron losses took place in the lineage leading to this alga. In this context, it is interesting to note that the chloroplast genome also lost numerous group II introns during the evolution of the Zygnematales (Turmel et al. 2005). Because homologous recombination of intronless cDNA copies generated by reverse transcriptase is thought to lead to intron losses (Dujon 1989), the frequency of homologous recombination events or the level of reverse transcriptase activity might be higher in both the mitochondria and chloroplasts of some zygnematalean green algae.
Our finding of unusual free-standing genes in the genomes newly described here reinforces the notion that horizontal transfer of foreign sequences played a role in shaping the mitochondrial genome during the evolution of charophyceans. We previously reported the presence of an integrase/recombinase gene, presumably of phage origin, in the Chaetosphaeridium mtDNA (Turmel et al. 2002a). This gene is found in the same gene context in the Roya mtDNA, implying that it might have arisen in a common ancestor of the Zygnematales and Coleochaetales. In the Klebsormidium mtDNA, we have uncovered a potential coding sequence related to bacterial or phycodnavirus C-5 cytosine-specific DNA methyltransferase genes, which are often associated with restriction–modification systems. To our knowledge, this is the first DNA methyltransferase gene reported in any organelle genome. As viruses belonging to the Phycodnaviridae infect marine or freshwater green algae (for chloroviruses, it has been shown that the restriction–modification system helps them to degrade host DNA early in infection [Agarkova et al. 2006]), it is possible that the Klebsormidium DNA methyltransferase gene is a vestige of viral infection. Finally, the Entransia and Closterium mtDNA sequences disclosed trnT(ugu), a gene missing in all other streptophyte mtDNAs examined so far and presumably originating from the chloroplasts of red algae or glaucocystophytes.
Conclusions
The structural analyses reported here enhance considerably our understanding of the dynamics of mitochondrial genome evolution within and across streptophyte algal lineages and during the transition from green algae to land plants. Collectively, our analyses of gene order and gene distribution and the phylogenies we inferred from 40 mtDNA-encoded proteins failed to resolve unambiguously the relationships among the Zygnematales, Coleochaetales, and Charales; however, they are consistent with previous phylogenomic studies in favoring that the morphologically complex Charales are not the closest relatives of land plants. Our investigation not only provides another example of how caution must be exercised when large multigene sequence alignments with a limited taxon sampling are analyzed but it also exemplifies the utility of using structural genomic features to validate phylogenetic hypotheses.
Supplementary Material
Supplementary table S1 and figures S1–S6 are available at Genome Biology and Evolution online (http://www.gbe.oxfordjournals.org/).
Acknowledgments
The authors thank Antony Vincent for his help in comparing the amino acid compositions of the concatenated proteins used in our phylogenetic analyses. This work was supported by a Discovery grant from the Natural Sciences and Engineering Research Council of Canada (to C.L. and M.T.).
Literature Cited
- Adams KL, Qiu YL, Stoutemyer M, Palmer JD. Punctuated evolution of mitochondrial gene content: high and variable rates of mitochondrial gene loss and transfer to the nucleus during angiosperm evolution. Proc Natl Acad Sci U S A. 2002;99:9905–9912. doi: 10.1073/pnas.042694899. [DOI] [PMC free article] [PubMed] [Google Scholar]
- Agarkova IV, Dunigan DD, Van Etten JL. Virion-associated restriction endonucleases of chloroviruses. J Virol. 2006;80:8114–8123. doi: 10.1128/JVI.00486-06. [DOI] [PMC free article] [PubMed] [Google Scholar]
- Andersen RA. Algal culturing techniques. Boston (MA): Elsevier/Academic Press; 2005. [Google Scholar]
- Bremer K, Humphries CJ, Mishler BD, Churchill SP. On cladistic relationships in green plants. Taxon. 1987;36:339–349. [Google Scholar]
- Burger G, Gray MW, Forget L, Lang BF. Strikingly bacteria-like and gene-rich mitochondrial genomes throughout jakobid protists. Genome Biol Evol. 2013;5:418–438. doi: 10.1093/gbe/evt008. [DOI] [PMC free article] [PubMed] [Google Scholar]
- Capella-Gutierrez S, Silla-Martinez JM, Gabaldon T. trimAl: a tool for automated alignment trimming in large-scale phylogenetic analyses. Bioinformatics. 2009;25:1972–1973. doi: 10.1093/bioinformatics/btp348. [DOI] [PMC free article] [PubMed] [Google Scholar]
- Caprara A. The reversal median problem. INFORMS J Comput. 2003;15:93–113. [Google Scholar]
- Chang SX, et al. Mitochondrial genome sequencing helps show the evolutionary mechanism of mitochondrial genome formation in Brassica. BMC Genomics. 2011;12:497. doi: 10.1186/1471-2164-12-497. [DOI] [PMC free article] [PubMed] [Google Scholar]
- Darracq A, Varre JS, Touzet P. A scenario of mitochondrial genome evolution in maize based on rearrangement events. BMC Genomics. 2010;11:233. doi: 10.1186/1471-2164-11-233. [DOI] [PMC free article] [PubMed] [Google Scholar]
- Delsuc F, Brinkmann H, Philippe H. Phylogenomics and the reconstruction of the tree of life. Nat Rev Genet. 2005;6:361–375. doi: 10.1038/nrg1603. [DOI] [PubMed] [Google Scholar]
- Dujon B. Group-I introns as mobile genetic elements: facts and mechanistic speculations—a review. Gene. 1989;82:91–114. doi: 10.1016/0378-1119(89)90034-6. [DOI] [PubMed] [Google Scholar]
- Edgar RC. MUSCLE: multiple sequence alignment with high accuracy and high throughput. Nucleic Acids Res. 2004;32:1792–1797. doi: 10.1093/nar/gkh340. [DOI] [PMC free article] [PubMed] [Google Scholar]
- Felsenstein J. Cases in which parsimony or compatibility methods will be positively misleading. Syst Zool. 1978;27:401–410. [Google Scholar]
- Felsenstein J. PHYLIP—phylogeny inference package (version 3.2) Cladistics. 1989;5:164–166. [Google Scholar]
- Fourment M, Gibbs MJ. PATRISTIC: a program for calculating patristic distances and graphically comparing the components of genetic change. BMC Evol Biol. 2006;6:1. doi: 10.1186/1471-2148-6-1. [DOI] [PMC free article] [PubMed] [Google Scholar]
- Gensel PG. The earliest land plants. Annu Rev Ecol Evol Syst. 2008;39:459–477. [Google Scholar]
- Gerrath JF. Conjugating green algae and desmids. In: Wehr JD, Sheath RG, editors. Freshwater algae of North America: ecology and classification. San Diego (CA): Academic Press; 2003. pp. 353–381. [Google Scholar]
- Gontcharov AA, Marin B, Melkonian M. Are combined analyses better than single gene phylogenies? A case study using SSU rDNA and rbcL sequence comparisons in the Zygnematophyceae (Streptophyta) Mol Biol Evol. 2004;21:612–624. doi: 10.1093/molbev/msh052. [DOI] [PubMed] [Google Scholar]
- Gowri-Shankar V, Rattray M. On the correlation between composition and site-specific evolutionary rate: implications for phylogenetic inference. Mol Biol Evol. 2006;23:352–364. doi: 10.1093/molbev/msj040. [DOI] [PubMed] [Google Scholar]
- Hall JD, Karol KG, McCourt RM, Delwiche CF. Phylogeny of the conjugating green algae based on chloroplast and mitochondrial nucleotide sequence data. J Phycol. 2008;44:467–477. doi: 10.1111/j.1529-8817.2008.00485.x. [DOI] [PubMed] [Google Scholar]
- Jeffroy O, Brinkmann H, Delsuc F, Philippe H. Phylogenomics: the beginning of incongruence? Trends Genet. 2006;22:225–231. doi: 10.1016/j.tig.2006.02.003. [DOI] [PubMed] [Google Scholar]
- Karol KG, McCourt RM, Cimino MT, Delwiche CF. The closest living relatives of land plants. Science. 2001;294:2351–2353. doi: 10.1126/science.1065156. [DOI] [PubMed] [Google Scholar]
- Kenrick P, Wellman CH, Schneider H, Edgecombe GD. A timeline for terrestrialization: consequences for the carbon cycle in the Palaeozoic. Philos Trans R Soc Lond B Biol Sci. 2012;367:519–536. doi: 10.1098/rstb.2011.0271. [DOI] [PMC free article] [PubMed] [Google Scholar]
- Knoop V. Plant mitochondrial genome peculiarities evolving in the earliest vascular plant lineages. J Syst Evol. 2013;51:1–12. [Google Scholar]
- Kurtz S, et al. REPuter: the manifold applications of repeat analysis on a genomic scale. Nucleic Acids Res. 2001;29:4633–4642. doi: 10.1093/nar/29.22.4633. [DOI] [PMC free article] [PubMed] [Google Scholar]
- Lartillot N, Lepage T, Blanquart S. PhyloBayes 3: a Bayesian software package for phylogenetic reconstruction and molecular dating. Bioinformatics. 2009;25:2286–2288. doi: 10.1093/bioinformatics/btp368. [DOI] [PubMed] [Google Scholar]
- Lartillot N, Philippe H. A Bayesian mixture model for across-site heterogeneities in the amino-acid replacement process. Mol Biol Evol. 2004;21:1095–1109. doi: 10.1093/molbev/msh112. [DOI] [PubMed] [Google Scholar]
- Laurin-Lemay S, Brinkmann H, Philippe H. Origin of land plants revisited in the light of sequence contamination and missing data. Curr Biol. 2012;22:R593–R594. doi: 10.1016/j.cub.2012.06.013. [DOI] [PubMed] [Google Scholar]
- Lewis LA, McCourt RM. Green algae and the origin of land plants. Am J Bot. 2004;91:1535–1556. doi: 10.3732/ajb.91.10.1535. [DOI] [PubMed] [Google Scholar]
- Li LB, Wang B, Liu Y, Qiu YL. The complete mitochondrial genome sequence of the hornwort Megaceros aenigmaticus shows a mixed mode of conservative yet dynamic evolution in early land plant mitochondrial genomes. J Mol Evol. 2009;68:665–678. doi: 10.1007/s00239-009-9240-7. [DOI] [PubMed] [Google Scholar]
- Liu Y, Xue JY, Wang B, Li LB, Qiu YL. The mitochondrial genomes of the early land plants Treubia lacunosa and Anomodon rugelii: dynamic and conservative evolution. PLoS One. 2011;6:e25836. doi: 10.1371/journal.pone.0025836. [DOI] [PMC free article] [PubMed] [Google Scholar]
- Lockhart PJ, Steel MA, Hendy MD, Penny D. Recovering evolutionary trees under a more realistic model of sequence evolution. Mol Biol Evol. 1994;11:605–612. doi: 10.1093/oxfordjournals.molbev.a040136. [DOI] [PubMed] [Google Scholar]
- Lowe TM, Eddy SR. tRNAscan-SE: a program for improved detection of transfer RNA genes in genomic sequence. Nucleic Acids Res. 1997;25:955–964. doi: 10.1093/nar/25.5.955. [DOI] [PMC free article] [PubMed] [Google Scholar]
- Maddison DR, Maddison WP. MacClade 4: analysis of phylogeny and character evolution. Sunderland (MA): Sinauer Associates; 2000. [DOI] [PubMed] [Google Scholar]
- Maddison WP, Maddison DR. Mesquite: a modular system for evolutionary analysis. 2011 Version 2.75. [cited 2013 Sep 27]. Available from: http://mesquiteproject.org. [Google Scholar]
- Margulies M, et al. Genome sequencing in microfabricated high-density picolitre reactors. Nature. 2005;437:376–380. doi: 10.1038/nature03959. [DOI] [PMC free article] [PubMed] [Google Scholar]
- McCourt RM, Delwiche CF, Karol KG. Charophyte algae and land plant origins. Trends Ecol Evol. 2004;19:661–666. doi: 10.1016/j.tree.2004.09.013. [DOI] [PubMed] [Google Scholar]
- McCourt RM, et al. Phylogeny of the conjugating green algae (Zygnemophyceae) based on rbcL sequences. J Phycol. 2000;36:747–758. doi: 10.1046/j.1529-8817.2000.99106.x. [DOI] [PubMed] [Google Scholar]
- Michel F, Umesono K, Ozeki H. Comparative and functional anatomy of group II catalytic introns—a review. Gene. 1989;82:5–30. doi: 10.1016/0378-1119(89)90026-7. [DOI] [PubMed] [Google Scholar]
- Michel F, Westhof E. Modelling of the three-dimensional architecture of group I catalytic introns based on comparative sequence analysis. J Mol Biol. 1990;216:585–610. doi: 10.1016/0022-2836(90)90386-Z. [DOI] [PubMed] [Google Scholar]
- Mikhailyuk TI, et al. New streptophyte green algae from terrestrial habitats and an assessment of the genus Interfilum (Klebsormidiophyceae, Streptophyta) J Phycol. 2008;44:1586–1603. doi: 10.1111/j.1529-8817.2008.00606.x. [DOI] [PubMed] [Google Scholar]
- Moret BME, Siepel AC, Tang J, Liu T. Proceedings of the Second International Workshop on Algorithms in Bioinformatics; 2002 September 17–21. Vol. 2452. Rome, Italy: Springer; 2002. Inversion medians outperform breakpoint medians in phylogeny reconstruction from gene-order data; pp. 521–536. [Google Scholar]
- Nenadic O, Greenacre M. Correspondence analysis in R, with two- and three-dimensional graphics: the ca package. J Stat Software. 2007;20:1–13. [Google Scholar]
- Oda K, et al. Transfer-RNA genes in the mitochondrial genome from a liverwort, Marchantia Polymorpha—the absence of chloroplast-like transfer-RNAs. Nucleic Acids Res. 1992;20:3773–3777. doi: 10.1093/nar/20.14.3773. [DOI] [PMC free article] [PubMed] [Google Scholar]
- Philippe H, et al. Acoelomorph flatworms are deuterostomes related to Xenoturbella. Nature. 2011a;470:255–260. doi: 10.1038/nature09676. [DOI] [PMC free article] [PubMed] [Google Scholar]
- Philippe H, et al. Resolving difficult phylogenetic questions: why more sequences are not enough. PLoS Biol. 2011b;9:e1000602. doi: 10.1371/journal.pbio.1000602. [DOI] [PMC free article] [PubMed] [Google Scholar]
- Phillips MJ, Delsuc F, Penny D. Genome-scale phylogeny and the detection of systematic biases. Mol Biol Evol. 2004;21:1455–1458. doi: 10.1093/molbev/msh137. [DOI] [PubMed] [Google Scholar]
- Pombert JF, Otis C, Lemieux C, Turmel M. Chloroplast genome sequence of the green alga Pseudendoclonium akinetum (Ulvophyceae) reveals unusual structural features and new insights into the branching order of chlorophyte lineages. Mol Biol Evol. 2005;22:1903–1918. doi: 10.1093/molbev/msi182. [DOI] [PubMed] [Google Scholar]
- Qiu YL, et al. The deepest divergences in land plants inferred from phylogenomic evidence. Proc Natl Acad Sci U S A. 2006;103:15511–15516. doi: 10.1073/pnas.0603335103. [DOI] [PMC free article] [PubMed] [Google Scholar]
- Rice P, Longden I, Bleasby A. EMBOSS: the European molecular biology open software suite. Trends Genet. 2000;16:276–277. doi: 10.1016/s0168-9525(00)02024-2. [DOI] [PubMed] [Google Scholar]
- Richardson AO, Rice DW, Young GJ, Alverson AJ, Palmer JD. The “fossilized” mitochondrial genome of Liriodendron tulipifera: ancestral gene content and order, ancestral editing sites, and extraordinarily low mutation rate. BMC Biol. 2013;11:29. doi: 10.1186/1741-7007-11-29. [DOI] [PMC free article] [PubMed] [Google Scholar]
- Rodriguez-Ezpeleta N, et al. Detecting and overcoming systematic errors in genome-scale phylogenies. Syst Biol. 2007;56:389–399. doi: 10.1080/10635150701397643. [DOI] [PubMed] [Google Scholar]
- Stamatakis A. RAxML-VI-HPC: maximum likelihood-based phylogenetic analyses with thousands of taxa and mixed models. Bioinformatics. 2006;22:2688–2690. doi: 10.1093/bioinformatics/btl446. [DOI] [PubMed] [Google Scholar]
- Swofford DL. PAUP*: phylogenetic analysis using parsimony (*and other methods) 2003. Version 4. Sunderland (MA): Sinauer Associates. [Google Scholar]
- Tamura K, et al. MEGA5: molecular evolutionary genetics analysis using maximum likelihood, evolutionary distance, and maximum parsimony methods. Mol Biol Evol. 2011;28:2731–2739. doi: 10.1093/molbev/msr121. [DOI] [PMC free article] [PubMed] [Google Scholar]
- Terasawa K, et al. The mitochondrial genome of the moss Physcomitrella patens sheds new light on mitochondrial evolution in land plants. Mol Biol Evol. 2007;24:699–709. doi: 10.1093/molbev/msl198. [DOI] [PubMed] [Google Scholar]
- Timme RE, Bachvaroff TR, Delwiche CF. Broad phylogenomic sampling and the sister lineage of land plants. PLoS One. 2012;7:e29696. doi: 10.1371/journal.pone.0029696. [DOI] [PMC free article] [PubMed] [Google Scholar]
- Turmel M, Ehara M, Otis C, Lemieux C. Phylogenetic relationships among streptophytes as inferred from chloroplast small and large subunit rRNA gene sequences. J Phycol. 2002;38:364–375. [Google Scholar]
- Turmel M, Otis C, Lemieux C. The chloroplast and mitochondrial genome sequences of the charophyte Chaetosphaeridium globosum: insights into the timing of the events that restructured organelle DNAs within the green algal lineage that led to land plants. Proc Natl Acad Sci U S A. 2002a;99:11275–11280. doi: 10.1073/pnas.162203299. [DOI] [PMC free article] [PubMed] [Google Scholar]
- Turmel M, Otis C, Lemieux C. The complete mitochondrial DNA sequence of Mesostigma viride identifies this green alga as the earliest green plant divergence and predicts a highly compact mitochondrial genome in the ancestor of all green plants. Mol Biol Evol. 2002b;19:24–38. doi: 10.1093/oxfordjournals.molbev.a003979. [DOI] [PubMed] [Google Scholar]
- Turmel M, Otis C, Lemieux C. The mitochondrial genome of Chara vulgaris: insights into the mitochondrial DNA architecture of the last common ancestor of green algae and land plants. Plant Cell. 2003;15:1888–1903. doi: 10.1105/tpc.013169. [DOI] [PMC free article] [PubMed] [Google Scholar]
- Turmel M, Otis C, Lemieux C. The complete chloroplast DNA sequences of the charophycean green algae Staurastrum and Zygnema reveal that the chloroplast genome underwent extensive changes during the evolution of the Zygnematales. BMC Biol. 2005;3:22. doi: 10.1186/1741-7007-3-22. [DOI] [PMC free article] [PubMed] [Google Scholar]
- Turmel M, Otis C, Lemieux C. The chloroplast genome sequence of Chara vulgaris sheds new light into the closest green algal relatives of land plants. Mol Biol Evol. 2006;23:1324–1338. doi: 10.1093/molbev/msk018. [DOI] [PubMed] [Google Scholar]
- Turmel M, Otis C, Lemieux C. An unexpectedly large and loosely packed mitochondrial genome in the charophycean green alga Chlorokybus atmophyticus. BMC Genomics. 2007a;8:137. doi: 10.1186/1471-2164-8-137. [DOI] [PMC free article] [PubMed] [Google Scholar]
- Turmel M, Pombert JF, Charlebois P, Otis C, Lemieux C. The green algal ancestry of land plants as revealed by the chloroplast genome. Int J Plant Sci. 2007b;168:679–689. [Google Scholar]
- Turmel M, et al. The complete mitochondrial DNA sequences of Nephroselmis olivacea and Pedinomonas minor. Two radically different evolutionary patterns within green algae. Plant Cell. 1999;11:1717–1730. doi: 10.1105/tpc.11.9.1717. [DOI] [PMC free article] [PubMed] [Google Scholar]
- Villarreal JC, Goffinet B, Duff RJ, Cargill DC. Phylogenetic delineation of Nothoceros and Megaceros (Dendrocerotaceae) Bryologist. 2010;113:106–113. [Google Scholar]
- Wang B, Xue JY, Li LB, Liu Y, Qiu YL. The complete mitochondrial genome sequence of the liverwort Pleurozia purpurea reveals extremely conservative mitochondrial genome evolution in liverworts. Curr Genet. 2009;55:601–609. doi: 10.1007/s00294-009-0273-7. [DOI] [PubMed] [Google Scholar]
- Wodniok S, et al. Origin of land plants: do conjugating green algae hold the key? BMC Evol Biol. 2011;11:104. doi: 10.1186/1471-2148-11-104. [DOI] [PMC free article] [PubMed] [Google Scholar]
- Xue JY, Liu Y, Li LB, Wang B, Qiu YL. The complete mitochondrial genome sequence of the hornwort Phaeoceros laevis: retention of many ancient pseudogenes and conservative evolution of mitochondrial genomes in hornworts. Curr Genet. 2010;56:53–61. doi: 10.1007/s00294-009-0279-1. [DOI] [PubMed] [Google Scholar]
- Yang Z. PAML 4: phylogenetic analysis by maximum likelihood. Mol Biol Evol. 2007;24:1586–1591. doi: 10.1093/molbev/msm088. [DOI] [PubMed] [Google Scholar]
Associated Data
This section collects any data citations, data availability statements, or supplementary materials included in this article.