

Abstract
Mammalian sex chromosomes arose from a pair of homologous autosomes that differentiated into the X and Y chromosomes following a series of recombination suppression events between the X and Y. The stepwise recombination suppressions from the distal long arm to the distal short arm of the chromosomes are reflected as regions with distinct X-Y divergence, referred to as evolutionary strata on the X. All current methods for stratum detection depend on X-Y comparisons but are severely limited by the paucity of X-Y gametologs. We have developed an integrative method that combines a top-down, recursive segmentation algorithm with a bottom-up, agglomerative clustering algorithm to decipher compositionally distinct regions on the X, which reflect regions of unique X-Y divergence. In application to human X chromosome, our method correctly classified a concatenated set of 35 previously assayed X-linked gene sequences by evolutionary strata. We then extended our analysis, applying this method to the entire sequence of the human X chromosome, in an effort to define stratum boundaries. The boundaries of more recently formed strata on X-added region, namely the fourth and fifth strata, have been defined by previous studies and are recapitulated with our method. The older strata, from the first up to the third stratum, have remained poorly resolved due to paucity of X-Y gametologs. By analyzing the entire X sequence, our method identified seven evolutionary strata in these ancient regions, where only three could previously be assayed, thus demonstrating the robustness of our method in detecting the evolutionary strata.
Keywords: evolutionary strata, human sex chromosomes, recombination suppressions, chromosomal inversions, genome segmentation
The human sex chromosomes, X and Y, evolved from a pair of homologous autosomes. Today, however, the Y is small and gene poor (Skaletsky et al. 2003), whereas the X is relatively large, with more than 1,100 genes (Ross et al. 2005). Ancestrally the sex chromosomes could recombine over their entire lengths, but following a series of recombination suppression events, including inversions on the Y chromosome (Lahn and Page 1999; Ross et al. 2005; Lemaitre et al. 2009a), the human X and Y now only recombine in the small pseudoautosomal regions (PARs), found at both ends of the X and Y (Ross et al. 2005). These recombination suppression events occurred serially, reflected in similar rates of X-Y divergence within, but different between, contiguous regions along the whole X chromosome, resulting in distinct “evolutionary strata” on the human X (Lahn and Page 1999). Evolutionary strata have been described in organisms as diverse as human (Lahn and Page 1999; Iwase et al. 2003; Skaletsky et al. 2003; Ross et al. 2005; Lemaitre et al. 2009a; Wilson and Makova 2009), mouse (Sandstedt and Tucker 2004), chicken (Nam and Ellegren 2008), and the dioecious plant, Silene latifolia (Bergero et al. 2007). The eutherian (mammals excluding marsupials and monotremes) X chromosome is composed of an ancestral X-conserved region (XCR) that is shared with marsupials, like the opossum, but not with monotremes (Veyrunes et al. 2008), and a more recently transposed X-added region (XAR) that is sex-specific in eutherians, but autosomal in marsupials (Wilcox et al. 1996; Ross et al. 2005). Genes within each stratum ceased to undergo homologous X-Y recombination around the same evolutionary time, and thus share a unique evolutionary history that is distinct from other strata. Some strata are shared across eutherian mammals, whereas others are lineage-specific (Lahn and Page 1999; Iwase et al. 2003; Skaletsky et al. 2003; Ross et al. 2005; Lemaitre et al. 2009a; Wilson and Makova 2009; Katsura and Satta 2012).
One efficient mechanism for strata formation is an inversion on the Y chromosome (Charlesworth 1978; Kirkpatrick and Barton 2006), which suppresses X-Y recombination in males in the region of the inversion (Lahn and Page 1999; Ross et al. 2005; Lemaitre et al. 2009a). Following each inversion, the nonrecombining regions on the X and Y chromosomes evolve and diverge from one another independently. Additionally, in the absence of recombination in males, the nonrecombining regions accumulate DNA elements, such as transposable or repetitive elements, and sequences with shifts in GC content (Ross et al. 2005). Further, on the X chromosome, motifs/oligomers related to X-chromosome inactivation may also accumulate in response to loss of functional genes on the Y (Carrel et al. 2006; Wilson Sayres and Makova 2013), and thus the sequence composition of each strata on the X diverges from neighboring regions that still undergo X-Y recombination.
All current methods for evolutionary strata detection are constrained by the requirement of X-linked gametologous sequences on the Y and by the paucity of Y-specific sequences. Synonymous substitution rates have been frequently used to estimate divergence between X-linked and Y-linked sequences (Lahn and Page 1999; Skaletsky et al. 2003; Wilson Sayres and Makova 2013); however, such studies may be biased due to the saturation of synonymous substitutions, gene conversion, or gene-specific conservation on the X and Y. Inversion analyses have been used to identify the younger strata (Ross et al. 2005; Lemaitre et al. 2009a) but lose power to detect older strata boundaries due to a saturation of Y inversions. Phylogenetic methods use comparative genomics to estimate recombination suppression (Wilson and Makova 2009; Katsura and Satta 2012) but are limited in their resolution by the number of species with available sequence. Thus, a comprehensive approach to identifying the evolutionary strata has not yet been realized due to the limitations imposed on all current methods of comparing the homologous X-Y sequences because so few Y sequences remain following the loss or degradation of nonrecombining ancestral Y sequences.
To circumvent the limitations of the current approaches to strata detection and to delineate the strata boundaries, we have developed a multipronged strategy that applies a recursive segmentation and an agglomerative clustering algorithm within the framework of statistical hypothesis testing to identify compositionally distinct regions on the X chromosome. We first tested the proposed method on the concatenated gene sequences of all 35 previously assayed human X-linked genes. Our method correctly classifies this set of genes and provides an alternative line of evidence supporting recent suggestions that the third stratum is actually composed of two distinct strata (Lemaitre et al. 2009a; Wilson and Makova 2009). Second, by applying our method to the entire X chromosome, we identified the stratum boundaries and a total of nine evolutionary strata on the human X, notably, identifying at least five ancient strata. We also found evidence of a recombination suppression event that spans the XCR/XAR boundary. In the youngest strata, where all methods are expected to perform equally well, our predictions reconciled well with predictions from existing methods that require Y homology, demonstrating that our method can be reliably used to identify evolutionary strata in the absence of sequence information from the heterogametic sex chromosome.
Segmentation and Clustering Algorithm
Each stratum evolves independently following recombination suppression, with the oldest stratum at the extremity of the long arm of X being most diverged, the newest stratum near the tip of the short arm of X being least diverged, and with the divergence decreasing with distance from the distal long arm of the X. We posit that this differential divergence on the X will be reflected in the oligonucleotide compositional divergence between the strata along the X chromosome. As such, we developed a multipronged algorithmic approach to first segment the X chromosome into regions of distinct oligonucleotide composition and then segregate compositionally similar regions in distinct clusters using an agglomerative clustering algorithm. Here, we globalized a Markovian segmentation approach used in a previous ad hoc application to detect strata boundaries (Kelkar et al. 2009) by making the recursive segmentation step-free and incorporating a posterior two-step clustering procedure, and thus introducing, for the first time, an unrestricted integrative algorithm to decipher segmental structures within long eukaryotic genomes. This algorithm first identifies compositionally distinct segments and then clusters segments that are compositionally similar, without any prior knowledge of the composition of the sequence being analyzed. In contrast to moving window or gene-based methods, which are constrained to define strata boundaries on the basis of window or gene boundaries, this approach can localize the boundaries at any genomic region. Further, the segmentation and clustering algorithm’s parameter choices, including the significance thresholds, are preset at the outset, and therefore the proposed procedure is free from the biases due to “artificial” human interventions, such as halting the algorithm at will to secure selected stratum boundaries as was done previously (Kelkar et al. 2009). Our method detects the previously described strata without generating a plethora of segments of unknown significance, as is the case with a previous segmentation-only method (Kelkar et al. 2009) (supplementary fig. S1, Supplementary Material online). Our proposed approach thus provides an unbiased means to detect the presence of evolutionary strata, and their boundaries, within the framework of statistical hypothesis testing and without gametologous Y sequences.
Comparison with Previous Analyses and Validation of Proposed Method
We first applied our segmentation and clustering algorithm to the concatenated sequence of the 35 X-linked genes that have been previously assayed using inversion (Ross et al. 2005; Lemaitre et al. 2009a), phylogenetic (Wilson and Makova 2009; Luo and Wilson Sayres, unpublished data), and substitution rate (Lahn and Page 1999; Skaletsky et al. 2003) analyses. Protein-coding gene sequences are constrained in their sequence evolution to maintain functional gene products and so will accumulate nucleotide differences (substitutions, deletions, and insertions) slower than noncoding DNAs. As such, an analysis of the coding regions should be a proxy for the divergence rate between gametologous X-Y sequences but is likely a conservative estimate of the sequence differences that have accumulated between the larger X and Y regions due to suppression of recombination between them. Similar to the expectations, when analyzing just the coding regions, the segmentation and clustering algorithm produces a conservative strata structure (fig. 1 and supplementaryfig. S2, Supplementary Material online). Our method correctly classifies genes by previously defined stratum boundaries, and consistent with recent suggestions (Lemaitre et al. 2009a; Wilson and Makova 2009), we find evidence of two strata within the previously described stratum 3 (fig. 1 and table 1). This analysis confirms that our method is able to recapitulate previous stratum definitions but also highlights the challenges of relying only on X-linked coding sequences, which are necessarily more conserved than noncoding regions, with identifiable Y-linked gametologs.
Fig. 1.—
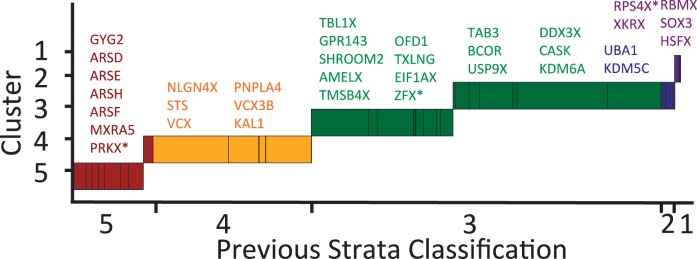
Strata identified using previously assayed X-linked genes. Here we apply the segmentation and clustering algorithm to a concatenated string of the X-linked genes that have been previously assayed using inversion, phylogenetic, and substitution rate analyses. Previous strata are colored: 5, Red; 4, Yellow; 3, Geen; 2, Blue; 1, Violet. Genes in each cluster are labeled above the cluster, similarly color-coded. Genes that span cluster boundaries are marked with a star. We used Markov model of order 2 to perform segmentation and clustering at significance thresholds of 0.3 and 0.04, respectively.
Table 1.
Summary of Clusters Identified from the Segmentation and Clustering Algorithm and Comparison with Previous Definitions of Strata
| Cluster (Mb) | Gene | Position (Mb) | Alternative Assessments of Strata |
|||||||
|---|---|---|---|---|---|---|---|---|---|---|
| Substitutions |
Inversions |
Phylogenetic |
||||||||
| [1] | [2] | [3] | [4] | [5] | Katsura and Satta (2012) | Luo and Wilson Sayres (unpublished data) | ||||
| 0–0.73 | 12 | – | – | – | – | – | – | – | – | – |
| 0.73–1.40 | 11 | – | – | – | – | – | – | – | – | – |
| 1.40–1.78 | 10 | – | – | – | – | – | – | – | – | – |
| 1.78–5.04 | 9 | XG | 2.67 | PAR | PAR | PAR | PAR | PAR | PAR | PAR |
| GYG2 | 2.75 | 4 | 4 | 5 | 5 | – | – | – | ||
| ARSD | 2.83 | 4 | 4 | 5 | 5 | – | – | – | ||
| ARSE | 2.85 | 4 | 4 | 5 | 5 | – | – | – | ||
| ARSH | 2.92 | – | 4 | – | – | – | – | – | ||
| ARSF | 2.99 | – | 4 | 5 | 5 | – | – | – | ||
| MXRA5 | 3.23 | – | 4 | 5 | – | – | – | |||
| PRKX | 3.53 | 4 | 4 | 5 | 5 | 5 | – | 5 | ||
| 5.04–8.43 | 8 | NLGN4X | 5.81 | – | 4 | 4 | 4 | – | – | 4 |
| VCX3B | 6.45 | – | 4 | 4 | – | – | – | – | ||
| STS | 7.14 | 4 | 4 | 4 | 4 | – | – | – | ||
| VCX | 7.81 | – | 4 | 4 | 4 | – | – | – | ||
| PNPLA4 | 7.87 | – | 4 | – | – | – | – | – | ||
| *KAL1 | 8.50 | 4 | 4 | 4 | 4 | – | – | 4 | ||
| 8.43–30.62 | 7 | TBL1X | 9.62 | – | 3/4 | 3 | 3/4 | 4 | – | 3 |
| GPR143 | 9.69 | – | 3/4 | – | – | – | – | – | ||
| SHROOM2 | 9.75 | – | 3/4 | – | 3/4 | – | – | – | ||
| AMELX | 11.31 | 4 | 3/4 | 3 | 3 | 4 | – | 3 | ||
| TMSB4X | 12.99 | 3 | 3/4 | – | 3 | 4 | – | 3 | ||
| OFD1 | 13.75 | – | 3 | – | – | – | – | – | ||
| TXNLG | 16.71 | – | 3 | – | 3 | 3/4 | – | 2 | ||
| EIF1AX | 20.15 | 3 | 3 | – | 3 | 3/4 | – | 2 | ||
| ZFX | 24.19 | 3 | 3 | – | 3 | 3/4 | – | 2 | ||
| *TAB3 | 30.85 | – | – | – | 3 | – | – | – | ||
| 30.62–55.78 | 6 | BCOR | 39.91 | – | 3 | – | 3 | – | – | – |
| USP9X | 40.98 | 3 | 3 | – | – | 3 | – | 2 | ||
| DDX3X | 41.19 | 3 | 3 | – | – | 3 | – | 2 | ||
| CASK | 41.38 | 3 | 3 | – | 3 | – | – | 2 | ||
| KDM6A | 44.73 | 3 | 3 | – | 3 | 3 | – | 2 | ||
| UBE1X | 47.06 | 2 | 2 | – | – | – | 1 | 2 | ||
| KDM5C | 53.22 | 2 | 2 | – | – | – | 1 | 2 | ||
| 55.78–75.53 | 5 | RPS4X | 71.49 | 1 | 1 | – | – | – | 1 | 1 |
| 75.53–99.98 | 4 | |||||||||
| 99.98–130.82 | 3 | XKRX | 100.17 | – | – | – | – | – | 1 | 1 |
| 130.82–145.73 | 2 | RBMX | 135.96 | 1 | 1 | – | – | – | 1 | 1 |
| SOX3 | 139.59 | 1 | 1 | – | – | – | 1 | 1 | ||
| 145.73–155.72 | 1 | HSFX | 148.67 | – | – | – | – | – | 1 | 1 |
| SPRY3 | 154.99 | PAR | PAR | PAR | PAR | PAR | PAR | PAR | ||
Note.—Here we show how clusters identified by our segmentation and clustering algorithm compare with previous efforts to identify evolutionary strata on the human X chromosome.
Predicting Strata in the Absence of Y Sequence Information
Because protein-coding sequences are constrained in their evolution and noncoding sequences may accumulate nucleotide heterogeneity faster, we next applied the segmentation and clustering algorithm to the entire DNA sequence of the human X chromosome. This approach takes advantage of the logic that, in the absence of recombination in males, DNA sequence on the human X chromosome is more likely to accumulate and retain DNA changes (substitutions, insertions, and deletions) than regions that undergo homologous recombination in both males and females. The longer the region has been evolving without recombination in males, the more changes it is likely to have accumulated. Further, in mammals, the drive toward dosage compensation, in response to gene loss on the Y (Wilson Sayres and Makova 2013), may result in the accumulation of specific sequences related to gene silencing or activation on the X (Carrel et al. 2006). Thus, we expect the oligonucleotide composition to be similar within strata on the X chromosome but differ between the strata; our segmentation and clustering algorithm identifies such differences.
We make significant improvements to predicting strata by allowing all of the sequence on the X chromosome to be utilized, instead of relying only on genic regions, and also by not limiting to regions that retain Y homology. Our algorithm identifies 12 compositionally distinct regions on the human X chromosome. Three of these occur within the first PAR (PAR1). Given the strong evidence that the PAR1 is still recombining, we do not take this as evidence of recombination suppression. These three clusters also appear to be driven by repetitive elements because when repetitive elements are masked out we observe only two clusters on the human X chromosome, one corresponding to the PAR1 and the other corresponding to the rest of the X chromosome (which is almost entirely nonrecombining in males). Outside of the PAR, our method identifies nine clusters, which we expect to correspond to distinct evolutionary strata. First, our method identifies the previously defined boundaries of the human PAR1 and the two most recent strata (fig. 2, table 1, and supplementary fig. S3, Supplementary Material online), which have been described in detail and independently confirmed by different studies (Ross et al. 2005; Lemaitre et al. 2009b). We confirm, as others have hypothesized (Lemaitre et al. 2009a; Wilson and Makova 2009), that the stratum previously described as stratum 3 is actually comprised of at least two compositionally distinct regions (fig. 2 and table 1). Finally, for the first time, we provide estimates of the positions and boundaries of strata in the oldest region of the sex chromosomes (table 1). Specifically, in humans, we show that rather than only one or two strata on the XCR (Lahn and Page 1999; Skaletsky et al. 2003; Katsura and Satta 2012), there were at least five independent recombination suppression events in the XCR (fig. 2 and table 1). Given that species with very young sex chromosomes already have several observable strata (e.g., three strata have already been identified on the <10-million-year-old sex chromosomes of Silene latifolia [Bergero et al. 2007]), the existence of many strata in the XCR is much more consistent with current theory of sex chromosome evolution than the likelihood of one or two extremely large inversions. Our method makes no assumption about the timing of any of the events, although other lines of evidence do suggest successive linear recombination suppressions. Specifically, we do not distinguish where the first recombination suppression event occurred. Current theory suggests that SOX3, from which the sex-determining SRY gene evolved, is in the oldest stratum. We do not contest this; however, the new evidence from this study suggests that the earliest two inversions might have happened in quick succession, the inversion involving SOX3 (represented by the second cluster, fig. 2) happening first, then recombination suppression proceeded in both directions along the chromosome, reaching the terminal end of Xq very quickly. Interestingly, the first cluster (∼10 Mbp in size, fig. 2) contains PAR2, which is only 320 kb long, was recently added to the X and Y, and reported to only occasionally undergo recombination, in contrast to PAR1 (Charchar et al. 2003).
Fig. 2.—

Strata identified across the whole X chromosome. Here, we show the clusters that are determined using the entire sequence of the human X chromosome, either unmasked or masked for repetitive elements, as defined by RepeatMasker. We also plot the position and strata delineation of X-linked genes that have previously been assayed. Previous strata are colored: 5, Red; 4, Yellow; 3, Geen; 2, Blue; 1, Violet. We used Markov model of order 2 to perform segmentation and clustering at significance thresholds of 0.4 and 10−7, respectively.
The XAR was added to the eutherian X chromosome approximately 105 Ma, prior to the radiation of eutherian mammals, and is nearly one-third of the human X chromosome (from 0 to 46.88 Mb [Ross et al. 2005]). We find one cluster spanning the region between the ancestral XCR and the younger XAR (fig. 2 and table 1). This is consistent with the hypothesis that the autosomal segment translocated to the ancestral X chromosome was added to an ancient PAR that was still undergoing X-Y recombination in the common ancestor of eutherian mammals. Then, after the addition of the XAR, an event occurred to suppress recombination in a region spanning the ancestral PAR and a portion of the XAR.
We also found that much of the compositional heterogeneity between strata on the human X chromosome can be explained by the presence of repetitive elements, because our method, when applied to the entire X chromosome with repetitive elements masked out, does not return the underlying strata structure (fig. 2). Ross et al. (2005) found that LINEs increase in frequency with increasing stratum age (at least when considering the most recent three strata) but did not observe a monotonic pattern with respect to GC content. Similarly, we do not observe a striking pattern with respect to GC content (supplementary table S1, Supplementary Material online). Further, we also observe a monotonically increasing trend in the density of repetitive elements in the strata with distance from Xpter across the entire XAR (fig. 3A). In this younger region, the stratum structure deciphered by our proposed method reinforces the earlier observation of increase in repetitive element densities after the suppression of X-Y recombination. This may also have contributed to the heterogeneity between strata. In addition, we observe that this pattern breaks down in the older strata. Across the XCR, we observe that nearly all clusters share a similarly high level of repeat density, which may be attributed to the long evolutionary time that the XCR has been without homologous X-Y recombination, resulting in saturation in the density of repetitive elements across this region. Curiously, the cluster in the XAR that spans the recently X-transposed region has a higher repeat density than the remaining clusters in the XAR, which may be due to the inclusion of the centromeric sequence. When we break down the repetitive elements into different types, we observe that L1s (more than LTRs and Alus) account for the bulk of the variation in the density of repetitive elements between clusters (fig. 3B).
Fig. 3.—

Density of repetitive elements or genes across the clusters identified on the X chromosome. Here, we show the difference in the feature density between clusters: (A) density of genes, repetitive elements, CpG islands, and simple repeats is plotted for each cluster; (B) the repetitive element density is plotted for each cluster along with the L1, LTR, and Alu subsets of repetitive element.
To rule out the alternative hypothesis that the underlying structure of the X chromosome, derived from its autosomal ancestor, could be responsible for the distinct clusters observed on the X, we applied our method to the homologous autosomal sequence. In chicken, chromosome 4 (1–20 Mb) is homologous to the mammalian XAR, and chromosome 1 (103–123 Mb) is homologous to the XCR (Ross et al. 2005). When applying the segmentation and clustering algorithm to the homologous chicken autosomal regions, using the same parameters as for the human X, we do not observe any clustering in either region (supplementary fig. S4, Supplementary Material online). The absence of segmental structure within chicken autosomal sequences homologous to human X-linked sequences demonstrates that stratum formation fundamentally alters sequence composition, thus allowing identification of compositional signals unique to evolutionary strata by the proposed segmentation and clustering method.
In conclusion, we present a novel method for the unbiased detection of the presence of evolutionary strata on sex chromosomes and fine-scale delineation of their boundaries. Our method’s ability to detect strata is not limited by the availability of gametologous sex chromosome sequences. We envisage the applicability of our “unsupervised” method to sequences of the homogametic (X or Z) sex chromosome with yet unknown strata history. Because of the complementary strengths of other approaches, wherever the gametologous sequences are available, we suggest using our proposed method in concert with substitution rate, inversion, and phylogenetic methods. Where the heterogametic chromosomes are unavailable (Y or W), our proposed approach is the only resource to investigating the sex chromosome evolution. Future efforts should focus on the development of a comprehensive approach that can exploit the complementary strengths of different methods for better understanding of novel sex chromosome systems.
Materials and Methods
Genomic Sequences
The sequence of the human (hg19) X chromosome, the homologous regions in chicken (galGal3), as well as information about the repetitive elements, genic regions, CpG islands, and simple repeats were downloaded from the UCSC Genome Browser (Fujita et al. 2011). The human X chromosomal sequences homologous to the chicken regions were defined as the human XCR, homologous to chicken chr4: 1–20 Mb, and the human XAR, homologous to chicken chr1: 103–123 Mb (Ross et al. 2005). Definitions of previous strata were collected from the published articles (Lahn and Page 1999; Skaletsky et al. 2003; Ross et al. 2005; Lemaitre et al. 2009a; Wilson and Makova 2009; Katsura and Satta 2012).
Segmentation and Clustering Algorithm
Recursive segmentation methods have often been used for deciphering the compositional heterogeneity within genomic sequences (Bernaola-Galvan et al. 1996; Azad et al. 2002; Grosse et al. 2002; Thakur et al. 2007; Arvey et al. 2009; Azad and Li 2013). The underlying principle is to divide a sequence into two subsequences at a location where the compositional difference between the two subsequences is greatest. Given a genome sequence, this is accomplished by obtaining the compositional difference between subsequences to the left and right of each sequence position and then finding the position where this difference is maximized. This procedure is followed recursively for each of the resulting subsequences. Measures based on probability theory that could exploit the correlations underlying the nucleotide ordering have been suggested to be among the most sensitive and accurate measures for deciphering genome heterogeneities (Bernaola-Galvan et al. 1996; Grosse et al. 2002; Thakur et al. 2007; Arvey et al. 2009). One such measure, the Jensen-Shannon (JS) divergence (Lin 1991), is based on Shannon information entropy and is defined for the divergence between DNA sequences S1 and S2 of length l1 and l2 as (Grosse et al. 2002),
| (1) |
where the Shannon entropy  pb denotes the probability of nucleotide b, and
  denotes concatenation.
A generalization of this measure to account for the short-range correlations in the nucleotide ordering was obtained recently within the framework of Markov chain model of order m, defined as (Thakur et al. 2007; Arvey et al. 2009; Azad and Li 2013),
| (2) |
Here, the Hm( ) denotes the conditional entropy function, defined as,
| (3) |
where w denotes oligonucleotide of length m preceding the nucleotide b, P(w) is the probability of oligonucleotide w, and P(b|w) is the probability of nucleotide b given the preceding oligonucleotide w. The values of probabilistic parameters are estimated from the counts of oligonucleotides; P(w) ≈ N(w)/(li − m + 1) and P(b|w) ≈ N(wb)/N(w), N(.) denotes the count. The standard JS divergence, as defined in equation (1), is recovered when m = 0.
The probability distribution of Dm, that is, the probability of observing Dm or less by chance, has been shown to follow a  distribution function,
  with υ = km(k − 1) degrees of freedom, k being the alphabet size (k = 4 for DNA sequences) (Thakur et al. 2007; Arvey et al. 2009). The recursive segmentation procedure entails obtaining the maximum value of Dm; the statistical significance of the maximum value of Dm can be assessed from the probability distribution of
  , which was shown to approximate a
  distribution function with fitting parameters β and λ,
  β and λ were estimated by fitting the above analytic expression to the empirical distributions obtained via Monte Carlo simulations (Thakur et al. 2007; Arvey et al. 2009).
A given DNA sequence is segmented at the position of maximal divergence if the P value,  is less than a preset significance level. The recursive segmentation process is halted when none of the sequence segments meets the above criterion for segmentation. This is followed by a two-step agglomerative clustering procedure, again within the framework of statistical hypothesis testing. That is, if the P value,
  computed for the JS divergence between two sequence segments, is less than a preset significance level, the sequence segments are deemed significantly different. Otherwise, they are grouped together. As we allow hypersegmentation to detect the breakpoints with greater precision, the agglomerative clustering is designed to first restore the segmental structure by identifying the compositionally similar, contiguous sequence segments. This is followed by second step of clustering nonneighboring, similar sequence segments. An approach similar to this was earlier tested on bacterial genomes for deciphering their chimeric structure (Azad and Li 2013). This study was focused on the development and validation of the integrative segmentation and clustering methodology and algorithm for analyzing long eukaryotic genomes, particularly deciphering the segmental structure underlying human X chromosome, which we hypothesized to have arisen because of stepwise recombination suppressions between the X and Y chromosomes.
Supplementary Material
Supplementary figures S1–S4 and table S1 are available at Genome Biology and Evolution online (http://www.gbe.oxfordjournals.org/).
Acknowledgments
This work was supported by a faculty start up fund from the University of North Texas to R.K.A., Beth Baird graduate student scholarship to R.S.P., and Miller fellowship from the Miller Institute for Basic Research in Science to M.A.W.S.
Literature Cited
- Arvey AJ, Azad RK, Raval A, Lawrence JG. Detection of genomic islands via segmental genome heterogeneity. Nucleic Acids Res. 2009;37:5255–5266. doi: 10.1093/nar/gkp576. [DOI] [PMC free article] [PubMed] [Google Scholar]
- Azad RK, Bernaola-Galvan P, Ramaswamy R, Rao JS. Segmentation of genomic DNA through entropic divergence: power laws and scaling. Phys Rev E Stat Nonlin Soft Matter Phys. 2002;65: 051909. doi: 10.1103/PhysRevE.65.051909. [DOI] [PubMed] [Google Scholar]
- Azad RK, Li J. Interpreting genomic data via entropic dissection. Nucleic Acids Res. 2013;41:e23. doi: 10.1093/nar/gks917. [DOI] [PMC free article] [PubMed] [Google Scholar]
- Bergero R, Forrest A, Kamau E, Charlesworth D. Evolutionary strata on the X chromosomes of the dioecious plant Silene latifolia: evidence from new sex-linked genes. Genetics. 2007;175:1945–1954. doi: 10.1534/genetics.106.070110. [DOI] [PMC free article] [PubMed] [Google Scholar]
- Bernaola-Galvan P, Roman-Roldan R, Oliver JL. Compositional segmentation and long-range fractal correlations in DNA sequences. Phys Rev E Stat Phys Plasmas Fluids Relat Interdiscip Topics. 1996;53:5181–5189. doi: 10.1103/physreve.53.5181. [DOI] [PubMed] [Google Scholar]
- Carrel L, et al. Genomic environment predicts expression patterns on the human inactive X chromosome. PLoS Genet. 2006;2:1477–1486. doi: 10.1371/journal.pgen.0020151. [DOI] [PMC free article] [PubMed] [Google Scholar]
- Charchar FJ, et al. Complex events in the evolution of the human pseudoautosomal region 2 (PAR2) Genome Res. 2003;13:281–286. doi: 10.1101/gr.390503. [DOI] [PMC free article] [PubMed] [Google Scholar]
- Charlesworth B. Model for evolution of Y chromsomes and dosage compensation. Proc Natl Acad Sci U S A. 1978;75:5618–5622. doi: 10.1073/pnas.75.11.5618. [DOI] [PMC free article] [PubMed] [Google Scholar]
- Fujita PA, et al. The UCSC Genome Browser database: update 2011. Nucleic Acids Res. 2011;39:D876–882. doi: 10.1093/nar/gkq963. [DOI] [PMC free article] [PubMed] [Google Scholar]
- Grosse I, et al. Analysis of symbolic sequences using the Jensen-Shannon divergence. Phys Rev E Stat Nonlin Soft Matter Phys. 2002;65:041905. doi: 10.1103/PhysRevE.65.041905. [DOI] [PubMed] [Google Scholar]
- Iwase M, et al. The amelogenin loci span an ancient pseudoautosomal boundary in diverse mammalian species. Proc Natl Acad Sci U S A. 2003;100:5258–5263. doi: 10.1073/pnas.0635848100. [DOI] [PMC free article] [PubMed] [Google Scholar]
- Katsura Y, Satta Y. No evidence for a second evolutionary stratum during the early evolution of mammalian sex chromosomes. PLoS One. 2012;7:e45488. doi: 10.1371/journal.pone.0045488. [DOI] [PMC free article] [PubMed] [Google Scholar]
- Kelkar A, Thakur V, Ramaswamy R, Deobagkar D. Characterisation of inactivation domains and evolutionary strata in human X chromosome through Markov segmentation. PLoS One. 2009;4:e7885. doi: 10.1371/journal.pone.0007885. [DOI] [PMC free article] [PubMed] [Google Scholar]
- Kirkpatrick M, Barton N. Chromosome inversions, local adaptation and speciation. Genetics. 2006;173:419–434. doi: 10.1534/genetics.105.047985. [DOI] [PMC free article] [PubMed] [Google Scholar]
- Lahn BT, Page DC. Four evolutionary strata on the human X chromosome. Science. 1999;286:964–967. doi: 10.1126/science.286.5441.964. [DOI] [PubMed] [Google Scholar]
- Lemaitre C, et al. Footprints of inversions at present and past pseudoautosomal boundaries in human sex chromosomes. Genome Biol Evol. 2009a;1:56–66. doi: 10.1093/gbe/evp006. [DOI] [PMC free article] [PubMed] [Google Scholar]
- Lemaitre JF, Ramm SA, Barton RA, Stockley P. Sperm competition and brain size evolution in mammals. J Evol Biol. 2009b;22:2215–2221. doi: 10.1111/j.1420-9101.2009.01837.x. [DOI] [PubMed] [Google Scholar]
- Lin J. Divergence measures based on the Shannon entropy. IEEE Trans Inform Theory. 1991;37:145–151. [Google Scholar]
- Nam K, Ellegren H. The chicken (Gallus gallus) Z chromosome contains at least three nonlinear evolutionary strata. Genetics. 2008;180:1131–1136. doi: 10.1534/genetics.108.090324. [DOI] [PMC free article] [PubMed] [Google Scholar]
- Ross MT, et al. The DNA sequence of the human X chromosome. Nature. 2005;434:325–337. doi: 10.1038/nature03440. [DOI] [PMC free article] [PubMed] [Google Scholar]
- Sandstedt SA, Tucker PK. Evolutionary strata on the mouse X chromosome correspond to strata on the human X chromosome. Genome Res. 2004;14:267–272. doi: 10.1101/gr.1796204. [DOI] [PMC free article] [PubMed] [Google Scholar]
- Skaletsky H, et al. The male-specific region of the human Y chromosome is a mosaic of discrete sequence classes. Nature. 2003;423:825–837. doi: 10.1038/nature01722. [DOI] [PubMed] [Google Scholar]
- Thakur V, Azad RK, Ramaswamy R. Markov models of genome segmentation. Phys Rev E Stat Nonlin Soft Matter Phys. 2007;75:011915. doi: 10.1103/PhysRevE.75.011915. [DOI] [PubMed] [Google Scholar]
- Veyrunes F, et al. Bird-like sex chromosomes of platypus imply recent origin of mammal sex chromosomes. Genome Res. 2008;18:965–973. doi: 10.1101/gr.7101908. [DOI] [PMC free article] [PubMed] [Google Scholar]
- Wilcox SA, Watson JM, Spencer JA, Graves JAM. Comparative mapping identifies the fusion point of an ancient mammalian X-autosomal rearrangement. Genomics. 1996;35:66–70. doi: 10.1006/geno.1996.0323. [DOI] [PubMed] [Google Scholar]
- Wilson MA, Makova KD. Evolution and survival on eutherian sex chromosomes. PLoS Genet. 2009;5:e1000568. doi: 10.1371/journal.pgen.1000568. [DOI] [PMC free article] [PubMed] [Google Scholar]
- Wilson Sayres MA, Makova KD. Gene survival and death on the human Y chromosome. Mol Biol Evol. 2013;30:781–787. doi: 10.1093/molbev/mss267. [DOI] [PMC free article] [PubMed] [Google Scholar]
Associated Data
This section collects any data citations, data availability statements, or supplementary materials included in this article.