

SUMMARY
Ionotropic glutamate receptors (iGluRs) transduce the chemical signal of neurotransmitter release into membrane depolarization at excitatory synapses in the brain. The opening of the transmembrane ion channel of these ligand-gated receptors is driven by conformational transitions that are induced by the association of glutamate molecules to the ligand-binding domains (LBDs). Here, we describe the crystal structure of a GluA2 LBD tetramer in a configuration that involves an ~30° rotation of the LBD dimers relative to the crystal structure of the full-length receptor. The configuration is stabilized by an engineered disulfide crosslink. Biochemical and electrophysiological studies on full-length receptors incorporating either this crosslink or an engineered metal bridge show that this LBD configuration corresponds to an intermediate state of receptor activation. GluA2 activation therefore involves a combination of both intra-LBD (cleft closure) and inter-LBD dimer conformational transitions. Overall, these results provide a comprehensive structural characterization of an iGluR intermediate state.
INTRODUCTION
The α-amino-3-hydroxy-5-methyl-4-isoxazolepropionic acid (AMPA) subtype ionotropic glutamate receptors (iGluRs) are ligand-gated ion channels that mediate the majority of fast excitatory synaptic transmission in the brain (Traynelis et al., 2010). In common with other iGluRs, each AMPA receptor subunit includes four domains (Mayer, 2011). Closure of the extracellular clamshell-like ligand-binding domains (LBDs) upon glutamate binding is envisaged to open the gate of the cation-permeable ion channel formed by the transmembrane domain (TMD). The amino- and carboxy-terminal domains (ATD and CTD, respectively) play only minor roles in AMPA receptor activation (i.e., gating). At present, only one crystal structure of a full-length iGluR is available, that of the AMPA receptor GluA2, in an antagonist-bound, closed pore conformation (Protein Data Bank (PDB) ID 3KG2) (Sobolevsky et al., 2009). The four LBDs are in an open cleft conformation, bound to the antagonist ZK200775 (Turski et al., 1998) and associate via interactions at the well-characterized lobe 1 interface (Sun et al., 2002) into two dimers. In the full-length GluA2 structure, the four subunits are named A, B, C, and D. The two LBD dimers are formed by the A–D and B–C subunits. We use the same nomenclature in the studies presented here.
To date, most studies of iGluR activation have considered either the individual binding domains or the dimers of LBDs. To understand properly how the concerted action of the LBDs and the TMD drives glutamate receptor activation, it is essential instead to work within the context of the four subunits in the tetramer. The first step is to obtain knowledge of the functionally relevant conformational states of the moving parts of the protein assembly. A powerful strategy to achieve this goal is by engineering artificial crosslinks between selected sites within the protein to selectively trap functional states. Such crosslinks have allowed the crystallization of nondesensitized and desensitized LBD dimers (Armstrong et al., 2006; Weston et al., 2006) and have also proved fruitful in studies of potassium channels (Campos et al., 2007; Lainé et al., 2003) and nicotinic receptors (Mukhtasimova et al., 2009).
Here, we report the crystal structure of a crosslinked mutant GluA2 LBD tetrameric assembly. The two LBD dimers are rotated ~30° relative to the dimers in the crystal structure of the full-length receptor. This configuration is stabilized by a disulfide bond between diagonally positioned subunits, subunits A and C, at cysteines introduced at position 665. Disulfide bond formation also results in the LBD dimers being translated closer together. Biochemical studies demonstrate that the same C665-C665 crosslink can be formed in full-length receptors. Electrophysiological studies of AMPA receptors with this cross-link or separately engineered metal bridges suggest that these conformational rearrangements between LBD dimers occur in a functional state prior to full activation of the receptor.
RESULTS
Inter-LBD Dimer Crosslink
Little is known about conformational rearrangements between iGluR LBD dimers during ion channel gating. However, cysteine residues introduced in the loop between helices F and G of the GluA2 LBD have been shown to form crosslinks between subunits A and C and modify gating behavior (Armstrong et al., 2006; Plested and Mayer, 2009; Sobolevsky et al., 2009). Similar results have been obtained in the kainate receptor subtype GluK2 (Das et al., 2010). The initial design of the A665C substitution (near the N terminus of helix G) that forms the interdimer LBD disulfide crosslink studied here was based on a theoretical structural model of an LBD-TMD tetramer generated before the X-ray structure of the full-length receptor was available (unpublished data). In this model, the Cα atoms of A665 in subunits A and C are 5 Å apart, 3 Å closer together than in the crystal structure of the full-length receptor. We hypothesized that if such a translation of the LBDs by a few angstroms occurs in an intact receptor, it could form an engineered disulfide crosslink, stabilizing a conformationally distinct LBD tetrameric assembly.
Seeking structural insight into possible conformational states within a tetrameric LBD layer, we determined the crystal structure of a GluA2-L483Y-A665C LBD mutant at 2.8 Å resolution (Figure 1). The L483Y mutation was introduced in order to stabilize LBD dimer formation (Sun et al., 2002). Each LBD is in complex with the antagonist 6,7-dinitro-2,3-quinoxalinedione (DNQX), which stabilizes an open conformation of the LBD clam-shells. The asymmetric unit contains four LBD molecules, which we call Mol1, Mol2, Mol3, and Mol4. Mol1 and Mol2 form a “back-to-back” dimer within the asymmetric unit, whereas Mol3 and Mol4 are arranged “side-by-side” (Figure S1 available online). Mol1-Mol2 and Mol3-Mol4 each form tetramers when paired with their respective subunits from adjacent asymmetric units in the crystal. These tetrameric arrangements are physiologically plausible because connections to the ATD and TMD are collectively located on opposite sides of the tetramer, as seen in the structure of the full-length receptor. Data collection and refinement statistics are detailed in Table 1.
Figure 1. A Disulfide-Bridged GluA2-L483Y-A665C LBD Tetramer.

(A) A 2Fo–Fc electron density envelope for the LBD tetramer contoured at 2 σ is shown. Subunits A, B, C, and D are shown in green, red, blue, and yellow, respectively. DNQX is shown in purple.
(B) A 2Fo–Fc electron density for A655C contoured at 1.5 σ is shown. The view is from “above” the LBD layer. Subunits A and C are covalently linked by the disulfide bond at position 655, which is situated between helices F and G.
(C and D) The LBD tetramer from the crystal structure of the full-length GluA2 receptor (Sobolevsky et al., 2009) is presented. The antagonist ZK200775 is shown in purple. The A655 Cα-Cα distance between subunits A and C, indicated by the line, is 8.0 Å.
(E) An illustration of the transition predicted by the lowest-frequency normal mode going between the OA (right) and CA (left) conformations is shown. The OA conformation corresponds to the conformation shown in (C), and the CA conformation corresponds to the conformation shown in (A). The angle that describes the relative orientation between dimer pairs A–D and B–C has its vertex at the center of mass of the Cα atoms of residue 665 in subunits A and C. The rays of the angle (cyan arrows) pass through subunits A and C at the Cα atom of Leu748.
See also Figure S1.
Table 1.
Data Collection and Refinement Statistics
| GluA2-L483Y-A665C | |
|---|---|
| Data Collection | |
| Space group | P21212 |
| Cell dimensions (Å) | |
| a | 48.85 |
| b | 96.79 |
| c | 252.84 |
| Resolution (Å) | 52.92–2.80 (2.95–2.80)a |
| Rmerge | 0.101 (0.270) |
| I/σ | 10.7 (4.3) |
| Completeness (%) | 0.955 (0.923) |
| Redundancy | 5.2 (5.1) |
| Refinement | |
| Resolution (Å) | 52.92–2.80 |
| Number of reflections | 27,469 |
| Rwork/Rfree | 0.195/0.244 |
| Number of atoms | |
| Protein | 7,904 |
| Ligand/ion | 87 |
| Water | 137 |
| B factors | |
| Protein | 53.90 |
| Ligand/ion | 68.76 |
| Water | 32.63 |
| Rmsds | |
| Bond lengths (Å) | 0.001 |
| Bond angles (°) | 0.429 |
Values in parentheses are for the highest-resolution shell.
The root-mean-square deviations (rmsds) among the four LBDs in the asymmetric unit (Mol1–Mol4) range from 0.3 to 0.7 Å, with the difference in cleft closure, Δξ12, varying from 0.1 to 0.7 Å (see Experimental Procedures). The back-to-back dimer interfaces are very similar in the two physiological tetramers formed by Mol1-Mol2 and Mol3-Mol4—the rmsd measured at Cα atoms in helices D and J is ~0.3 Å. These dimers are very similar to those observed in the full-length GluA2 crystal structure, with rmsds ranging from 0.4 to 0.6 Å. Overall, the electron density is stronger for chains Mol1 and Mol2 than for chains Mol3 and Mol4. The following structural analysis will refer only to the LBD tetramer formed by Mol1 and Mol2.
A single inter-LBD disulfide bond forms within the tetramer between Cys 665 of subunits A and C (following the subunit labeling of Sobolevsky et al., 2009). Electron density for the C665-C665 disulfide bond is weak. This observation may reflect incomplete disulfide bond formation in the crystal. In the crystal structure of the full-length receptor, the distance between the Cα atoms of A665 in subunits A and C is 8.0 Å (Figure 1D). This distance is 5.4 Å between crosslinked LBDs (Figure 1B). It is noteworthy that the LBDs of subunits A and C must be in open cleft conformations for the crosslink to form. Modeling complete closure of these LBDs increases the Cα-Cα distance at position 665 to 9 Å, which is too great for disulfide bond formation.
Relative Orientation of LBD Dimers
The relative orientation of the two LBD dimers (subunit pairs A–D and B–C) in the tetramer can be described by an angle between the dimers. We defined this angle between two vectors that originate at the center of mass of the Cα atoms of residue 665 in subunits A and C and pass through the Cα atom of L748 in either subunit A or C (Figure 1E). This angle is 145° in the crystal structure of the full-length receptor and 112° in the crystal structure of the crosslinked LBD tetramer. We name these two interdimer orientations the open angle (OA) conformation and the closed angle (CA) conformation, respectively.
OA-to-CA transitions were examined using normal mode analysis (NMA). In NMA, an effective harmonic potential energy surface is assumed, and vibrations around the energy minimum are calculated. Interest in NMA stems from the fact that low-frequency modes have often been shown to provide a good description of large conformational fluctuations observed experimentally around a stable conformation (Echeverria Riesco, 2011; Tama and Sanejouand, 2001; Temiz et al., 2004; Zheng et al., 2006). Using the LBD tetramer from the crystal structure of the full-length receptor as the reference conformation, we generated a range of LBD tetramer conformations associated with the lowest-frequency normal mode calculated using the anisotropic network model (ANM) server (Eyal et al., 2006). Interestingly, this simple low-frequency motion transformed the OA conformation into the CA conformation, decreasing the Cα rmsd with respect to the crystal structure of the crosslinked LBD tetramer from 7.1 to 3.9 Å as well as decreasing the characteristic angle from 145° to 113° (Figure 1E). The fact that the CA conformation could be obtained by moving the structure along the lowest-frequency normal mode, originating from the OA conformation, is suggestive that OA-to-CA transitions could be a genuine dynamical feature of the receptor.
Functional Trapping with A665C
We performed scanning cysteine mutagenesis between residues 658 and 670 to build a functional map of crosslinks at the interdimer interface. Wild-type (WT) receptors are insensitive to oxidizing or reducing conditions (Figure 2A). Cysteine substitutions within helices F or G produced mutant receptors that exhibited a range of sensitivities. The R661C mutant, for example, is almost as insensitive as the WT receptors (Figure 2B). On the other hand, the I664C mutant is inhibited ~80% by oxidization (Plested and Mayer, 2009), and the neighboring mutant, GluA2-A665C, exhibited ~90% reduction in peak current amplitude relative to reducing conditions (Figure 2C). Under reducing conditions, GluA2-A665C had similar activation and desensitization kinetics to WT GluA2, suggesting limited functional impact of the A665C substitution. Strikingly, a position-dependent reduction in peak current was observed upon oxidation for sites at the end of helix F and within the loop between helices F and G (Figure 2D). Peak current measurements and molecular modeling suggest that the A665C substitution is unlikely to result in crosslinks between receptors (Figure S2).
Figure 2. Trapping of the Full-Length GluA2-A665C Receptor.

(A) Activation and desensitization of WT GluA2 were not affected by oxidizing conditions. Single-exponential fits to the desensitization of responses to 10 mM glutamate in 1 mM DTT (control; kdes = 156 s−1, triangles and Wash [washout]; kdes = 164 s−1, gray circles) and 10 μM CuPhen (kdes = 167 s−1, open circles) are illustrated.
(B) Activation and desensitization of the R661C mutant were similar in oxidizing conditions (10 μM CuPhen, open circles, kdes = 239 s−1) and in reducing conditions (1 mM DTT; control, triangles, kdes = 239 s−1; wash, gray circles, kdes = 207 s−1).
(C) The A665C mutant shows a strong reduction of the peak current (~90%) under oxidizing conditions with a full recovery of the current after the re-application of 1 mM DTT. The desensitization rate was similar before and after the application of CuPhen (control kdes = 149 s−1, triangles; kdes = 175 s−1 after washout in 1 mM DTT, gray circles). The inset shows the fit (dashed line) to the current in oxidizing conditions.
(D) Bar graph representing the effect of CuPhen on the peak current in WT and mutant receptors. Individual patches are shown as open circles. The strongest inhibition in oxidizing conditions was for A665C (peak current 11% ± 4% of that in reducing conditions; p<0.0001 versus WT (***); one-way ANOVA with Dunnett’s post hoc test). For R661C, the probability of no difference versus control was 0.95; for V666C, p<0.001 (**); for the other mutants, p<0.01 (*). The data for the I664C mutant are taken from Plested and Mayer (2009).
See also Figure S2.
The A665C Mutation Traps Dimers
Although electrophysiological recordings demonstrate redox-sensitive inhibition of AMPA receptors harboring the A665C mutation, we sought to demonstrate that these cysteines could participate in a physical crosslink between subunits. Western blots showed that, as for purified WT GluK2 (Das et al., 2010), WT GluA2 in lysates from HEK cells forms dimers spontaneously under nonreducing conditions (Figure S3C). To provide a good background for detecting dimerization due to the A665C mutation, we generated GluA2 constructs lacking the cysteines not involved in the two structural disulfide bonds (C63 and C315, C718 and C773). Serial removal of cysteines lowered, but did not eliminate, dimer formation in oxidizing conditions until we removed all the remaining seven cysteines, indicating that denaturation allows natively buried cysteines to form confounding, nonphysiological crosslinks. Receptors lacking these seven cysteines (GluA2 7 × Cys (−)) displayed similar rates of activation and desensitization as WT in outside-out patches from HEK cells (kdes = 210 s−1; n = 3 patches), although currents were small, probably because of impaired trafficking (Figure 3A). The GluA2 7 × Cys (−) mutant was essentially monomeric on nonreducing SDS-PAGE, even following 30 min of treatment with 100 μM of the oxidizing agent copper phenanthroline (CuPhen; 12% ± 2% dimer; Figures 3B and 3C). In contrast, the GluA2 7 × (−) A665C mutant spontaneously formed dimers in control conditions (Figures 3B and 3C). Dimer formation was enhanced by oxidizing conditions (100 μM CuPhen) and eliminated by reducing treatment (100 mM DTT).
Figure 3. The A665C Mutant Traps Dimers.

(A) The GluA2-C89S-C190A-C436S-C425S-C528S-C589S-C815S (7 × Cys (−)) construct shows similar activation and desensitization to WT (kdes = 210 s−1), but functional expression was strongly decreased.
(B) In western blots under oxidizing conditions, subunit dimers (D) were strongly enriched, compared with the monomer band (M), for the 7 × Cys (−) A665C mutant, but not for the 7x(−) background. All reactions were performed in the presence of 500 μM glutamate and 100 μM CTZ. MW, molecular weight; Con, control; Red, reducing; Ox, oxidizing.
(C) Western blot analysis of 7 × Cys (−) A665C mutant following in vivo crosslinking. Cells were exposed to oxidizing conditions for 30 m in DNQX (10 μM) or glutamate (500 μM and 10 mM). All conditions included CTZ.
(D) Fraction of dimer formation in reducing (open bars) and oxidizing (filled bars) conditions. The dimer fraction in oxidizing conditions with 500 μM glutamate was 30% ± 4% for the 7 ×Cys (−) A665C mutant (n = 11 blots). The mutant R661C showed no significant increase in dimer formation over the background (14% ± 2%; n = 5; p = 0.99 versus GluA2 7 × Cys (−); n = 6). A665C showed a significant decrease in dimer formation in 10 mM glutamate (14% ± 3%; n = 6; p = 0.026 versus 500 μM). There was no significant difference in dimer formation in the presence of DNQX (p = 0.41 versus 500 μM glutamate; n = 5; Dunnett’s post hoc test).
See also Figure S3.
To test if the crosslinking of subunits in GluA2-A665C was specific to functional receptors, i.e., those that could be controlled by iGluR ligands, we tested for dimerization in various conditions. A substantial dimer fraction was observed in the presence of 500 μM glutamate (30% ± 4%; n = 11 blots). This dimerization was specific to the introduction of cysteine at position 665 because the nearby R661C mutant, which exhibited minimal inhibition in electrophysiological assays, showed indistinguishable dimer formation from the background in the same conditions (14% ± 2%; n = 5; p = 0.99 versus GluA2 7 × Cys (−); Dunnett’s post hoc test; Figures 3D and S3D). Dimerization of the A665C mutant was reduced to control levels by crosslinking in the presence of 10 mM glutamate (14% ± 3%; n = 6 blots; p = 0.026 versus 500 μM glutamate; both with 100 μM cyclothiazide [CTZ]; Figure 3D). Inclusion of DNQX and CTZ produced a level of dimerization in between that of control (R661C) and A665C with 500 μM glutamate, but the difference from either was not significant (n = 5 blots, p = 0.41 versus A665C; p = 0.82 versus R661C; Dunnett’s post hoc test).
Structural Consequences of OA-to-CA Transitions
Our structural, biochemical, and electrophysiological findings suggest that the LBD assembly can adopt a distinct CA conformation that occurs readily in full-length receptors. The CA conformation might be unstable in full-length receptors, but the crosslinked LBD tetramer structure is stabilized by an inter-subunit disulfide bond. The absence of the ATD and TMD perhaps also allows the LBDs to adopt this configuration unhindered. What then are the expected consequences of the CA conformation in full-length channels? To investigate whether OA-to-CA transitions in an intact receptor would require rearrangements of the ATD tetramer conformation, we measured the distance between the Cα atoms of T394 (lobe 1 of the LBD, proximal to the ATD). In an OA-to-CA transition, the pairwise intersubunit distances would likely either decrease or stay about the same (Table S1). Thus, consistent with a minimal role for ATD transitions in gating, OA-to-CA transitions are predicted to not disrupt the conformation of the ATD layer observed in the full-length receptor structure.
One measure of the extent to which the four LBDs provide impetus to gate the channel is the distances between LBD segments proximal to the TMD, i.e., the Cα atoms of P632, for each pair of subunits (Lau and Roux, 2011; Sobolevsky et al., 2009). We examined these distances in the crosslinked LBD tetramer structure, the full-length GluA2 structure, and several modeled conformations of the LBDs (Table S1). The analysis indicates that the CA conformation results in greater P632-P632 distances relative to the OA conformation. For example, the distances between adjacent LBDs, i.e., subunits A–B and subunits C–D, increase by ~12 Å, and the distances between diagonal LBDs, i.e., subunits A–C and subunits B–D, increase by ~8 and ~24 Å, respectively. This increase, however, is due not just to OA-to-CA transitions but also to more open cleft conformations in the LBDs of the CA conformation compared with the full-length structure. Nonetheless, these observations suggest that adoption of the CA conformation could potentially trigger ion channel pore gating. How do P632-P632 distances change upon OA-to-CA transitions versus LBD closure? To address this question, open and closed LBD conformations were alternately modeled into the OA and CA LBD tetramer conformations (Table S2). For the A–D and B–C distances, larger changes are observed upon LBD closure than upon OA-to-CA transitions. For the A–B, C–D, and B–D distances, however, larger changes are observed upon OA-to-CA transitions. For the A–C distance, the largest change is seen for the OA-to-CA transition with open LBDs.
The CA Conformation Occurs during Receptor Activation
A marked feature of the CA conformation is that the upper lobes from apposed LBD dimers are ~16 Å closer together compared with the OA conformation. We employed functional crosslinking to detect the CA conformation in full-length, membrane-expressed GluA2 during gating. Our strategy was to engineer potential lobe 1-lobe 1 crosslinks at sites that are predicted to change in proximity upon OA-to-CA transitions (Figure 4A). Our initial attempts to engineer pairs of cysteine residues (K439C and D456C) as substrates for bifunctional thiol reagents failed to produce functional channels. Single-cysteine control mutants showed apparently normal gating (data not shown). We tried exposing these double-cysteine mutants to EDTA in case a high-affinity metal site was formed, to 30 mM DTT for up to 1 hr before recording, and to 1 mM DTT overnight during cell culture, but we never obtained recordings of this mutant. To obtain trappable mutants that were also functional, we turned to engineered metal trapping bridges (Figures 4A and 4B). We screened 11 combinations of histidine and cysteine residues and found two triple-histidine mutants and two double-histidine single-cysteine combinations, where 1 μM zinc selectively reduced the glutamate-gated current by ~50% over nominally divalent-free conditions (2 mM EDTA). Representative traces from WT GluA2, an insensitive mutant, and the GluA2-G437H-K439H-D456H mutant (named HHH) are shown in Figure 4C. Most control mutants were functional, but like WT receptors, none showed inhibition by 1 μM zinc (Figure 4D). Despite differing in local stereochemistry, the four triple mutants all have similar sensitivities. This observation suggests that the inhibition is not a nonspecific effect of structural disruption but, rather, a general property resulting from restraining the receptor in the CA conformation. Using the GluA2 7 × Cys (−) background, we inserted cysteines in positions K439C and D456C. Although this double mutant was not functional, western blots revealed modest redox-sensitive dimer formation in oxidizing conditions (Figure 4E), in excess of the limited dimerization of single mutants (Figures 4F and S3).
Figure 4. Engineered Metal Bridges Confirm the CA Conformation in the Full-Length Receptor during Activation.

(A and B) The engineered HHH metal bridge is formed by the triple-histidine mutation G437H-K439H-D456H (blue spheres at α carbons). Metal bridges cannot form when the LBDs are in the OA conformation (A) but can form when they are in the CA conformation (B). The direction of view is the same as in Figure 1E. Only subunits A and B are shown for clarity.
(C) Zinc (1 μM) selectively inhibits a triple-histidine mutant that is predicted to compose an interdimer metal bridge in the CA conformation, but not WT or a mutant with half the site.
(D) Summary of inhibition by 1 μM zinc for WT, half-sites, controls, and the four triple mutants that show inhibition.
(E) The double-cysteine mutant (K439C-D456C) was not expressed as a functional glutamate receptor, but western blot analysis of total cell lysate revealed redox-sensitive trapping of dimers.
(F) Fraction of dimer formation in reducing (green bar) and oxidizing conditions (purple bars). Dimer formation was observed for the 7 × Cys (–) K439C-D456C (KD) mutant (43% ± 5% in oxidizing conditions; p<0.05 versus K439C single mutant (*) and p<0.01 versus reducing conditions (**)). The dashed line shows dimer formation for the 7 × Cys (–) WT construct in oxidizing conditions. The number of blots is indicated in each bar.
State Dependence of Receptor Trapping
Our cysteine scan shows that crosslinking can occur at sites in the loop between helices F and G and reduce the peak current in response to glutamate application. Receptors were exposed to oxidizing conditions for a series of glutamate applications at 1 Hz, allowing them to transition through all functional states during the glutamate pulse and in the ~1 s interval before the subsequent pulse. Thus, these measurements did not reveal if disulfide formation was preferred in any particular functional state, such as the resting, desensitized, or activated state. To identify the state in which the A665C mutation traps GluA2, we performed patch-clamp recordings of receptors in outside-out patches biased into specific states, detecting trapping as a loss of glutamate-activated current following exposure to 10 μM CuPhen.
Applying oxidizing conditions to GluA2-A665C mutant receptors during desensitization (100 μM glutamate in the absence of CTZ) for 1 s did not lead to appreciable inhibition (data not shown). However, longer oxidizing exposures in desensitizing conditions (>30 s) stably inhibited the glutamate-activated current. The time constant of recovery was too slow to estimate reliably because measurements over minutes were hindered by rundown of the patch current. This stable desensitized trapping probably contributed to the strong inhibition of the A665C mutant shown in Figure 2C.
To avoid confounding effects of receptor desensitization when probing the resting and activated states, and to mimic the conditions of the GluA2-L483Y-A665C crystal structure, we attempted to use an L483Y-A665C double mutant for subsequent electrophysiology. This mutant, however, greatly reduced cell viability upon transfection, and we were unable to record responses from surviving cells. Instead, we used 100 μM CTZ to block desensitization, which should mimic the effects of the L483Y mutation (Sun et al., 2002). At the end of a 1 s application of 10 mM glutamate, the steady-state current was 100% ± 1% (n = 14) of the initial peak current for WT and 98% ± 1% (n = 14) of the peak for the mutant GluA2-A665C (Figure S4). This result shows that desensitization was almost entirely absent in experiments on the A665C mutant performed with CTZ and, taken together with other experiments on the HHH mutant described below, rules out the possibility that the CA conformation represents a state associated with desensitization.
We held A665C receptors in the resting state by saturating them with 10 μM DNQX in addition to 100 μM CTZ. These receptors did not show a loss of glutamate-activated current following exposure to 10 μM CuPhen, suggesting that A665C does not appreciably form cross-links in the resting state (Figures 5A and S4). Apo A665C receptors and those bound with 30 μM 6-cyano-7-nitroqui-noxaline-2,3-dione (CNQX) were similarly refractory to trapping when CTZ was included (data not shown). Trapping was again barely detectable when the receptors were saturated with 10 mM glutamate and 100 μM CTZ (Figure 5A), indicating that the crosslink also does not trap the receptor in a fully activated state.
Figure 5. The A665C Crosslink Traps an Activation Intermediate that Is Not Saturated with Agonist.

(A) Responses to 10 mM glutamate in 1 mM DTT (green bars) flanking an application of 10 μM CuPhen (red bars) in the DNQX-bound resting state (1 s; top trace) and open state (3 s; middle trace) reveal negligible trapping. A substantial trapping relaxation was observed in the presence of an intermediate glutamate concentration (τ = 0.5s; 500 μM; lower trace, red circles). CTZ (100 μM) was present throughout.
(B) The active fraction of receptors after oxidization in the presence of 10 μM DNQX (purple), 10 mM glutamate (blue), and 500 μM glutamate (yellow, exponential fit) is plotted against the trapping interval. The open red circles represent the mean of exponential fits to the trapping relaxation (as in A). Arrows indicate intervals for the traces in (A) (n = 3–6 patches per point).
(C) Trapping in oxidizing conditions at different concentrations of glutamate is presented. In the top panel, three records from the same patch show trapping in CuPhen (red bar) with 10 μM (light-blue trace), 500 μM (orange trace), and 10 mM glutamate (dark-blue trace). Robust trapping only occurs in 500 μM glutamate (expanded scale, middle panel). The open red circles are a mono-exponential fit to the relaxation (same fit as in A, lower trace, and B). The arrows and symbols indicate the measurements plotted in (D). WT GluA2 was not modified by oxidization (lower panel, red bar) in 500 μM glutamate.
(D) Concentration-response curves in CuPhen and 100 μM CTZ for WT GluA2 (blue open circles; EC50 = 270 ± 140 μM), GluA2 A665C following reduction (green triangles; EC50 = 530 ± 160 μM), and following trapping (red squares; EC50 = 1.9 ± 0.2 mM). The difference between the reduced and oxidized (trapped) A665C mutant is significant (p < 0.001). Plotting the active fraction current after trapping (yellow diamonds) versus glutamate concentration reveals maximal trapping at 248 μM glutamate (n = 5).
See also Figures S4, S5, and S6.
In contrast to the observations above, we detected substantial trapping at concentrations of glutamate over the range 100 μM to 2 mM. The exponential decay of the current following the jump into oxidizing conditions at 500 μM glutamate (τ = 500 ± 100 ms; n = 5) was indistinguishable from the extent of trapping plotted against different time intervals (τ = 400 ± 100 ms; Figure 5B), suggesting that this relaxation reflects the inhibition due to formation of the disulfide bond. WT receptors showed no inhibition in oxidizing conditions when activated by 500 μM glutamate (Figure 5C). The relationship between the active (untrapped) fraction and log concentration followed an inverted bell shape and thus was well described by an inverted log normal function with a minimum at 248 μM (Figure 5D). Kinetic simulations of channel activation demonstrated that this relationship mandates trapping in partially bound states (Figure S5). Crosslinking also lowered apparent glutamate potency, consistent with a reduced occupancy of the receptor by glutamate (Figure 5D). Consistent with strong trapping being associated with incomplete activation, saturating the receptor with the partial agonist kainate also promoted trapping (data not shown; see Discussion). We obtained similar results by oxidizing with 5,5′-dithiobis-(2-nitro-benzoic acid) (DTNB) in the presence of heavy metal chelators (Figure S6), demonstrating that the absence of trapping at high glutamate concentrations is not due to copper chelation and consequent loss of oxidizing activity. The inhibitory effect of DTNB was less strong than that of CuPhen, leading to a smaller rightward shift in the glutamate concentration response curve. The weak action of DTNB is unsurprising given that it is approximately twice as bulky as phenanthroline and that the interdimer region is closely packed. Poor access of DTNB to the cysteines at position 665 probably results in a mixed population of receptors with reduced and intact crosslinks (Gielen et al., 2008).
Zinc bridging between subunits inhibited the HHH mutant with an apparent affinity of 95 ± 30 nM (Figure 6A). We exploited multi-barrel fast perfusion to assess the state dependence of this zinc bridging in the HHH mutant. Consistent with the structure of the full-length receptor, we could not detect inhibition due to zinc bridging at rest, and zinc alone did not activate a current in the presence of CTZ (n = 6 patches). No inhibition was seen following desensitizing exposures (100 μM glutamate without CTZ), at rest or after full activation (10 mM glutamate with CTZ). However, robust voltage-independent trapping was observed following exposure to 500 μM glutamate (Figures 6B and 6C). This inhibition was absent from WT GluA2 in equivalent conditions (Figure 6D). The lack of inhibition at high glutamate concentration was not due to chelation of zinc into zinc-glutamate complexes because we still observed robust inhibition when the patches were washed with 1 μM zinc, 500 μM L-glutamate, and 9,500 μM D-glutamate, which barely activates the receptor but should chelate zinc equally well. The glutamate dependence of trapping was similar to that of the A665C mutant, with a maximum extent of trapping at 348 μM glutamate (Figure 6E). Thus, the zinc-binding site created by the HHH mutant, which was suggested by the crosslinked crystal structure, also traps a partially bound state and does so with more specificity than the A665C mutant. Structural modeling of the HHH mutant built using our LBD tetramer structure, where only residues 436–440 and 455–457 (those flanking the HHH substitutions) were repositioned using energy minimization, shows that a zinc ion can be cradled by the three histidines (Figure 6F). The repositioned residues all lie in loop regions, and the rmsd measured at the Cα atoms of these residues is only 0.75 Å. These observations constitute strong evidence that the crystallized CA conformation occurs in the full-length receptor when some, but not all, of the ligand-binding sites are occupied by glutamate.
Figure 6. State Dependence of Lobe 1 Metal Sites.

(A) The half-maximal inhibitory concentration of zinc for the mutant G437H-K439H-D456H (HHH, yellow circles) was 95 ± 30 nM (n = 4).
(B) Voltage-independent inhibition by zinc (Zn2+; 1 μM, red bar) at intermediate glutamate concentration (500 μM, −60 and +60 mV) is shown. The lower dashed line shows the average size of the control responses to 10 mM glutamate in EDTA (green bars). The lower trace shows a mono-exponential fit to trapping relaxation (red circles, τ = 220 ms) and the slow component of a double exponential fit to current in EDTA (green bar) following trapping (green circles, loss of zinc trapping, τ = 550 ms; amplitude 33%).
(C) State dependence of inhibition by 1 μM zinc (n = 3–6 patches per point). Zinc preferentially traps a partially glutamate-bound state (yellow, 500 μM Glu + CTZ).
(D) WT receptors are not trapped by 1 μM zinc in the presence of 500 μM Glu plus CTZ.
(E) Concentration-response curves in 1 μM zinc and 100 μM CTZ for WT GluA2 (blue open circles; EC50 = 140 ± 10 μM), GluA2 HHH before trapping by zinc (green triangles; EC50 = 230 ± 27 μM), and GluA2 HHH following trapping (red squares; EC50 = 424 ± 30 μM). The difference between the apparent affinities for glutamate in the presence and absence of zinc was significant (p<0.01). Plotting the active fraction current after trapping (yellow diamonds) versus glutamate concentration reveals maximal trapping at 368 μM glutamate (n = 3).
(F) Top view of the CA conformation of the LBD tetramer modeled with two interdimer triple-histidine mutants coordinating zinc ions is presented. The right panel shows the boxed region from the left panel on an expanded scale.
Structural modeling was pursued to examine possible consequences of OA-to-CA conformational transitions that occur in conjunction with LBD closure in subunits B and D on ion channel pore opening. First, the closure of subunits B and D in the crystal structure of the crosslinked LBD tetramer was modeled by superimposing the structure of a closed, glutamate-bound LBD (PDB ID 1FTJ; chain A) (Armstrong and Gouaux, 2000) at helices D and J in lobe 1. Next, the TMD from the full-length GluA2 crystal structure was allowed to relax energetically to accommodate the LBDs (Figure S7). In this model, the inner transmembrane helices (M3) are predicted to widen at the ion channel gate between subunits B and D by ~11 Å, as measured between Cα atoms of T625. It should be noted that NMA was attempted with both the full-length GluA2 structure and the isolated TMD, but the ion channel gate could not be opened in either case, likely due to the tight network of residues around the gate.
DISCUSSION
Over 80 crystal structures of the isolated GluA2 LBD have been reported to date (Pøhlsgaard et al., 2011). These structures, in concert with biochemical and biophysical experiments, and molecular simulation studies, have characterized the processes of ligand binding and domain closure, which are directly linked to receptor activation (Armstrong and Gouaux, 2000; Dong and Zhou, 2011). Less is known, however, about the possible intersubunit conformational rearrangements in iGluR tetramers that could underlie ion channel gating. The only structural information to date linking the LBDs to the TM pore domain is the resting state arrangement captured in the crystal structure of the full-length receptor. Here, through a combination of structural, biochemical, and electrophysiological studies and computational modeling, we have identified a distinct LBD tetramer conformation that corresponds to an intermediate state of receptor activation. This state can be trapped by the A665C mutation, which forms a disulfide bridge between the A and C subunits. Our crystal structure predicts that we should also be able to bridge subunits A and B and subunits C and D in the CA conformation. Triple substitutions in lobe 1, such as the HHH mutant, confirm this prediction by forming zinc-binding sites that trap a state of intermediate activation. Zinc bridging with the HHH mutant does not trap antagonist-bound, fully active, and desensitized states, making it more state specific than the A665C crosslink. The difference in specificity could be explained by a greater separation of the constituents of the HHH site in the antagonist-bound and other states.
A depiction of the trapped state in the CA conformation within the context of proposed transitions between various stages of receptor activation is provided in Figure 7. The engineered metal trapping between the upper lobes is unexpected on the basis of existing structural information and is both geometrically and stereochemically distinct from previous unsuccessful attempts to find interdimer contacts (Horning and Mayer, 2004). The intermediate state that is trapped is likely to be unstable in WT receptors because there is no extensive interface between dimers. It is tempting to speculate that this lack of interface is an evolved property essential for the rapid kinetics of AMPA receptors, but NMDA receptors may differ (see below). Both the disulfide bridge and the metal bridges form interactions between LBD dimers, and both types of bridges functionally inhibit the receptor, perhaps because they hinder full domain closure, or perhaps because they restrain a conformational transition essential to receptor activation.
Figure 7. Proposed Structural Transitions Involved in AMPA Receptor Activation.
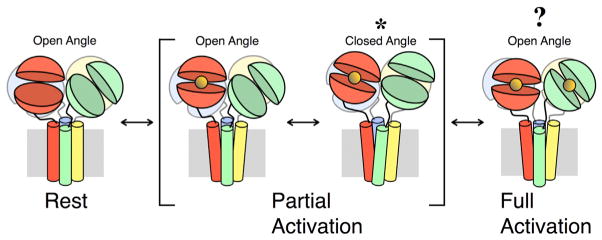
Subunits A, B, C, and D are colored green, red, blue, and yellow, respectively. The LBDs are arranged in the OA conformation when the receptor is in a state of rest. When the LBDs of subunits B and D bind glutamate (orange sphere), the receptor enters a state of partial activation. In this state, the LBDs may adopt either the OA or CA conformation. The conformation trapped by either the disulfide bridge formed by the A665C mutation or the metal bridge formed by one of the triple-residue mutations is indicated by an asterisk. When glutamate is bound to all LBDs, the receptor enters a state of full activation. We have no information about the LBD conformation in this state. It is unknown whether the ATD layer undergoes large-scale structural rearrangements during gating transitions, and it is therefore omitted from this figure. See also Figure S7 and Table S1.
Biochemical and electrophysiological measurements confirm that the A665C crosslink observed in the LBD tetramer crystal structure is redox sensitive in full-length receptors. The crosslink readily inhibits receptors during conformational transitions related to ion channel gating and selectively traps pairs of subunits. Consistent with the crystal structure of the full-length GluA2, in which the Cα atoms of A665 in subunits A and C are separated by 8.0 Å, crosslinking in the presence of antagonist (10 μM DNQX with the LBD dimers stabilized by CTZ) occurs very slowly (no effect within 30 s), if at all. This observation suggests that, in GluA2, disulfide bond formation at this site is a sensitive reporter of distances. Consistent with the functional studies, structural modeling of glutamate-bound LBDs into the tetramer as well as biochemical experiments also suggest that the A665C residues are too far apart for disulfide bond formation when the LBDs in subunits A and C are closed, such as when the receptor is saturated with agonist and not desensitized. This key observation explains why the CA activation intermediate was captured in the crystal even though the LBDs were occupied by DNQX: the A and C subunits must be held open for crosslinking, whereas the B and D subunits are free to close without disturbing the crosslink. The B and D subunits are therefore likely bound with agonist when the crosslink forms at C665 in the full-length receptor. Given the incomplete inhibition by oxidizing conditions, this partially glutamate-bound configuration probably allows ion conduction, consistent with the notion that closure of the B and D subunits alone is sufficient to activate the receptor (Das et al., 2010).
Several of our observations suggest that the A665C mutant can be trapped, albeit slowly, in other conformational states. Desensitization may promote disulfide bond formation when the receptor is saturated by glutamate, but the geometry of such a desensitized, crosslinked tetramer is expected to be different from that seen in our crystal structure in that the lobe 1 dimer interface would be ruptured (Armstrong et al., 2006). Trapping that we observed in the combined presence of kainate and CTZ suggests that the A665C site moves to a similar position seen in our crystal structure when a dimer is saturated with kainate as when one subunit in a dimer is occupied by glutamate. Stabilizing the LBDs in a nondesensitized, inactive conformation (DNQX plus CTZ) blocked trapping completely in functional experiments. In biochemical experiments, the degree of trapping in DNQX was not significantly different from that for either control (e.g., R661C) or A665C in 500 μM glutamate, suggesting the possibility that oxidizing exposures much longer than those relevant for channel gating could drive the receptor into a conformation resembling the crystallized CA conformation. However, the low signal-to-noise ratio of our biochemical experiments rules out any conclusive interpretation of these data.
The selective zinc inhibition of the four triple-substitution mutants that we report, including the HHH mutant, can only occur if lobes 1 of apposed LBD dimers approach sufficiently to create a metal-binding site. Forming this site requires a 16 Å translation of the upper lobes. To our knowledge, such a movement has not been previously documented in the literature. Because the composition and exact geometry of this site seem less important than the presence of three coordinating groups, inhibition due to some local distortion within individual domains seems unlikely. Relatively large OA-to-CA motions therefore occur between dimers as the receptor transitions from the resting state to the fully activated state. In NMDA receptors, loops 1 and 2 of the LBD are proposed to mediate interactions between glycine-binding GluN1 and glutamate-binding GluN2 subunits (Regalado et al., 2001). A CA-like conformation would allow loop 1 of each GluN2 subunit to contact GluN1 in the adjacent dimer, stabilize a partly bound LBD tetramer, and produce the apparent negative cooperativity of glycine and glutamate binding.
Both agonist occupancy of AMPA receptors (Rosenmund et al., 1998; Smith and Howe, 2000) and the average closure of their LBDs (Jin et al., 2003) control the amplitude of single-channel events, which in turn determines the charge transfer of synaptic currents. Interdimer translations (to reduce linker separation) and OA-to-CA transitions (to increase linker separation) present additional degrees of freedom that could be reflected in the complexity of AMPA receptor activation. Our recordings show that interdimer translation and rotation to the CA conformation occur preferentially when the receptor is partially glutamate bound. This intermediate conformation could contribute to the nonlinear increase in conductance with occupancy (Rosenmund et al., 1998), in which singly occupied receptors do not appreciably gate, and the single channel conductance for apparently doubly occupied receptors is small and noisy. AMPA receptors also exhibit gating modes that may involve the CA conformation (Prieto and Wollmuth, 2010). We are actively pursuing single-channel recordings from the mutant receptors described in this manuscript in order to probe these possibilities.
Activation intermediates have been detected functionally as sublevels in the AMPA receptor and as short-lived closed states in other neurotransmitter receptor families (Burzomato et al., 2004; Grosman et al., 2000; Mukhtasimova et al., 2009; Rosenmund et al., 1998). Here, we describe the molecular geometry underlying such a structurally distinct intermediate for a ligand-gated channel. Future experiments may address the intriguing possibility that the binding of additional glutamate molecules may drive the LBD layer into other structural arrangements that accompany either unitary events of higher amplitude or desensitization.
EXPERIMENTAL PROCEDURES
Protein Expression and Purification
The plasmid pET22b(+)GluR2S1S2J (Armstrong and Gouaux, 2000) used to express the GluA2 LBD protein was kindly provided by Eric Gouaux. This construct has eight histidines at the N terminus, followed by sites for thrombin and trypsin digestion. The L483Y and A665C mutations were introduced using the QuikChange Site-Directed Mutagenesis Kit (Agilent). The mutations were confirmed by DNA sequencing. The double-mutant protein was overexpressed in Origami B(DE3) cells (Novagen). The cells were disrupted using an Avestin EmulsiFlex homogenizer. The GluA2-L483Y-A665C protein was purified from the soluble fraction using a 5 ml HiTrap Chelating HP column (GE Healthcare) charged with nickel. The N-terminal histidine tag was removed by trypsin (Sigma-Aldrich) digestion.
Crystallization
The protein sample was dialyzed against 10 mM HEPES at pH 7.0, 20 mM NaCl, 1 mM EDTA, and 1 mM DTT using a 12–14 kDa molecular weight cutoff (MWCO) membrane to remove glutamate. The dialyzed sample was then adjusted to 10% glycerol. The protein was concentrated to 12 mg/ml using an Amicon Ultracentrifugal filter device (Millipore) with a 10 kDa MWCO. The final concentration of DNQX (Tocris Bioscience) added to the protein solution was 3 mM. Crystals were grown at 4°C in hanging drops containing a 1:1 (v/v) ratio of protein solution to reservoir solution. The crystallization buffer contained 19% PEG 1450, 300 mM lithium sulfate, and 100 mM sodium cacodylate at pH 6.5. The crystals were soaked in crystallization buffer supplemented with 10% glycerol and 3 mM DNQX prior to flash freezing in liquid nitrogen.
Structure Determination and Refinement
X-ray diffraction data were collected at the Advanced Photon Source (Argonne National Laboratory) at beamline 23-ID-D using a MARMOSAIC 300 CCD detector. A wavelength of 1.0332 Å was used. The temperature of the crystal was ~100 K. The data were indexed, integrated, and scaled using Mosflm and Scala from the CCP4 suite of programs (Potterton et al., 2003). The structure was solved by molecular replacement using Phaser (McCoy et al., 2007). The LBD-L483Y-DNQX dimer structure (PDB ID 1LB9) (Sun et al., 2002) was used as the search probe. Model building and crystallographic refinement were performed using Coot (Emsley et al., 2010) and PHENIX (Adams et al., 2010) until the R/Rfree values converged.
Structural Analysis and Molecular Modeling
The amount of domain closure in each LBD is determined according to two center-of mass distances ξ1 (between residues 479 and 481 in lobe 1 and residues 654 and 655 in lobe 2) and ξ2 (between residues 401 and 403 in lobe 1 and residues 686 and 687 in lobe 2) (Lau and Roux, 2007, 2011). A one-dimensional projection of these distances is ξ12 = (ξ1 + ξ2)/2.
Rigid body rotation of the LBD dimers was performed using CHARMM (Brooks et al., 2009). The model of how the LBD tetramer 2 conformation (see Table S1) might influence the ion channel gate was also generated using CHARMM. NMA was performed using the ANM server (Eyal et al., 2006).
For modeling of the zinc-binding sites, mutant histidine residues were built using SCWRL4, and the zinc ion was roughly centered between the side chains. The loop segments containing the histidines and the zinc were subjected to energy minimization with CHARMM, with the histidines and zinc restrained to be in close proximity. The rest of the model was held fixed.
Electrophysiology
The flip splice variant of GluA2 was used for electrophysiology studies. Mutants were generated using overlap PCR. The presence of the mutant codons was corroborated by double-stranded DNA sequencing of the amplified region. WT and mutant AMPA receptors were expressed by transient expression in HEK293 cells for outside-out patch recording. The external solution in all the experiments contained 150 mM NaCl, 0.1 mM MgCl2, 0.1 mM CaCl2, 5 mM HEPES, titrated to pH 7.3 with NaOH, to which we added different drugs either in oxidizing or reducing conditions. For metal-bridging experiments, we included either 1 μM zinc, or 2 mM EDTA to chelate trace divalent ions, and readjusted the pH to 7.3. Drugs were obtained from Tocris, Ascent Scientific, or Sigma-Aldrich. The CuPhen solution was made at 1:3 molar ratio (CuCl2 dissolved in water and 1,10-phenanthroline dissolved in EtOH) to obtain a final concentration of 10 μM. The pipette solution contained 115 mM NaCl, 10 mM NaF, 0.5 mM CaCl2, 1 mM MgCl2, 5 mM Na4BAPTA, 5 mM HEPES, and 10 mM Na2ATP (pH 7.3). All the patches were voltage clamped between −30 and −60 mV. Currents were filtered at 1–10 kHz (−3 dB cutoff, eight-pole Bessel) and recorded using Axograph X (Axograph Scientific) via an Instrutech ITC-18 interface (HEKA). The sampling rate was 20 kHz. The rate of onset of desensitization (kdes) was established by fitting a single exponential function to the decay in response to a long pulse of glutamate.
We applied drugs to outside patches via a perfusion tool made from custom-manufactured four-barrel glass (VitroCom). To measure the state dependence of trapping in oxidizing conditions, we determined the baseline for activation by 10 mM glutamate in the presence of 5 mM DTT (300 ms pulses at a frequency of 1 Hz). Following a brief (usually 1 s) pause for recovery from desensitization, oxidizing conditions (usually CuPhen, 10 μM) were applied via the third barrel of the perfusion tool, for 30 ms to 10 s (see Figure S4). To bias the receptor into particular states, we coapplied antagonist or different concentrations of glutamate (in the presence of 100 μM CTZ). After this treatment, we immediately monitored the percentage of current modified, and the recovery from trapping, by applying a pulse of 10 mM glutamate again in 1 mM DTT for 300 ms. We fitted the relaxation in 10 mM glutamate with a double exponential function. The fast component (time constant ≈ 1 ms) was the activation by glutamate, and the slow was the untrapping relaxation, which was absent in WT channels. Following coapplication of 10 μM DNQX and 10 μM CuPhen, we held the patch for 40 ms in the fourth barrel of our perfusion tool applying only normal solution in the presence of CTZ, in order to wash out the antagonist, before assessing the extent of trapping (Figure S4). We assessed the effects of modification by calculating the active fraction (Af):
where Islow is the amplitude of the slow component of the double exponential fit to the current immediately following CuPhen treatment, and Ipre is the peak current before treatment. The kinetics of trapping was analyzed by fitting a single exponential equation to the active fraction obtained at different times of exposure to CuPhen. To independently analyze the rate of modification, we fitted a single exponential equation to the current in the presence of 10 μM CuPhen and 500 μM glutamate. To assess state-dependent zinc bridging, we used similar protocols but held the patches in 2 mM EDTA to chelate all divalent ions and thus prevent bridging, and exposed them to 1 μM zinc to induce bridging. Trapping was assessed at +60 and −60 mV to ensure that it was voltage independent.
We measured concentration-response curves in the A665C mutant at the beginning of the application of oxidizing conditions (peak, when the receptors were still reduced) and in steady-state oxidizing conditions, when we assumed trapping was complete. We obtained the EC50 from fits to the Hill equation:
where n is the Hill coefficient, and [Glu] is glutamate concentration. We measured trapping after the application of CuPhen in different concentrations of glutamate, plotting the immediate active fraction of the current against different concentrations of glutamate. This was normalized against the current following oxidizing conditions plus 10 mM glutamate. A log normal function was fitted to the data.
Construction of a Receptor Lacking Free Cysteines
The GluA2 receptor contains 11 cysteines, 4 of them involved in disulfide bonds (C63 with C315 and C718 with C773C). In order to obtain a construct running monomerically under denaturing conditions, we serially removed free cysteines, eventually constructing the 7 × Cys(−) mutant by introducing the following mutations into the GluA2 WT receptor: C89S, C190A, C436S, C425S, C528S, C589S, and C815S (Figure S3A). This channel remained functional and had similar properties to WT (Figure S3B). All cysteine mutants studied by western blotting were made on this background. All mutations were introduced by overlap PCR and confirmed by double-stranded sequencing.
Biochemistry
HEK293T cells were plated in 10 cm dishes and transfected with different plasmids (5 μg) using polyethylenimine (PEI; 1 mg/μl). After 72 hr, cells were collected in PBS, centrifuged 5 min at 1,000 × g, and pellets were resuspended in a buffer containing 300 mM NaCl, 50 mM Tris (pH 8), 1% DDM (Anatrace), and a protease inhibitor mixture (Roche). For treatments under reducing and oxidizing conditions, dishes were rinsed with PBS followed by incubation with 100 mM DTT or 100 μM CuPhen in serum-free medium for 30 min before lysis. After sonication, the lysates were rotated (10 rpm) for 1 hr at 4°C and subsequently centrifuged at 20,000 × g to obtain cleared lysates. Protein extracts (50 μg) were then separated by 4%–12% Bis-Tris Glycine SDS/PAGE and transferred to nitrocellulose membranes. Blots were immunostained overnight at 4°C, or for 5 hr at RT, with anti-GluA2 N terminus (1:1,000; Millipore) or anti-β-actin (1:2,000; Cell Signaling) primary antibodies. Following exposure to appropriate peroxidase-conjugated secondary antibodies (Biozol), blots were visualized with chemiluminescence reagent (Super-Signal West Pico; Thermo Scientific). Densitometric analysis was performed using ImageJ (Schneider et al., 2012). The signal from β-actin was used as a loading control, and the results were normalized as the ratio of dimer band intensity versus the total intensity of dimer and monomer bands. Statistical significance across conditions (one-way ANOVA) was assessed with Dunnett’s post hoc test in KaleidaGraph (Synergy Software).
Supplementary Material
Acknowledgments
We thank E. Gouaux for providing the GluR2-S1S2J plasmid; C. Ogata, K. Perry, and K. Rajashankar for providing helpful advice with X-ray diffraction data collection at APS; B. Ziervogel and B. Dhakshnamoorthy for assisting with data collection; J. Baranovic for comments on the manuscript; and M. Wietstruk for providing technical assistance. This work was funded by NIH grant GM094495 (to A.Y.L.), DFG grants EXC 257 (NeuroCure) and Pl-619 (to A.J.R.P.), and NIH grant GM062342 (to B.R.). H.S. is the recipient of a HFSP Long-Term Fellowship.
Footnotes
ACCESSION NUMBERS
The GluA2-L483Y-A665C atomic coordinates and structure factors reported in this paper have been deposited in the Protein Data Bank under ID code 4L17.
Supplemental Information includes seven figures, two tables, and Supplemental Experimental Procedures and can be found with this article online at http://dx.doi.org/10.1016/j.neuron.2013.06.003.
References
- Adams PD, Afonine PV, Bunkóczi G, Chen VB, Davis IW, Echols N, Headd JJ, Hung LW, Kapral GJ, Grosse-Kunstleve RW, et al. PHENIX: a comprehensive Python-based system for macromolecular structure solution. Acta Crystallogr D Biol Crystallogr. 2010;66:213–221. doi: 10.1107/S0907444909052925. [DOI] [PMC free article] [PubMed] [Google Scholar]
- Armstrong N, Gouaux E. Mechanisms for activation and antagonism of an AMPA-sensitive glutamate receptor: crystal structures of the GluR2 ligand binding core. Neuron. 2000;28:165–181. doi: 10.1016/s0896-6273(00)00094-5. [DOI] [PubMed] [Google Scholar]
- Armstrong N, Jasti J, Beich-Frandsen M, Gouaux E. Measurement of conformational changes accompanying desensitization in an ionotropic glutamate receptor. Cell. 2006;127:85–97. doi: 10.1016/j.cell.2006.08.037. [DOI] [PubMed] [Google Scholar]
- Brooks BR, Brooks CL, 3rd, Mackerell AD, Jr, Nilsson L, Petrella RJ, Roux B, Won Y, Archontis G, Bartels C, Boresch S, et al. CHARMM: the biomolecular simulation program. J Comput Chem. 2009;30:1545–1614. doi: 10.1002/jcc.21287. [DOI] [PMC free article] [PubMed] [Google Scholar]
- Burzomato V, Beato M, Groot-Kormelink PJ, Colquhoun D, Sivilotti LG. Single-channel behavior of heteromeric alpha1beta glycine receptors: an attempt to detect a conformational change before the channel opens. J Neurosci. 2004;24:10924–10940. doi: 10.1523/JNEUROSCI.3424-04.2004. [DOI] [PMC free article] [PubMed] [Google Scholar]
- Campos FV, Chanda B, Roux B, Bezanilla F. Two atomic constraints unambiguously position the S4 segment relative to S1 and S2 segments in the closed state of Shaker K channel. Proc Natl Acad Sci USA. 2007;104:7904–7909. doi: 10.1073/pnas.0702638104. [DOI] [PMC free article] [PubMed] [Google Scholar]
- Das U, Kumar J, Mayer ML, Plested AJR. Domain organization and function in GluK2 subtype kainate receptors. Proc Natl Acad Sci USA. 2010;107:8463–8468. doi: 10.1073/pnas.1000838107. [DOI] [PMC free article] [PubMed] [Google Scholar]
- Dong H, Zhou HX. Atomistic mechanism for the activation and desensitization of an AMPA-subtype glutamate receptor. Nat Commun. 2011;2:354. doi: 10.1038/ncomms1362. [DOI] [PMC free article] [PubMed] [Google Scholar]
- Echeverria Riesco I. PhD thesis. Johns Hopkins University; Baltimore: 2011. Estimation of free energy differences from computed work distributions, molecular dynamics simulations, and normal modes analysis studies. [Google Scholar]
- Emsley P, Lohkamp B, Scott WG, Cowtan K. Features and development of Coot. Acta Crystallogr D Biol Crystallogr. 2010;66:486–501. doi: 10.1107/S0907444910007493. [DOI] [PMC free article] [PubMed] [Google Scholar]
- Eyal E, Yang LW, Bahar I. Anisotropic network model: systematic evaluation and a new web interface. Bioinformatics. 2006;22:2619–2627. doi: 10.1093/bioinformatics/btl448. [DOI] [PubMed] [Google Scholar]
- Gielen M, Le Goff A, Stroebel D, Johnson JW, Neyton J, Paoletti P. Structural rearrangements of NR1/NR2A NMDA receptors during allosteric inhibition. Neuron. 2008;57:80–93. doi: 10.1016/j.neuron.2007.11.021. [DOI] [PMC free article] [PubMed] [Google Scholar]
- Grosman C, Zhou M, Auerbach A. Mapping the conformational wave of acetylcholine receptor channel gating. Nature. 2000;403:773–776. doi: 10.1038/35001586. [DOI] [PubMed] [Google Scholar]
- Horning MS, Mayer ML. Regulation of AMPA receptor gating by ligand binding core dimers. Neuron. 2004;41:379–388. doi: 10.1016/s0896-6273(04)00018-2. [DOI] [PubMed] [Google Scholar]
- Jin R, Banke TG, Mayer ML, Traynelis SF, Gouaux E. Structural basis for partial agonist action at ionotropic glutamate receptors. Nat Neurosci. 2003;6:803–810. doi: 10.1038/nn1091. [DOI] [PubMed] [Google Scholar]
- Lainé M, Lin MC, Bannister JPA, Silverman WR, Mock AF, Roux B, Papazian DM. Atomic proximity between S4 segment and pore domain in Shaker potassium channels. Neuron. 2003;39:467–481. doi: 10.1016/s0896-6273(03)00468-9. [DOI] [PubMed] [Google Scholar]
- Lau AY, Roux B. The free energy landscapes governing conformational changes in a glutamate receptor ligand-binding domain. Structure. 2007;15:1203–1214. doi: 10.1016/j.str.2007.07.015. [DOI] [PMC free article] [PubMed] [Google Scholar]
- Lau AY, Roux B. The hidden energetics of ligand binding and activation in a glutamate receptor. Nat Struct Mol Biol. 2011;18:283–287. doi: 10.1038/nsmb.2010. [DOI] [PMC free article] [PubMed] [Google Scholar]
- Mayer ML. Emerging models of glutamate receptor ion channel structure and function. Structure. 2011;19:1370–1380. doi: 10.1016/j.str.2011.08.009. [DOI] [PMC free article] [PubMed] [Google Scholar]
- McCoy AJ, Grosse-Kunstleve RW, Adams PD, Winn MD, Storoni LC, Read RJ. Phaser crystallographic software. J Appl Crystallogr. 2007;40:658–674. doi: 10.1107/S0021889807021206. [DOI] [PMC free article] [PubMed] [Google Scholar]
- Mukhtasimova N, Lee WY, Wang HL, Sine SM. Detection and trapping of intermediate states priming nicotinic receptor channel opening. Nature. 2009;459:451–454. doi: 10.1038/nature07923. [DOI] [PMC free article] [PubMed] [Google Scholar]
- Plested AJR, Mayer ML. AMPA receptor ligand binding domain mobility revealed by functional cross linking. J Neurosci. 2009;29:11912–11923. doi: 10.1523/JNEUROSCI.2971-09.2009. [DOI] [PMC free article] [PubMed] [Google Scholar]
- Pøhlsgaard J, Frydenvang K, Madsen U, Kastrup JS. Lessons from more than 80 structures of the GluA2 ligand-binding domain in complex with agonists, antagonists and allosteric modulators. Neuropharmacology. 2011;60:135–150. doi: 10.1016/j.neuropharm.2010.08.004. [DOI] [PubMed] [Google Scholar]
- Potterton E, Briggs P, Turkenburg M, Dodson E. A graphical user interface to the CCP4 program suite. Acta Crystallogr D Biol Crystallogr. 2003;59:1131–1137. doi: 10.1107/s0907444903008126. [DOI] [PubMed] [Google Scholar]
- Prieto ML, Wollmuth LP. Gating modes in AMPA receptors. J Neurosci. 2010;30:4449–4459. doi: 10.1523/JNEUROSCI.5613-09.2010. [DOI] [PMC free article] [PubMed] [Google Scholar]
- Regalado MP, Villarroel A, Lerma J. Intersubunit cooperativity in the NMDA receptor. Neuron. 2001;32:1085–1096. doi: 10.1016/s0896-6273(01)00539-6. [DOI] [PubMed] [Google Scholar]
- Rosenmund C, Stern-Bach Y, Stevens CF. The tetrameric structure of a glutamate receptor channel. Science. 1998;280:1596–1599. doi: 10.1126/science.280.5369.1596. [DOI] [PubMed] [Google Scholar]
- Schneider CA, Rasband WS, Eliceiri KW. NIH Image to ImageJ: 25 years of image analysis. Nat Methods. 2012;9:671–675. doi: 10.1038/nmeth.2089. [DOI] [PMC free article] [PubMed] [Google Scholar]
- Smith TC, Howe JR. Concentration-dependent substate behavior of native AMPA receptors. Nat Neurosci. 2000;3:992–997. doi: 10.1038/79931. [DOI] [PubMed] [Google Scholar]
- Sobolevsky AI, Rosconi MP, Gouaux E. X-ray structure, symmetry and mechanism of an AMPA-subtype glutamate receptor. Nature. 2009;462:745–756. doi: 10.1038/nature08624. [DOI] [PMC free article] [PubMed] [Google Scholar]
- Sun Y, Olson R, Horning M, Armstrong N, Mayer M, Gouaux E. Mechanism of glutamate receptor desensitization. Nature. 2002;417:245–253. doi: 10.1038/417245a. [DOI] [PubMed] [Google Scholar]
- Tama F, Sanejouand YH. Conformational change of proteins arising from normal mode calculations. Protein Eng. 2001;14:1–6. doi: 10.1093/protein/14.1.1. [DOI] [PubMed] [Google Scholar]
- Temiz NA, Meirovitch E, Bahar I. Escherichia coli adenylate kinase dynamics: comparison of elastic network model modes with mode-coupling (15)N-NMR relaxation data. Proteins. 2004;57:468–480. doi: 10.1002/prot.20226. [DOI] [PMC free article] [PubMed] [Google Scholar]
- Traynelis SF, Wollmuth LP, McBain CJ, Menniti FS, Vance KM, Ogden KK, Hansen KB, Yuan H, Myers SJ, Dingledine R. Glutamate receptor ion channels: structure, regulation, and function. Pharmacol Rev. 2010;62:405–496. doi: 10.1124/pr.109.002451. [DOI] [PMC free article] [PubMed] [Google Scholar]
- Turski L, Huth A, Sheardown M, McDonald F, Neuhaus R, Schneider HH, Dirnagl U, Wiegand F, Jacobsen P, Ottow E. ZK200775: a phosphonate quinoxalinedione AMPA antagonist for neuroprotection in stroke and trauma. Proc Natl Acad Sci USA. 1998;95:10960–10965. doi: 10.1073/pnas.95.18.10960. [DOI] [PMC free article] [PubMed] [Google Scholar]
- Weston MC, Schuck P, Ghosal A, Rosenmund C, Mayer ML. Conformational restriction blocks glutamate receptor desensitization. Nat Struct Mol Biol. 2006;13:1120–1127. doi: 10.1038/nsmb1178. [DOI] [PubMed] [Google Scholar]
- Zheng W, Brooks BR, Thirumalai D. Low-frequency normal modes that describe allosteric transitions in biological nanomachines are robust to sequence variations. Proc Natl Acad Sci USA. 2006;103:7664–7669. doi: 10.1073/pnas.0510426103. [DOI] [PMC free article] [PubMed] [Google Scholar]
Associated Data
This section collects any data citations, data availability statements, or supplementary materials included in this article.