Abstract
To test the hypothesis that aging impairs endothelial cell response to glucose stress, we utilized a human umbilical vein endothelial cell in vitro model in which clinically relevant concentrations of normal (5.5mM), high (25mM), and low (1.5mM) glucose were tested. With advancing population doubling, exposure to normal glucose gradually decreased endothelial nitric oxide synthase expression and activity, resulting in slow, progressive development of markers of cell senescence (by population doubling level [PDL] 44). High or low glucose treatment accelerated the appearance of markers of senescence (by ~PDL 35) along with declines in endothelial nitric oxide synthase expression and activity. Human umbilical vein endothelial cells exposed to alternating low and high glucose gave even more rapid acceleration in the appearance of markers of senescence (by ~PDL 18) and reduction in endothelial nitric oxide synthase levels. Thus, exposure to low and high glucose induces earlier appearance of markers of endothelial cell senescence and dysregulation of the nitric oxide synthase gene and protein expression and function. These findings will help to elucidate endothelial dysfunction associated with glucose intolerance and improve future therapy for diabetic seniors.
Key Words: Endothelial cell senescence, Low glucose, High glucose.
Cardiovascular disease is widely recognized to increase in both prevalence and incidence with advancing age (1,2). Chronic hyperglycemia results in pathophysiology that resembles accelerated aging in a number of aspects and further increases the risk of cardiovascular disease, especially among the elderly patients. Diabetes has reached epidemic proportions in the United States, including 10.9 million people or 26.9% of those who are 65 years and older, and patients with hyperglycemia are at increased risk for microvascular and macrovascular complications (3,4). The benefit of glycemic control in reducing the risk for microvascular disease is well established. The possibility of hypoglycemia occurring in the tight glycemic management among the elderly patients is high and its role as a risk factor for cardiovascular events is a topic of increasing interest (5–8).
Homeostatic control is generally diminished with advancing age (1,2), including the regulation of glucose metabolism that is reflected by the declining glucose tolerance in seniors (9,10). Both aging and hyperglycemia are associated with endothelial dysfunction, vascular stiffening, and remodeling, as well as reduced nitric oxide function and impaired vasomotor control (11–14).
One process that has been increasingly linked with both aging and hyperglycemia and the development of vascular pathologies is the phenomenon of cellular senescence (15,16). More recently, it has been realized that the response of early replicative senescence can also be induced by a number of stress stimuli, especially by those causing intracellular oxidative stress. The process has been given a variety of names including “stress-induced premature senescence” and “stress or aberrant signaling-induced senescence” (17). Increased numbers of senescent endothelial cells are found in the vasculature of seniors, mature atherosclerotic plaques, vessels from younger adult diabetic patients, coronary vessels of patients with ischemic heart disease, and hypertensive patients. These findings suggest that the senescence of vascular cells likely contributes to a reduction of vasomotor control and age-related vascular diseases (18).
Endothelial cell function is essential for the homoeostasis of the vascular system. Due to its unique position in the vessel wall, the endothelium acts as a barrier and serves as the primary sensor and mediator of blood flow-mediated vasomotor control (19,20). Nitric oxide, produced by endothelial nitric oxide synthase (eNOS), is a key signaling molecule in vascular homeostasis and is an important regulator of vascular tone and arterial pressure. Loss of nitric oxide bioavailability is a cardinal feature of endothelial dysfunction and is an independent predictor of increased cardiovascular disease risk (21–23). Furthermore, external stress stimuli such as hyperglycemia have been shown to raise the expression and activity of inducible NOS (iNOS) (24), which is associated with excessive production of nitric oxide and leads to increased cellular damage. Advanced age and hyperglycemia have been shown to be associated with impaired basal eNOS and enhance endothelial dysfunction (25–27). The disappointing results of recent clinical trials of tight glycemic control in seniors with type 2 diabetes highlight the potential cardiovascular risks of hypoglycemia and hyperglycemia (28–31).
In the present study, we tested the hypothesis that cellular aging reduces the endothelial cell’s ability to respond to glucose stress and that alternating levels of elevated and low glucose may further accelerate cellular senescence. We observed that exposure to low and/or high glucose induced the premature appearance of markers of cellular senescence and dysregulation of NOS.
Materials and Methods
Endothelial Cell Culture
Human umbilical vein endothelial cells (HUVECs) were obtained from Lonza (Clonetics, Walkersville, MD) as pooled primary cell lines and cultured as previously described (32–34). HUVECs were cultured in BD Falcon 75-cm2 flasks, containing EGM-2 bullet kits supplemented with 5% heat irradiated fetal bovine serum (Lonza). Cell cultures were incubated at 37°C in 5% CO2. Primary cultures received new medium 24 hrs after seeding and were subcultured upon reaching 80% confluence by the use of 0.25% trypsin-EDTA, inactivated by trypsin neutralizing solution (Lonza). Population doubling levels (PDLs) were estimated at each passage using the following equation: n = (log2 X – log2 Y, where n = PDL, X = number of cells at the end of one passage, Y = number of cells that were seeded at the beginning of one passage; see Supplementary Material 1).
Glucose Stress
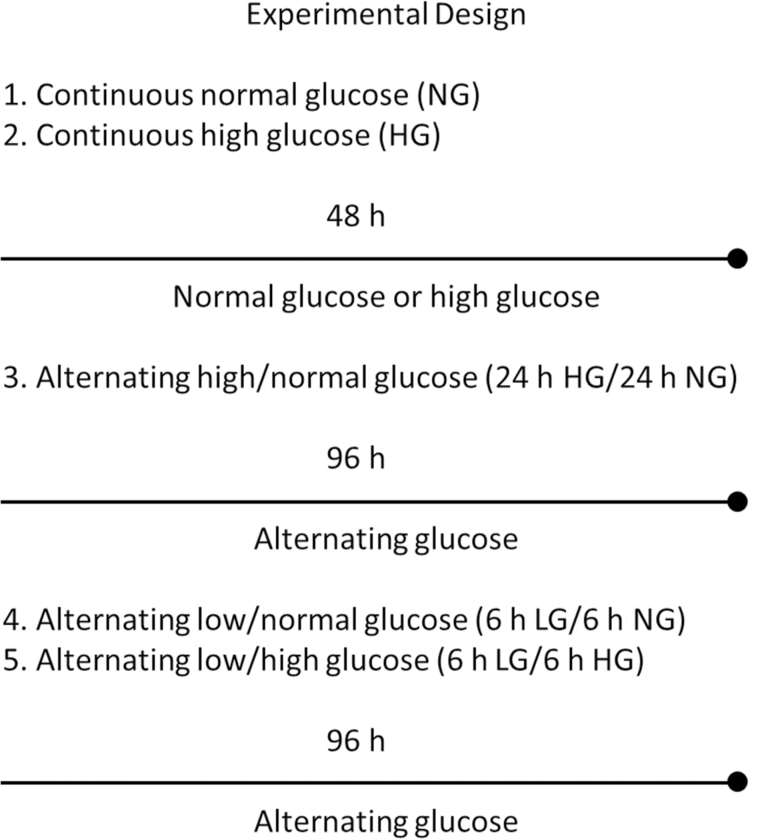
The following clinically relevant glucose concentrations were tested in varying exposures: normal (100mg/dL or 5.5mM), high (450mg/dL or 25mM), and low (30mg/dL or 1.5mM). Experimental groups (Figure 1) included early through late passage HUVECs treated with (i) continuous normal (5.5mM), (ii) continuous high (25mM) glucose, (iii) alternating glucose (normal and high), (iv) alternating low (1.5mM)/normal glucose (low and normal), and (v) alternating low and high glucose (low and high). For simulating hyperglycemia and/or hypoglycemia exposure, early (PDL 6–8) through late (PDL 44±2) passage cells were incubated in 25mM high glucose for 48 hrs and compared with that of normal glucose control cells at the respective PDLs (see Supplementary Material 1).
Figure 1.
Glucose treatment protocol. This figure shown illustrates the duration and concentration levels used for all glucose experimental groups tested in this study. The following clinically relevant glucose concentrations were used: normal (100mg/dL or 5.5mM), high (450mg/dL or 25mM), and low (30mg/dL or 1.5mM). Human umbilical vein endothelial cells were incubated at 37°C in 5% CO2 and grown in T-75 flasks. The experimental values for all tested groups were obtained from four repeated cultures (in parallel) of endothelial cells from early (population doubling level [PDL] 6) to late (PDL 44) passage. ■ = % Senescence, ▲ = population doubling rate (PDL/d).
Senescence-Associated Beta-Galatosidase Staining
To visualize a marker of cellular senescence, in vitro staining for senescence-associated beta-galatosidase (SA-β-gal) was performed using a commercial kit from Cell Signaling Technology (Boston, MA), designed to detect β-galactosidase activity at pH 6, a known characteristic of senescent cells that is usually not found in presenescent, quiescent, or immortal cells (35) (see Supplementary Material 1).
Western Blotting
Western blotting of the cell lysates was conducted as performed previously in our lab (36,37). In brief, the cells were lysed in a lysis buffer (10mM Tris, pH 7.4, 100mM NaCl, 1mM EDTA, 1mM ethylene glycol tetraacetic acid, 1% Triton X-100, 10% glycerol, and 0.1% sodium dodecyl sulfate) supplemented with 1× protease inhibitor cocktail (Sigma-Aldrich, St Louis, MO). Proteins were denatured in Laemmli sample buffer for 5 minutes at 95°C and resolved by Mini-PROTEAN TGX gels (Bio-Rad, Hercules, CA). Following electrophoresis, western protocol was adjusted based on Licor In-Gel detection instructions (Lincoln, NE). The gel was incubated with gentle shaking in 50% isopropanol + 5% acetic acid (prepared with ultrapure water) for 15 minutes (Sigma-Aldrich). Fixative solution was removed and gel was washed in ultrapure water for 15 minutes with gentle shaking. Primary antibodies (p16INK-4a, AKT, p-AKT, iNOS, eNOS, and p-eNOS) were diluted in Licor Odyssey Buffer with 0.1% Tween 20 (see Supplementary Material 1).
Total RNA Isolation
Total cellular RNA was extracted from cells using the RNeasy kit (Qiagen, Valencia, CA) in accordance with the manufacturer’s recommendations for mammalian cells. RNA with a high RNA integrity number and an A260 to A280 absorbance ratio ranging from 1.8 to 2.1 was utilized for cDNA synthesis.
Real-Time Reverse Transcription PCR Quantification of mRNA
To detect each mature mRNA of interest, the following primers were used: eNOS, forward primer: 5′-ccacaatcctggtgcgtc -3′ and reverse primer: 5′-gcctttttccagttgttcca-3; iNOS, forward primer: 5′- accagtacgtttggcaatggaga-3′ and reverse primer: 5′-gaaccgagggtacatgctgga-3′; and AKT, forward primer: 5′-tgcccacacgcttactgaga-3 and reverse primer: 5′-caaagcagaggcggtcgt-3′. The GAPDH gene was used as an internal control: GAPDH forward: 5′-actctacccacggcaagttc-3′ and GAPDH reverse: 5′-tactcagcaccagcatcacc-3′. The expression of GAPDH mRNA was tested in all glucose treatments and across all PDL time points, and it was confirmed that GAPDH mRNA was unchanged throughout all the groups (see Supplementary Material 1).
Results
Effects of High and Low Glucose on SA-β-gal Positive HUVECs
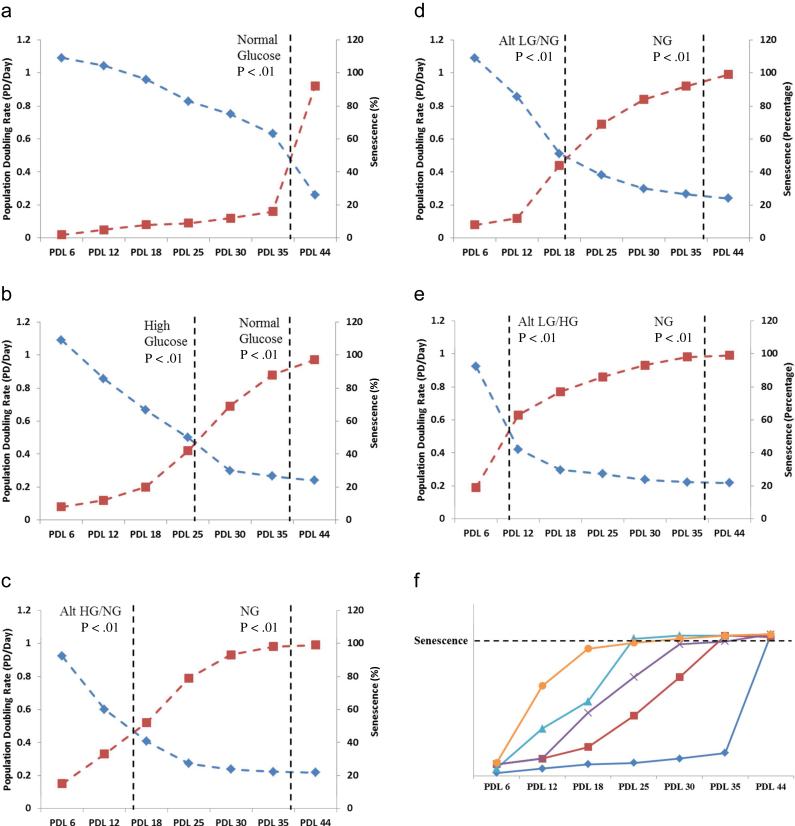
When staining for the presence of SA-β-gal in HUVECs treated with varying glucose exposures (Figure 1), we observed a general downward shift in the appearance of markers of cell senescence to an earlier population doubling point at which replicative senescence approaches 100%. The magnitude of this shift was found to be dependent upon the type and duration of the elevated or reduced glucose level exposure, with no major differences found among any treatment groups at the earliest and latest HUVEC passages. In early passage (PDL 6) HUVECs, appearance of markers of cellular senescence activity showed no significant difference among all normal (5mM), high (25mM), and low (1.5mM) glucose exposed treatment groups: normal glucose 4% ± 2, high glucose 8% ± 4, alternating high and normal glucose 9% ± 4, high glucose and normal glucose 8% ± 3, alternating low and normal glucose 8% ± 2, and alternating low and high glucose 10% ± 5. Elevated glucose significantly increased SA-β-gal activity, 88% ± 6, in PDL 35 HUVECs compared with the 9% ± 2 normal glucose PDL 35 control group. Alternating high and normal glucose was found to accelerate senescence to a significantly earlier PDL, from 44 to 25, with a percent SA-β-gal activity of 86% ± 6 compared with 7% ± 3 in normal glucose PDL 25 controls. Alternating low and normal glucose exposure induced earlier appearance of markers of senescence to 84% ± 5 in HUVECs at PDL 30 compared with 12% ± 6 in the normal glucose PDL 30 control group. Lastly, HUVECs exposed to alternating low and high glucose were shown to manifest accelerated appearance of senescence markers most dramatically, with 81% ± 4 SA-β-gal activity at PDL 18, compared with only 7% ± 3 in the normal glucose PDL 18 control group (Figure 2a–e).
Figure 2.
Senescence and proliferation rate profiles of human umbilical vein endothelial cells (HUVECs) exposed to high and/or low glucose over time. The data show the senescence percentage of cells as verified by in vitro staining for senescence-associated beta-galatosidase performed using a commercial kit from Cell Signaling Technology. HUVECs were grown and glucose treated in 6-well plates and analyzed under a light microscope. Finally, 500 cells were counted and the percentage of blue staining senescent cells was determined. Population doubling levels (PDLs) were estimated at each passage using the following equation: n = (log2 X – log2 Y, where n = PDL, X = number of cells at the end of one passage, Y = number of cells that were seeded at the beginning of one passage). The growth rate of HUVECs was calculated in early through late passage (senescent) cell cultures as the number of hours per PDL. (a) Normal glucose (NG) control. (b) High glucose (HG). (c) Alternating high and normal glucose. (d) Alternating low and normal glucose. (e) Alternating low and high glucose. (f) Graph shows point of senescence relative to population doubling time among all glucose treatment groups. ◊ = NG, ■ = HG, X = Alt HG/NG, ▲ = Alt LG/NG, ● = Alt LG/HG.
Influence of Glucose Stress on Cell Proliferation Rates Over Time
The HUVEC proliferation rates also showed a similar general downward shift in the population doubling point toward earlier PDLs in which cell proliferation progressively slowed toward complete growth arrest. Again, the profile of this shift was found to be dependent upon the type and duration of glucose level exposure, with no major differences found among all treatment groups at the earliest and last passage HUVECs. Early passage endothelial cells (PDL 6) showed no statistical difference in proliferation rates (hours per population doubling) among all normal, high, and low glucose treatment groups: normal glucose 22 hrs ± 2, high glucose 22 hrs ± 4, alternating high glucose 26 hrs ± 4, alternating low and normal glucose 22 hrs ± 2, and alternating low and high glucose 25 hrs ± 5. At PDL 35, both normal and high glucose exposed HUVECs showed a significant decrease in proliferation rate compared with that of the early passage normal glucose control group. Normal glucose HUVECs at PDL 35 gave a rate of 36h/PDL, whereas high glucose exposed PDL 35 endothelial cells showed a significantly lower rate of 90h/PDL (p < .01). Before complete replicative senescence (growth arrest), late passage HUVECs at PDL 44 were found to have significantly lower proliferation rates in both normal and high glucose treatment groups compared with that of the early passage control. Normal glucose PDL 44 group was shown to have a proliferation rate of 92 hrs and high glucose HUVECs at this same PDL were significantly slower, with a rate of 103h/PDL (Figure 2a–e).
p16INK-4a Protein Expression in Early and Late Passage HUVECs Exposed to Glucose Stress
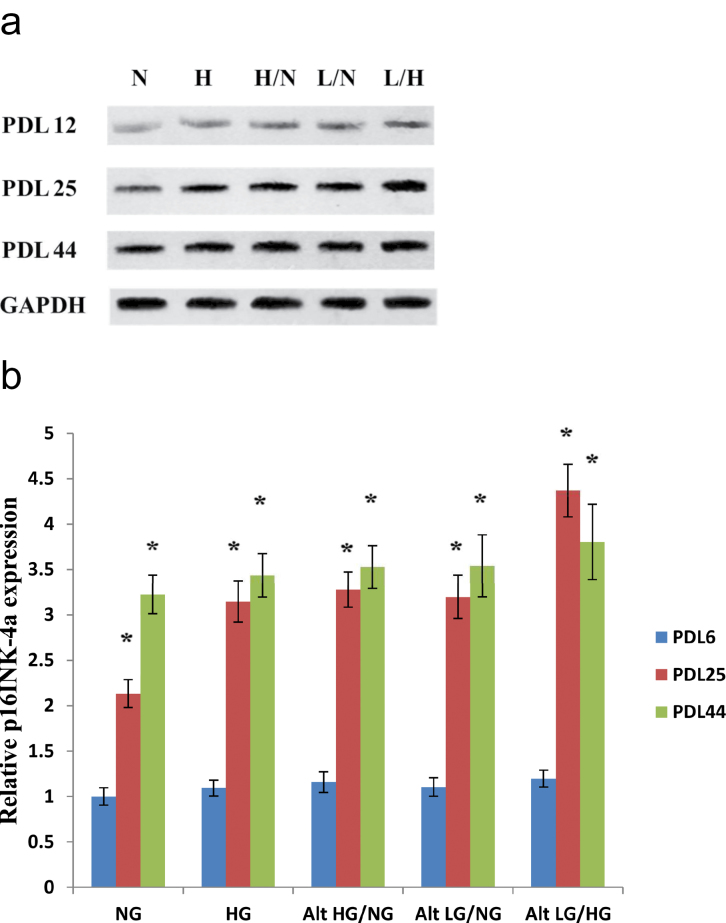
To further examine changes in markers of cellular senescence in response to glucose stress (both high and low concentrations), we analyzed the protein expression of p16INK-4a in early through late passage HUVECs. Figure 3a and b shows the change in expression levels for PDL 12, PDL 25, and PDL 44 HUVECs exposed to glucose stress. Normal glucose control cells at PDL 12 showed very little expression of p16INK-4a, whereas HUVECs of the same PDL, exposed to high and/or low glucose, displayed a small but significant increase in expression levels. HUVECs exposed to normal glucose at PDL 25 showed a slight increase in p16INK-4a compared with that of earlier passage control cells. Furthermore, endothelial cells exposed to all tested glucose treatments showed significant increases in p16INK-4a protein expression. Late passage (PDL 44) HUVECs showed significant increases in protein expression of p16INK-4a compared with that of PDL 12 and PDL 25 endothelial cells.
Figure 3.
Protein expression of p16INK-4a in response to glucose stress. Expression of p16INK-4a increases with population doubling levels (PDLs) in human umbilical vein endothelial cells (HUVECs). Low and high glucose enhances upregulation of p16INK-4a protein expression in endothelial cells at PDL 25. HUVECs were incubated with each of the previously described glucose treatments at the indicated PDL time points. (a) Western blot analyses of p16INK-4a protein were performed with 20 μg of cell lysate. (b) Relative p16INK-4a protein expression was quantified by densitometric analysis associated with Licor Odyssey software (data are normalized against GAPDH and expressed as means ± SE). Data are presented as means ± SE in four experiments. *p < .05, significantly different from control HUVECs cultured in the absence of high glucose.
Analysis of Protein Expression in Early and Late Passage HUVECs Exposed to Glucose Stress
The initial Western blotting experiments were conducted to examine whether early and/or late passage HUVECs exposed to temporary (48 hrs) high glucose would demonstrate changes in regulation of AKT, p-AKT (threonine 308), iNOS, eNOS, and the active form of eNOS, p-eNOS (serine 1177) compared with that in endothelial cells exposed to normal glucose. Additional studies were performed to determine whether this regulatory change in protein expression would persist following glucose normalization and/or alternating high and low glucose exposure.
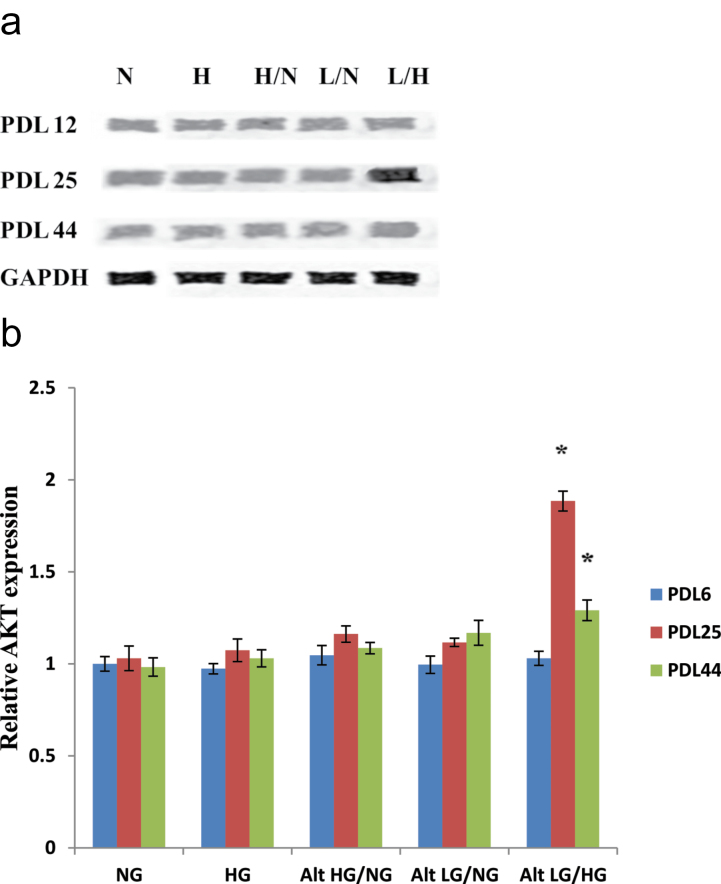
Protein expression of AKT was found to be statistically unchanged among all the tested glucose treatments in both early and late passage HUVECs as seen in Figure 4a and b. However, in PDL 25 endothelial cells, AKT expression was markedly increased in response to alternating low and high glucose exposure. AKT protein expression in PDL 25 HUVECs was also slightly increased following treatment with alternating high and normal and alternating low and normal glucose.
Figure 4.
AKT protein expression of human umbilical vein endothelial cells (HUVECs) exposed to high and/or low glucose. Alternating low and high glucose induces upregulation of AKT protein expression in endothelial cells at population doubling level (PDL) 25. HUVECs were incubated with each of the previously described glucose treatments at the indicated PDL time points. (a) Western blot analyses of AKT expression were performed with 20 μg of cell lysate. (b) Relative AKT protein expression was quantified by densitometric analysis associated with Licor Odyssey software (data are normalized against GAPDH and expressed as means ± SE). Data are presented as means ± SE in four experiments. *p < .05, significantly different from control HUVECs cultured in the absence of high glucose.
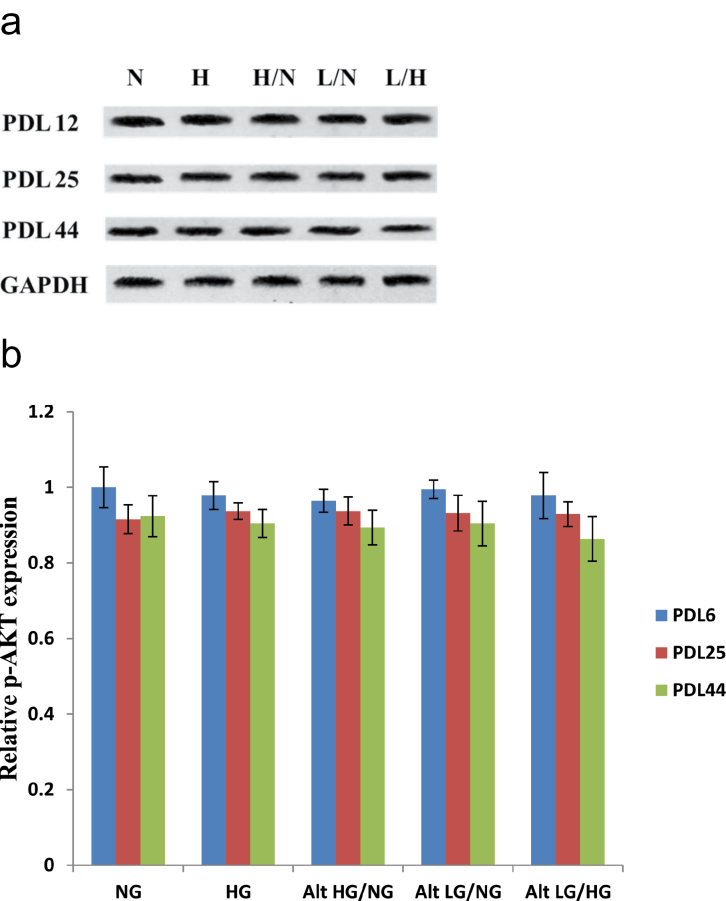
We also analyzed protein expression of threonine 308 phosphorylated AKT induced by in vitro cellular aging and glucose stress. Early passage HUVECs (PDL 12) show no significant difference in p-AKT protein expression among all glucose treatments and the control group. Similarly, no statistical difference was observed for p-AKT in PDL 25 and PDL 44 endothelial cells among all tested glucose treatment groups and the control. A slight overall decline in p-AKT protein expression was seen in PDL 25 and PDL 44 HUVECs compared with that of early passage (PDL 12) endothelial cells (Figure 5a and b).
Figure 5.
Protein expression analysis of phosphorylated AKT (Threonine 308) in high and/or low glucose exposed human umbilical vein endothelial cells (HUVECs). Phosphorylated AKT protein expression levels are slightly reduced in middle (population doubling level [PDL] 25) and late passage (PDL 44) compared with that of early, PDL endothelial cells. HUVECs were incubated with each of the previously described glucose treatments at the indicated population doubling time points. (a) Western blot analyses of p-AKT expression were performed with 20 μg of cell lysate. (b) Relative p-AKT protein expression was quantified by densitometric analysis associated with Licor Odyssey software (data are normalized against GAPDH and expressed as means ± SE). Data are presented as means ± SE in four experiments. *p < .05, significantly different from control HUVECs cultured in the absence of high glucose.
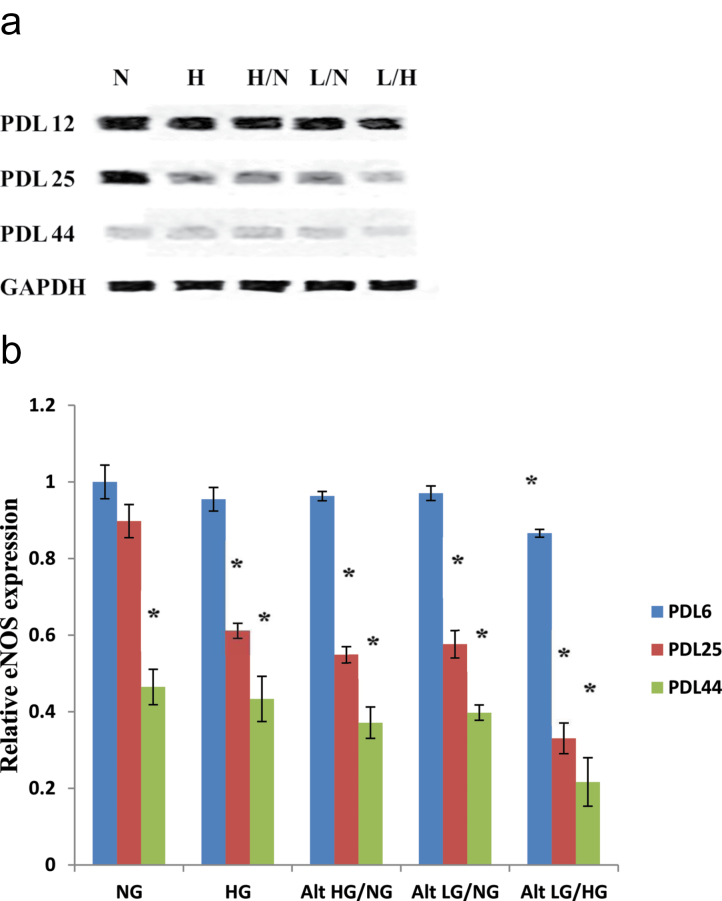
Total protein expression for eNOS was also measured in early through late passage endothelial cells (Figure 6a and b). In early passage (PDL 12) HUVECs, virtually all tested glucose treatments showed no significant difference in total eNOS protein expression, with alternating low and high glucose exposure producing a slight decline in eNOS levels. HUVECs exposed to normal glucose at PDL 25 showed no significant difference in eNOS levels compared with that of early passage PDL 12 normal glucose controls. However, endothelial cells treated with high and/or low glucose at PDL 25 displayed a significant decline in overall eNOS protein, evident in all glucose treatments as shown in Figure 6a and b. Interestingly, HUVEC exposure to alternating low and high glucose produced the greatest reduction in total eNOS levels compared with normal glucose controls. Lastly, late passage PDL 44 showed a similar trend as observed in PDL 25, with all glucose treatments resulting in greater significant reductions in eNOS protein expression compared with that of the early passage normal glucose controls.
Figure 6.
Total endothelial nitric oxide synthase (eNOS) protein expression in endothelial cells treated with high and/or low glucose. Progressive decline of eNOS protein levels is markedly enhanced as a result of high and/or low glucose exposure among human umbilical vein endothelial cells (HUVECs). Endothelial cells were incubated with each of the previously described glucose treatments at the indicated population doubling time points. (a) Western blot analyses of total eNOS expression were performed with 20 μg of cell lysate. (b) Relative eNOS protein expression was quantified by densitometric analysis associated with Licor Odyssey software (data are normalized against GAPDH and expressed as means ± SE). Data are presented as means ± SE in four experiments. *p < .05, significantly different from control HUVECs cultured in the absence of high glucose.
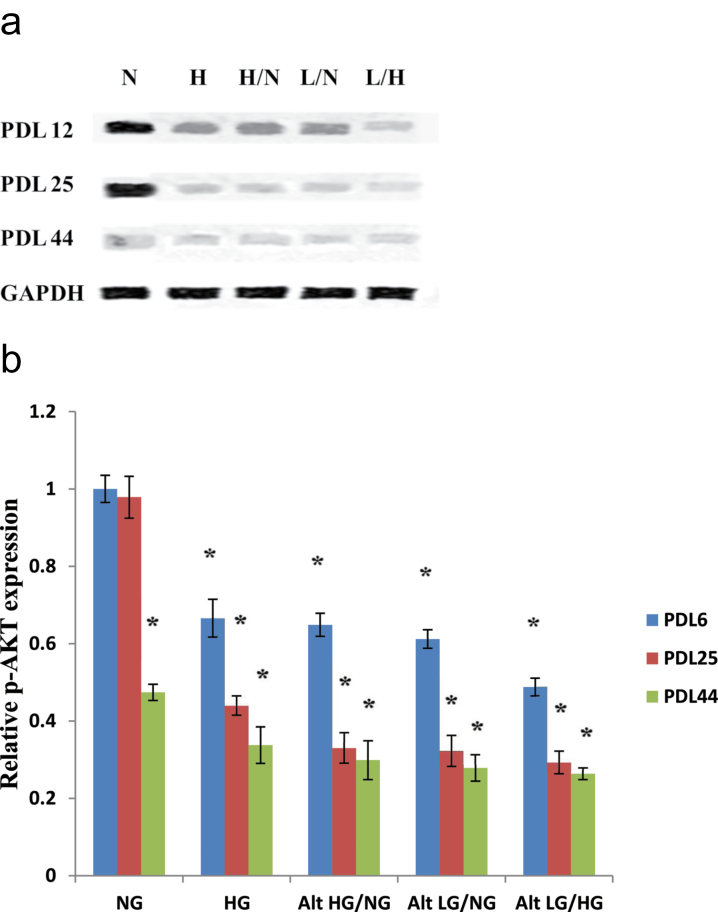
Next, we tested the differences in AKT-dependent phosphorylation of the serine 1177 eNOS site induced by in vitro cellular aging and elevated and reduced glucose levels. For early passage (PDL 12) HUVECs, we found a slight reduction of eNOS phosphorylation in high, alternating high and normal, and alternating low and normal glucose conditions compared with normal glucose PDL 12 controls (Figure 7a and b). HUVECs exposed to alternating low and high glucose were found to have an even greater reduction in p-eNOS levels at PDL 12. Endothelial cells exposed to normal glucose at PDL 25 showed no significant change in the level of p-eNOS protein expression compared with the early passage PDL 12 normal glucose control. However, all tested high and/or low glucose treatment groups were found to have significantly lower p-eNOS expression compared with the normal glucose control. In late passage HUVECs (PDL 44), all high and/or low glucose treatments resulted in significant decreases in phosphorylated (serine 1177) eNOS compared with that of early passage normal glucose control. Normal glucose exposure also produced lower p-eNOS levels in late compared with early PDL cells, though the difference was not as significant as the previously described high and/or low glucose treatments compared with that of the early passage normal glucose control group.
Figure 7.
Protein expression analysis of phosphorylated endothelial nitric oxide synthase (eNOS; Serine 1177) in high and/or low glucose exposed human umbilical vein endothelial cells (HUVECs). Reduction of phosphorylated eNOS protein expression is significantly enhanced following high and/or low glucose exposure in endothelial cells. HUVECs were incubated with each of the previously described glucose treatments at the indicated population doubling time points. (a) Western blot analyses of p-eNOS expression were performed with 20 μg of cell lysate. (b) Relative p-eNOS protein expression was quantified by densitometric analysis associated with Licor Odyssey software (data are normalized against GAPDH and expressed as means ± SE). Data are presented as means ± SE in four experiments. *p < .05, significantly different from control HUVECs cultured in the absence of high glucose.
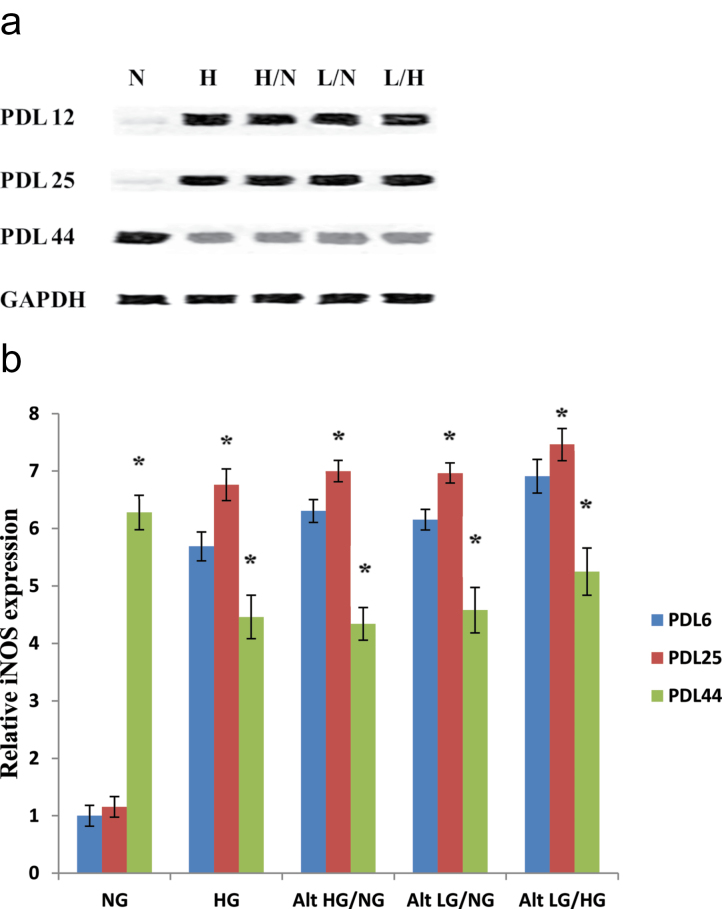
We also measured the levels of iNOS protein expression among HUVECs treated with varying glucose exposures through early to late passage. As seen in Figure 8a and b, normal glucose control cells at PDL 12 had minimal iNOS expression. Early passage PDL 12 endothelial cells exposed to high, alternating high and normal, or alternating low and normal showed significantly increased levels of iNOS protein compared with the PDL 12 normal glucose control. HUVECs exposed to alternating low and high produced even greater increases in iNOS expression compared with that of all other treatment groups at PDL 12 (Figure 8a and b). Endothelial cells treated with normal glucose at PDL 25 also showed virtually no iNOS expression and no significant difference compared with that of the early passage (PDL 12) control. However, HUVECs exposed to glucose stress (all the high and/or low glucose treatments) resulted in the most significant increases in iNOS protein expression at PDL 25. Endothelial cells exposed to these high and/or low glucose treatments at PDL 44 showed an overall slight reduction in the increase in iNOS protein expression compared with that seen in PDL 25. However, even normal glucose exposure resulted in a significant increase in iNOS presence compared with that of the early passage normal glucose control, suggesting that there is a glucose-independent increase of iNOS in senescent cells.
Figure 8.
Human umbilical vein endothelial cell (HUVEC) protein expression of inducible nitric oxide synthase (iNOS) in response to high and/or low glucose exposure. High and/or low glucose exposure results in significant overexpression of iNOS protein expression in endothelial cells. HUVECs were incubated with each of the previously described glucose treatments at the indicated population doubling time points. (a) Western blot analyses of iNOS expression were performed with 20 μg of cell lysate. (b) Relative iNOS protein expression was quantified by densitometric analysis associated with Licor Odyssey software (data are normalized against GAPDH and expressed as means ± SE). Data are presented as means ± SE in four experiments. *p < 0.05, significantly different from control HUVECs cultured in the absence of high glucose.
Changes in HUVEC Gene Expression
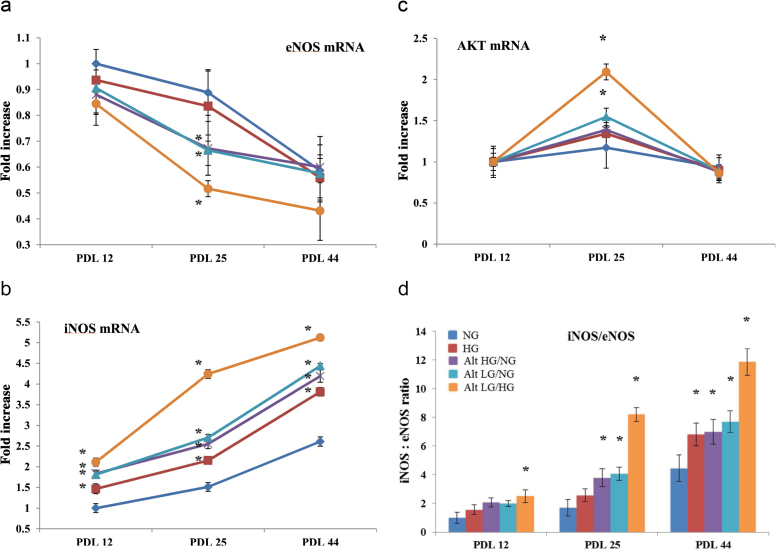
Real-time quantitative reverse transcription PCR experiments were performed to determine whether various glucose conditions might mediate alterations of transcriptional regulation in AKT and its downstream signaling target, eNOS, and iNOS. Expression of AKT mRNA was found to be statistically unchanged among all tested glucose treatments in both early and late passage HUVECs (Figure 9c). However, in PDL 25 endothelial cells, AKT expression was significantly increased (2.1±0.047-fold) in response to alternating low and high glucose exposure compared with early passage normal glucose control HUVECs. AKT mRNA expression in PDL 25 HUVECs was also slightly increased following treatment with alternating high and normal and alternating low and normal glucose, 1.39±0.035- and 1.54±0.041-fold increases, respectively.
Figure 9.
Real-time quantitative reverse transcription PCR (qRT-PCR) quantification of gene expression in human umbilical vein endothelial cells (HUVECs) treated with high and/or low glucose. Determination by qRT-PCR of (a) eNOS mRNA (b) iNOS mRNA, and (c) AKT mRNA levels, in control (normal 5.5mM) and experimental HUVECs exposed to high (25mM) and/or low (1.5mM) glucose concentration at the designated population doubling time point. (d) The results represent the ratio generated by dividing the values of the above-mentioned amplified transcripts and constitutive GAPDH determined by optical density. *p < .05 of the experimental HUVECs in comparison with their respective control HUVECs. ◊ = NG, ■ = HG, X = Alt HG/NG, ▲ = Alt LG/NG, ● = Alt LG/HG.
As shown in Figure 9a, there was no significant difference in mRNA expression of eNOS at PDL 12 among normal (1±0.039), temporary high (0.94±0.054-fold decrease), and high (0.98±0.066-fold decrease). A slight decrease in eNOS expression at PDL 12 was observed among alternating high and normal (0.88±0.071-fold decrease), alternating low and normal (0.89±0.061-fold decrease), and alternating low and high (0.85±0.052-fold decrease) glucose levels compared with that of normal glucose exposure. For middle passage (PDL 25) HUVECs, eNOS mRNA expression was reduced to a greater extent with all glucose treatments compared with that of the early passage normal glucose control. As shown in Figure 9a, normal and high glucose exposure at PDL 25 resulted in a 0.88±0.039- and 0.84±0.067-fold decreases in mRNA eNOS expression, respectively. HUVECs at PDL 25 exposed to alternating high and normal (0.67±0.041-fold decrease), alternating low and normal (0.64±0.043-fold decrease), and alternating low and high (0.52±0.062-fold decrease) glucose levels showed significantly decreased eNOS mRNA levels compared with that of the normal glucose control. In late passage PDL 44 HUVECs, mRNA expression of eNOS was significantly downregulated for all glucose treatments. Figure 9a shows that exposure to normal glucose resulted in a 0.59±0.047-fold decrease in eNOS mRNA expression at PDL 44 compared with that of early passage normal glucose control. Exposure to high and/or low glucose in HUVECs at PDL 44 resulted in even greater decreases in eNOS mRNA levels: high glucose (0.56±0.034-fold decrease), alternating high and normal glucose (0.58±0.061-fold decrease), alternating low and normal (0.58±0.044-fold decrease), and alternating low and high (0.43±0.057-fold decrease).
Expression of iNOS mRNA was found to undergo the most dramatic alterations in response to glucose treatments and also with advancing PDL (Figure 9b). In early passage PDL 12 HUVECs, iNOS mRNA expression was significantly increased following exposure to high (1.47±0.055-fold increase), alternating high and normal (1.84±0.046-fold increase), alternating low and normal (1.81±0.033-fold increase), and alternating low and high (2.11±0.051-fold increase) glucose. Endothelial cells at PDL 25 were observed to have greater increases compared with that of PDL 12 in iNOS expression among all glucose treatments. Expression of iNOS in normal glucose HUVECs at PDL 25 was found to be 1.51±0.049-fold increase compared with that of the early passage control. Additionally, HUVEC exposure at PDL 25 to high (2.17±0.041-fold increase), alternating high and normal (2.55±0.039-fold increase), alternating low and normal (2.7±0.049-fold increase), and alternating low and high (4.24±0.052-fold increase) glucose showed significantly increased iNOS mRNA levels compared with that of the PDL 25 normal glucose control. Finally, iNOS mRNA expression was most significantly elevated in late passage PDL 44 HUVECs in all glucose treatment groups: normal (2.61±0.049-fold increase), high (3.81±0.054-fold increase), alternating high and normal (4.19±0.061-fold increase), alternating low and normal (4.44±0.038-fold increase), and alternating low and high (5.12±0.042-fold increase).
Discussion
The present investigation has identified several novel findings. Our data indicate that exposure to glucose stress (both elevated and reduced glucose levels) significantly accelerated the appearance of markers of endothelial cell senescence. The results also strongly suggest that this accelerated appearance of markers of senescence is, in part, due to regulatory changes in the transcription and expression of AKT and its downstream signaling targets, including NOS. Additionally, we observed that exposure to alternating glucose levels rapidly impaired eNOS activity, resulted in overexpression of iNOS and decreased overall nitric oxide bioavailability and impaired endothelial function in the human endothelial cell. Taken together, these findings suggest that alternating between high and low glucose levels resulted in the acceleration of stress-induced senescence phenotype. Elevated and reduced glucose levels alter the late passage cell’s nitric oxide antioxidant function from low, basal, protective levels to higher, cytotoxic levels, and consequently produce cellular dysfunction, damage, and a senescent phenotype.
Effects of Glucose Stress on Appearance of Markers of Senescence and Reduction of Proliferation in Early and Aged HUVECs
Elderly patients are at higher risk of cardiovascular complications associated with the metabolic syndrome and they are more prone to hypoglycemia in response to pharmacological treatment strategies aimed at tight control of high blood glucose levels (38–41). In the Action in Diabetes and Vascular Disease: Preterax and Diamicron Modified Release Controlled Evaluation study, severe hypoglycemia induced by tight glucose control in elderly diabetics was clearly associated with increased risk of macrovascular events, microvascular events, and even death from both cardiovascular and noncardiovascular causes (42).
Our findings indicate that the inherent inability of the endothelial cell to regulate glucose flux in the face of glucose stress (high or low concentrations) can cause the accelerated appearance of markers of cell senescence. Under normal conditions, HUVECs usually maintain a relatively constant cell proliferation rate, and the progressive decline in proliferation rate and appearance of cellular senescence tend to be gradual until very late passage numbers (~PDL 40). Increased expression of p16INK-4a, an additional marker of senescence, was also observed in late passage (PDL 40) HUVECs. Elevated glucose levels significantly accelerated the replicative senescence and decreased the cell proliferation rates. Interestingly, when we exposed early passage HUVECs to temporarily elevated glucose levels, followed by a return to normal glucose levels, the senescence acceleration was found to be reduced compared with that of chronically elevated glucose. However, this was not the case in late passage cells, where the senescence acceleration after temporary elevation of glucose followed by normal glucose did not differ from that after chronically elevated glucose exposure. Exposure to alternating low glucose followed by normal glucose also resulted in reduced HUVEC proliferation. Moreover, the most deleterious effects were observed when HUVECs were exposed to alternating low followed by high glucose levels, which resulted in a dramatic acceleration of the appearance of markers of cellular senescence, with early passage endothelial cells (PDL 12) showing significant stress-induced growth arrest.
These results strongly suggest that later passage endothelial cells have a dramatically reduced ability to respond to glucose stress, resulting in an accelerated appearance of markers of the senescence phenotype and reduced replicative rates. As the rest of our data suggest, this diminished capability to tolerate glucose stress is, in part, due to regulatory changes in antioxidant mechanisms associated with NOS expression and activity. Taken together, these data indicate a novel mechanism of inducing early appearance of markers of endothelial cell senescence and endothelial dysfunction, namely, that of alternating high and/or low glucose levels, which may resemble the typical clinical scenario involving tight glycemic regulation among elderly diabetic patients.
Protein Expression of NOS and AKT Is Differentially Regulated in Early and Late Passage HUVECs in Response to Glucose Stress
In higher concentrations, nitric oxide can act as a reactive nitrogen species, the effects of which can contribute to pathological mechanisms that are involved in cardiovascular aging (43). All three isoforms of NOS have been found in cardiovascular tissues (44). eNOS is constitutively expressed in the endothelium under basal conditions and is responsible for the low level of nitric oxide production involved in endothelium-dependent vasodilatation. Our results show that under normal glucose levels, the HUVEC expression of eNOS gradually decreases over the passage of time. Additionally, early passage protein expression of eNOS is virtually unchanged among all different glucose level treatment groups. However, in middle and late passage endothelial cells, high and/or low glucose exposure induces much greater declines in the expression of eNOS, most noticeably with alternating low and high glucose treatment. These results suggest that high and/or low glucose levels reduce the aged HUVEC’s nitric oxide signaling ability via depletion of basal eNOS and reduce its cytoprotective effects. The shift in iNOS:eNOS ratio (Figure 9d) toward a predominant iNOS presence likely results in much higher levels of free-radical (reactive nitrogen species) production and consequent injury, resulting in increased endothelial cell dysfunction and the accelerated appearance of markers of senescence.
iNOS has not been found to be constitutively present at detectable levels in the normal, younger adult heart or vasculature, but it can be induced by proinflammatory substances, such as cytokines, lipopolysaccharides, or proinflammatory events, including hypertension, atherosclerosis, ischemic stress, stroke, trauma, and infection (45). Recent studies have suggested that the aging process induces increased expression of iNOS in the brain (46) and the heart (47). For example, Csiszar and colleagues (48) demonstrated that aging is associated with a shift in coronary arteriole phenotype, including increased expression of iNOS and increased activity of NAD(P)H oxidases. Our data strongly suggest that glucose stress (both high and low glucose levels) is a potent inducer of iNOS protein upregulation and that these effects are further enhanced in the older (later passage) endothelial cells. Even at relatively early PDL numbers, iNOS protein levels were significantly increased in response to both high and low glucose exposure. iNOS is a more potent generator of nitric oxide and this shift to the predominant presence of iNOS protein results in an unfavorable intracellular free-radical environment due to the loss of low, basal level of nitric oxide production via eNOS. Therefore, alternating levels of low and high glucose appear to synergistically impair the endothelial cells’ nitric oxide-dependent antioxidant function partly by overcompensating NOS expression and activity. Consequently, we see a concomitant shift in the acceleration of appearance of markers of senescence and HUVEC growth arrest in response to both high or low glucose stress.
Phosphorylation of eNOS
AKT is an important mediator of many physiological pathways and is directly involved in metabolic regulation, cell growth, and proliferation. Recently, studies have shown its crucial role in p-53-mediated senescence and proposed a potential affiliation with the “senescence-associated secretory phenotype.” These findings, coupled with AKT’s known involvement in inflammation and oxidative stress, suggest a potential mechanism in the alteration of NOS expression and development of senescence in response to glucose stress. AKT’s role in the activation of eNOS via phosphorylation of serine residue 1177 is well described (49,50). Perturbations of eNOS phosphorylation have been reported in a number of pathologies, thereby emphasizing the importance of the expression and regulation of eNOS activity in vascular health (51). Our data show some interesting findings related to expression of AKT in response to elevated and reduced glucose and endothelial cell aging. There was little change in early and late passage AKT protein expression among all treatment groups. However, in middle passage PDL 25 HUVECs, we observed an acute upregulation in AKT protein levels in response to alternating low and high glucose exposure. We propose that this increase is a compensatory response of the endothelial cells to upregulated NOS activity (antioxidant function) in the face of high and/or low glucose stress. The AKT protein phosphorylates a wide range of proteins, including eNOS. Therefore, small changes in its total protein expression may not have a direct effect on any one particular phosphorylation target. AKT is also directly activated and inhibited via mammalian target of rapamycin, which is known to be involved in nutrient sensing and in the progression of cellular senescence. Additionally, there could be other factors involved, including phosphorylation of eNOS via PKA (S1179) as well as other posttranslational events such as myrostylation, nitrosylation, and/or glycosylation of eNOS. Furthermore, eNOS is also known to be dysfunctional in glucose stress due to BH4/BH2 alterations. Our data also show that protein expression levels of AKT phosphorylation at threonine 308 were, for the most part, unchanged among glucose treatment groups for early, middle, and late passage HUVECs. We did observe an overall decrease in p-AKT levels in middle and late passage cells compared with that of early passage control and treatment groups. The literature also supports that AKT phosphorylation may be biphasic. Kinoshita and colleagues (52) showed that p-AKT levels were increased in human arteries in response to high glucose exposure for 1 h. Yet another study reported that long-term glucose exposure, 7 days, resulted in reduced expression of p-AKT in human aortic smooth muscle cells (53). Our results suggest that although phosphorylation of AKT at threonine 308 is slightly reduced in middle and late passage HUVECs, regulation of eNOS activity in response to high and low glucose in senescent cells may also be mediated through additional partners of the PI3K/AKT pathway, such as the nutrient-sensing mammalian target of rapamycin or AMPK. More work to delineate the role of these factors and the regulatory mechanisms involved is needed. These findings lend support to the notion that endothelial cell oxidative stress and accelerated cell senescence are likely the result of dysfunctional intracellular antioxidant response mechanisms.
Glucose Stress Induces Transcriptional Dysregulation of NOS
As described in the Results section, in vitro cellular aging and alternating reduced and elevated glucose levels induced differential protein expression of NOS and AKT in HUVECs. Therefore, we sought to determine if these alterations in protein levels correlated with transcriptional differences among the respective genes of interest. It is known that eNOS activity undergoes regulation at the posttranslational level, mainly via phosphorylation and/or dephosphorylation mechanisms that are partly mediated by AKT. Our results, however, also show an overall gradual decline in eNOS mRNA over passage of time in all of the glucose groups. This decrease was most significant in HUVECs exposed to alternating low and high glucose levels and are in agreement with that of other studies, which found that the aging process alone was associated with decreased eNOS gene expression in heart tissue and arterial vascular cells (54). Our results indicate that exposure to alternating low and high glucose levels enhances this documented progressive decline in eNOS transcription among endothelial cells. Normal endothelial production of nitric oxide plays an important role in preventing vascular disease. Endothelium-dependent vasodilation has been reported to be impaired in both the microcirculation and macrocirculation during acute hyperglycemia in normal (normotensive and euglycemic) (55,56) participants and in diabetic patients (57), suggesting that NOS activity may be chronically impaired in patients with hyperglycemia, insulin resistance, metabolic syndrome, and/or diabetes.
Lastly, in the present study, we found that iNOS gene expression was significantly higher among late versus early passage HUVECs, and that the difference was significantly enhanced in response to high and/or low glucose levels. We also found that although basal iNOS mRNA levels increased from PDL 25 to PDL 44, protein expression of iNOS decreased or remained the same. One explanation for this finding may be due to an overall reduction in protein translation among the late passage, senescent cells, or dysfunctional translational “machinery.” Recent studies have shown that global protein translation is reduced among senescent cells, and Dicer expression and activity is likewise dysfunctional (58–60). Glucose stress may accelerate or enhance this age-associated protein translation dysfunction.
The observed upregulation of iNOS mRNA levels together with the reduction in eNOS gene expression suggest that HUVECs, in part, shift or replace nitric oxide production source from that of the basal, protective eNOS to that of the more potent, deleterious iNOS enzyme. We propose that this shift in NOS regulation, including the decreased expression of eNOS, together with the increased expression of iNOS and AKT may underlie the acceleration of appearance of markers of endothelial cell senescence and vascular dysfunction. This alteration in NOS expression seems to be a potent proinflammatory response and a phenotypic consequence of senescent endothelial cells, exacerbated by glucose stress.
Conclusions
The results from the present study suggest that both high and low glucose levels may result in earlier appearance of markers of endothelial cell senescence. In addition, glucose stress may cause altered gene and protein expression among members in the AKT–NOS pathway. These changes may result in deleterious effects on the endothelium and the development of vascular dysfunction. Managing diabetes in the elderly population is difficult because of complex comorbid medical issues and the generally limited functional status of many senior diabetic patients. Nationally published guidelines for treating adults are often not easily applicable to geriatric care, and practitioners’ individualized approaches to therapy are highly variable. Understanding the special needs of geriatric patients and the mechanisms underlying their impaired physiological responses to glycemic stress, especially hypoglycemia, will likely aid in improving the overall care of elderly diabetic patients in the future.
Supplementary Material
Supplementary material can be found at: http://biomedgerontology.oxfordjournals.org/
Funding
This study was supported in part by National Institutes of Health (AG028718), GRECC, CAVHS, and UAMS.
References
- 1. Wei JY. Age and the cardiovascular system. N Engl J Med. 1992;327:1735–1739 [DOI] [PubMed] [Google Scholar]
- 2. Wei JY. Understanding the aging cardiovascular system. Geriatr Gerontol Int. 2004;4:S298–S303 [Google Scholar]
- 3. Monickaraj F, Aravind S, Gokulakrishnan K, et al. Accelerated aging as evidenced by increased telomere shortening and mitochondrial DNA depletion in patients with type 2 diabetes. Mol Cell Biochem. 2012;365:343–350 [DOI] [PubMed] [Google Scholar]
- 4. Triplitt CL. Examining the mechanisms of glucose regulation. Am J Manag Care. 2012;18:S4–S10 [PubMed] [Google Scholar]
- 5. Horwich TB, Fonarow GC. Glucose, obesity, metabolic syndrome, and diabetes relevance to incidence of heart failure. J Am Coll Cardiol. 2010;55:283–293 [DOI] [PMC free article] [PubMed] [Google Scholar]
- 6. Desouza CV, Bolli GB, Fonseca V. Hypoglycemia, diabetes, and cardiovascular events. Diabetes Care. 2010;33:1389–1394 [DOI] [PMC free article] [PubMed] [Google Scholar]
- 7. Skyler JS, Bergenstal R, Bonow RO, et al. Intensive glycemic control and the prevention of cardiovascular events: implications of the ACCORD, ADVANCE, and VA Diabetes Trials: a position statement of the American Diabetes Association and a Scientific Statement of the American College of Cardiology Foundation and the American Heart Association. J Am Coll Cardiol. 2009;53:298–304 [DOI] [PubMed] [Google Scholar]
- 8. Ceriello A, Esposito K, Piconi L, et al. Oscillating glucose is more deleterious to endothelial function and oxidative stress than mean glucose in normal and type 2 diabetic patients. Diabetes. 2008;57:1349–1354 [DOI] [PubMed] [Google Scholar]
- 9. Bouché C, Serdy S, Kahn CR, Goldfine AB. The cellular fate of glucose and its relevance in type 2 diabetes. Endocr Rev. 2004;25:807–830 [DOI] [PubMed] [Google Scholar]
- 10. Szoke E, Shrayyef MZ, Messing S, et al. Effect of aging on glucose homeostasis: accelerated deterioration of beta-cell function in individuals with impaired glucose tolerance. Diabetes Care. 2008;31:539–543 [DOI] [PubMed] [Google Scholar]
- 11. Weinsaft JW, Edelberg JM. Aging-associated changes in vascular activity: a potential link to geriatric cardiovascular disease. Am J Geriatr Cardiol. 2001;10:348–354 [DOI] [PubMed] [Google Scholar]
- 12. Herrera MD, Mingorance C, Rodríguez-Rodríguez R, Alvarez de Sotomayor M. Endothelial dysfunction and aging: an update. Ageing Res Rev. 2010;9:142–152 [DOI] [PubMed] [Google Scholar]
- 13. Erusalimsky JD. Vascular endothelial senescence: from mechanisms to pathophysiology. J Appl Physiol. 2009;106:326–332 [DOI] [PMC free article] [PubMed] [Google Scholar]
- 14. Jane-Wit D, Chun HJ. Mechanisms of dysfunction in senescent pulmonary endothelium. J Gerontol A Biol Sci Med Sci. 2012;67:236–241 [DOI] [PMC free article] [PubMed] [Google Scholar]
- 15. Fleenor BS, Marshall KD, Rippe C, Seals DR. Replicative aging induces endothelial to mesenchymal transition in human aortic endothelial cells: potential role of inflammation. J Vasc Res. 2012;49:59–64 [DOI] [PMC free article] [PubMed] [Google Scholar]
- 16. Ungvari Z, Bailey-Downs L, Sosnowska D, et al. Vascular oxidative stress in aging: a homeostatic failure due to dysregulation of NRF2-mediated antioxidant response. Am J Physiol Heart Circ Physiol. 2011;301:H363–H372 [DOI] [PMC free article] [PubMed] [Google Scholar]
- 17. Campisi J. Senescent cells, tumor suppression, and organismal aging: good citizens, bad neighbors. Cell. 2005;120:513–522 [DOI] [PubMed] [Google Scholar]
- 18. Hayashi T, Yano K, Matsui-Hirai H, Yokoo H, Hattori Y, Iguchi A. Nitric oxide and endothelial cellular senescence. Pharmacol Ther. 2008;120:333–339 [DOI] [PubMed] [Google Scholar]
- 19. Capellini VK, Celotto AC, Baldo CF, et al. Diabetes and vascular disease: basic concepts of nitric oxide physiology, endothelial dysfunction, oxidative stress and therapeutic possibilities. Curr Vasc Pharmacol. 2010;8:526–544 [DOI] [PubMed] [Google Scholar]
- 20. Hirase T, Node K. Endothelial dysfunction as a cellular mechanism for vascular failure. Am J Physiol Heart Circ Physiol. 2012;302:H499–H505 [DOI] [PubMed] [Google Scholar]
- 21. Kolluru GK, Bir SC, Kevil CG. Endothelial dysfunction and diabetes: effects on angiogenesis, vascular remodeling, and wound healing. Int J Vasc Med. 2012;2012:918267. [DOI] [PMC free article] [PubMed] [Google Scholar]
- 22. Zhang Y, Janssens SP, Wingler K, Schmidt HH, Moens AL. Modulating endothelial nitric oxide synthase: a new cardiovascular therapeutic strategy. Am J Physiol Heart Circ Physiol. 2011;301:H634–H646 [DOI] [PubMed] [Google Scholar]
- 23. Alp NJ, Channon KM. Regulation of endothelial nitric oxide synthase by tetrahydrobiopterin in vascular disease. Arterioscler Thromb Vasc Biol. 2004;24:413–420 [DOI] [PubMed] [Google Scholar]
- 24. Tanaka J, Qiang L, Banks AS, et al. Foxo1 links hyperglycemia to LDL oxidation and endothelial nitric oxide synthase dysfunction in vascular endothelial cells. Diabetes. 2009;58:2344–2354 [DOI] [PMC free article] [PubMed] [Google Scholar]
- 25. Hadi HA, Suwaidi JA. Endothelial dysfunction in diabetes mellitus. Vasc Health Risk Manag. 2007;3:853–876 [PMC free article] [PubMed] [Google Scholar]
- 26. Deedwania PC. Mechanisms of endothelial dysfunction in the metabolic syndrome. Curr Diab Rep. 2003;3:289–292 [DOI] [PubMed] [Google Scholar]
- 27. Rippe C, Blimline M, Magerko KA, et al. MicroRNA changes in human arterial endothelial cells with senescence: relation to apoptosis, eNOS and inflammation. Exp Gerontol. 2012;47:45–51 [DOI] [PMC free article] [PubMed] [Google Scholar]
- 28. Terry T, Raravikar K, Chokrungvaranon N, Reaven PD. Does aggressive glycemic control benefit macrovascular and microvascular disease in type 2 diabetes? Insights from ACCORD, ADVANCE, and VADT. Curr Cardiol Rep. 2012;14:79–88 [DOI] [PubMed] [Google Scholar]
- 29. Lipska KJ, Kosiborod M. Hypoglycemia and adverse outcomes: marker or mediator? Rev Cardiovasc Med. 2011;12:132–135 [PubMed] [Google Scholar]
- 30. Heller SR. Minimizing hypoglycemia while maintaining glycemic control in diabetes. Diabetes. 2008;57:3177–3183 [DOI] [PMC free article] [PubMed] [Google Scholar]
- 31. Wang J, Alexanian A, Ying R, et al. Acute exposure to low glucose rapidly induces endothelial dysfunction and mitochondrial oxidative stress: role for AMP kinase. Arterioscler Thromb Vasc Biol. 2012;32:712–720 [DOI] [PMC free article] [PubMed] [Google Scholar]
- 32. Lee SW, Fukunaga N, Rigney DR, Shin DY, Wei JY. Downregulation of DNA topoisomerase I in old versus young human diploid fibroblasts. Mutat Res. 1997;373:179–184 [DOI] [PubMed] [Google Scholar]
- 33. Rigney DR, Wei JY. Note on the dispersion of generations among cells in senescing diploid fibroblast populations. Mech Ageing Dev. 1989;47:187–197 [DOI] [PubMed] [Google Scholar]
- 34. Rogers SC, Kavdia M. Superoxide increases in hyperglycemic endothelial cells using dhe fluorescence: is it production or concentration? Free Radical Biology and Medicine. 2009;47:S78–S88 [Google Scholar]
- 35. Dimri GP, Lee X, Basile G, et al. A biomarker that identifies senescent human cells in culture and in aging skin in vivo. Proc Natl Acad Sci USA. 1995;92:9363–9367 [DOI] [PMC free article] [PubMed] [Google Scholar]
- 36. Gabai VL, Meriin AB, Yaglom JA, Wei JY, Mosser DD, Sherman MY. Suppression of stress kinase JNK is involved in HSP72-mediated protection of myogenic cells from transient energy deprivation. HSP72 alleviates the stewss-induced inhibition of JNK dephosphorylation. J Biol Chem. 2000;275:38088–38094 [DOI] [PubMed] [Google Scholar]
- 37. Zhang X, Azhar G, Nagano K, Wei JY. Differential vulnerability to oxidative stress in rat cardiac myocytes versus fibroblasts. J Am Coll Cardiol. 2001;38:2055–2062 [DOI] [PubMed] [Google Scholar]
- 38. Macisaac RJ, Jerums G. Intensive glucose control and cardiovascular outcomes in type 2 diabetes. Heart Lung Circ. 2011;20:647–654 [DOI] [PubMed] [Google Scholar]
- 39. Olijhoek JK, van der Graaf Y, Banga JD, Algra A, Rabelink TJ, Visseren FL. The metabolic syndrome is associated with advanced vascular damage in patients with coronary heart disease, stroke, peripheral arterial disease or abdominal aortic aneurysm. Eur Heart J. 2004;25:342–348 [DOI] [PubMed] [Google Scholar]
- 40. Zoungas S, Patel A, Chalmers J, et al. Severe hypoglycemia and risks of vascular events and death. N Engl J Med. 2010;363:1410–1418 [DOI] [PubMed] [Google Scholar]
- 41. Halter JB. Diabetes mellitus in an aging population: the challenge ahead. J Gerontol A Biol Sci Med Sci. 2012;67:1297–1299 [DOI] [PubMed] [Google Scholar]
- 42. Triplitt C. Cardiac risk factors and hypoglycemia in an elderly patient: how good is good enough? Consult Pharm. 2010;25(suppl B):19–27 [PubMed] [Google Scholar]
- 43. Rodríguez-Mañas L, El-Assar M, Vallejo S, et al. Endothelial dysfunction in aged humans is related with oxidative stress and vascular inflammation. Aging Cell. 2009;8:226–238 [DOI] [PubMed] [Google Scholar]
- 44. Massion PB, Feron O, Dessy C, Balligand JL. Nitric oxide and cardiac function: ten years after, and continuing. Circ Res. 2003;93:388–398 [DOI] [PubMed] [Google Scholar]
- 45. Tousoulis D, Kampoli AM, Tentolouris C, Papageorgiou N, Stefanadis C. The role of nitric oxide on endothelial function. Curr Vasc Pharmacol. 2012;10:4–18 [DOI] [PubMed] [Google Scholar]
- 46. Ali AK, Banks WA, Kumar VB, et al. Nitric oxide activity and isoenzyme expression in the senescence-accelerated mouse p8 model of Alzheimer’s disease: effects of anti-amyloid antibody and antisense treatments. J Gerontol A Biol Sci Med Sci. 2009;64:1025–1030 [DOI] [PMC free article] [PubMed] [Google Scholar]
- 47. Li D, Qu Y, Tao L, et al. Inhibition of iNOS protects the aging heart against beta-adrenergic receptor stimulation-induced cardiac dysfunction and myocardial ischemic injury. J Surg Res. 2006;131:64–72 [DOI] [PubMed] [Google Scholar]
- 48. Csiszar A, Ungvari Z, Edwards JG, et al. Aging-induced phenotypic changes and oxidative stress impair coronary arteriolar function. Circ Res. 2002;90:1159–1166 [DOI] [PubMed] [Google Scholar]
- 49. Dimmeler S, Fleming I, Fisslthaler B, Hermann C, Busse R, Zeiher AM. Activation of nitric oxide synthase in endothelial cells by Akt-dependent phosphorylation. Nature. 1999;399:601–605 [DOI] [PubMed] [Google Scholar]
- 50. Shiojima I, Walsh K. Role of Akt signaling in vascular homeostasis and angiogenesis. Circ Res. 2002;90:1243–1250 [DOI] [PubMed] [Google Scholar]
- 51. Cau SB, Carneiro FS, Tostes RC. Differential modulation of nitric oxide synthases in aging: therapeutic opportunities. Front Physiol. 2012;3:218. [DOI] [PMC free article] [PubMed] [Google Scholar]
- 52. Kinoshita H, Matsuda N, Kaba H, et al. Roles of phosphatidylinositol 3-kinase-Akt and NADPH oxidase in adenosine 5’-triphosphate-sensitive K+ channel function impaired by high glucose in the human artery. Hypertension. 2008;52:507–513 [DOI] [PubMed] [Google Scholar]
- 53. Popov D, Nemecz M, Dumitrescu M, Georgescu A, Böhmer FD. Long-term high glucose concentration influences Akt, ERK1/2, and PTP1B protein expression in human aortic smooth muscle cells. Biochem Biophys Res Commun. 2009;388:51–55 [DOI] [PubMed] [Google Scholar]
- 54. Yoon HJ, Cho SW, Ahn BW, Yang SY. Alterations in the activity and expression of endothelial NO synthase in aged human endothelial cells. Mech Ageing Dev. 2010;131:119–123 [DOI] [PubMed] [Google Scholar]
- 55. Williams SB, Goldfine AB, Timimi FK, et al. Acute hyperglycemia attenuates endothelium-dependent vasodilation in humans in vivo. Circulation. 1998;97:1695–1701 [DOI] [PubMed] [Google Scholar]
- 56. Akbari CM, Saouaf R, Barnhill DF, Newman PA, LoGerfo FW, Veves A. Endothelium-dependent vasodilatation is impaired in both microcirculation and macrocirculation during acute hyperglycemia. J Vasc Surg. 1998;28:687–694 [DOI] [PubMed] [Google Scholar]
- 57. Kim SH, Park KW, Kim YS, et al. Effects of acute hyperglycemia on endothelium-dependent vasodilation in patients with diabetes mellitus or impaired glucose metabolism. Endothelium. 2003;10:65–70 [DOI] [PubMed] [Google Scholar]
- 58. Srikantan S, Marasa BS, Becker KG, Gorospe M, Abdelmohsen K. Paradoxical microRNAs: individual gene repressors, global translation enhancers. Cell Cycle. 2011;10:751–759 [DOI] [PMC free article] [PubMed] [Google Scholar]
- 59. Abdelmohsen K, Pullmann R, Jr, Lal A, et al. Phosphorylation of HuR by Chk2 regulates SIRT1 expression. Mol Cell. 2007;25:543–557 [DOI] [PMC free article] [PubMed] [Google Scholar]
- 60. Ungvari Z, Tucsek Z, Sosnowska D, et al. Aging-induced dysregulation of dicer1-dependent microrna expression impairs angiogenic capacity of rat cerebromicrovascular endothelial cells. J Gerontol A Biol Sci Med Sci. 2012 [DOI] [PMC free article] [PubMed] [Google Scholar]


