Abstract
The primary immune response to Epstein Barr virus (EBV) is characterized by striking proliferation of EBV-specific CD8+ T cells. In this study we have investigated the clonal composition and functional properties of the cells mediating this primary response and have analyzed the mechanisms that control the downregulation of the primary response and the selection of memory cells. We show that massively expanded T-cell clones often dominate the primary antigen-specific T-cell response. Despite the enormous extent of expansion, the virus-specific T cells express high levels of intracellular perforin and are potently cytotoxic. They are, however, functionally heterogeneous in their ability to secrete proinflammatory cytokines, with subpopulations of the antigen-specific T cells being hyporesponsive. The primary response is closely regulated, and the majority of cells are programmed to die via a cytokine-rescuable pathway, leaving only small populations of memory T cells surviving. Comparison of the clonal composition of primary and memory responses in vivo shows that the clones that dominate the primary response are relatively heavily culled during the downregulation of the primary response and the establishment of T-cell memory.
Introduction
Recent studies have shown that the primary CD8+ T-cell response to a foreign antigen may be characterized by massive proliferation of antigen-specific T cells (1–4). As the levels of antigen fall, many of these T cells die. Small numbers remain within a memory pool and mediate the response to further exposure to the antigen (1, 3–5). Detailed understanding of the composition and functional properties of primary immune responses, the mechanisms that control their ultimate downregulation, and the factors affecting the selection of surviving pools of memory T cells is, however, lacking.
We have addressed these issues in the context of the in vivo CD8+ T-cell response to primary infection with Epstein Barr virus (EBV) in humans. Primary infection with this virus may cause acute infectious mononucleosis (IM) (glandular fever), an illness characterized by a T-cell lymphocytosis. In previous studies we have shown that this lymphocytosis includes large populations of EBV antigen–specific CD8+ T cells (4, 6). The biological importance of the striking primary CD8+ T-cell response to this virus has been controversial, however, because the functional characteristics of the expanded populations of antigen-specific T cells have not been analyzed previously. Indeed, studies from murine models of infection suggest that, under certain circumstances, large populations of antigen-stimulated CD8+ T cells may be deficient in effector function (2, 7). In this study we have investigated both the clonal composition and the functional properties of the antigen-specific CD8+ T cells that mediate the in vivo primary immune response to two immunodominant epitopes from EBV. The results show that primary antigen-specific CD8+ T-cell responses may be characterized by the selective expansion of dominant T-cell clones. While these T cells show potent cytotoxic effector function, many are hyporesponsive with respect to cytokine or chemokine secretion.
The primary immune response does ultimately control infection with EBV, although the virus persists in a latent form within the B-cell pool (8). The fall in virus load is associated with a fall in the numbers of circulating EBV-specific CD8+ T cells (4). The mechanisms that control the decline of primary T-cell responses in vivo remain controversial (9–12). Activated T cells potentially may die via several different pathways (9, 13–18), and the relative importance of apoptosis induced by death receptors, by release of cytochrome c from mitochondria, or by alternative pathways (7) is unclear. We have investigated the mechanisms by which the EBV-specific T cells that mediate the important primary response to the virus might die after a fall in antigen load. The results suggest that the cells are primed to die via a mitochondrial/cytokine rescuable pathway of death.
Relatively small numbers of antigen-specific T cells survive the downregulation of the primary immune response in vivo. These cells are detectable, however, using human leukocyte antigen/peptide (HLA/peptide) tetrameric complexes within samples of PBMCs taken from donors 1 year after primary infection. Infection with EBV therefore provides a natural system in which one can analyze T-cell selection during the development of memory by comparing the composition of in vivo “primary” and “memory” populations of T cells specific for a given epitope in the same individual. Several previous studies have addressed the question of T-cell selection during the evolution of memory (19–26). Many studies support the idea that the repertoire of antigen-specific memory T cells simply reflects that of the antigen-specific primary T cells (20, 24, 26). However, conclusions drawn from other studies have conflicted with this hypothesis (19, 21, 25). Here we show that, in the context of a naturally occurring and persistent viral infection in humans, the in vivo memory response is not a clear reflection of the in vivo primary response in that clonotypes that are massively expanded during the primary response are preferentially culled during the evolution of T-cell memory. The work highlights the importance of the nature of the primary response in influencing long-term immunological memory and sheds light on the pathways by which memory T cells might differentiate.
Methods
Synthesis of HLA/peptide tetrameric complexes.
Soluble HLA/peptide tetrameric complexes were produced as described previously (4, 27). Briefly, recombinant class I heavy chain or β2 microglobulin was expressed in Escherichia coli cells transformed with the appropriate plasmids. Expression of the heavy chain was limited to the extracellular domain, and the sequence was modified by the addition of a COOH-terminal biotinylation site. The complexes were refolded in vitro, biotinylated, and then recovered by fast-performance liquid chromatography (FPLC) purification and ion exchange chromatography. Tetramers were made by mixing the biotinylated protein complex with streptavidin-phycoerythrin (streptavidin-PE) (Sigma-Aldrich Co., Poole, United Kingdom) at a molar ratio of 4:1. For this study we constructed tetramers of HLA-A2 complexed with the GLCTLVAML peptide and of HLA-B8 complexed with the RAKFKQLL peptide. The specificity of the tetramer binding was confirmed as described previously (4, 6). Further control experiments showed that these two tetramers bound equally well to fresh or frozen preparations of cells and that they did not bind to CD56+ natural killer (NK) cells.
Peptides.
Two peptides representing epitopes from EBV lytic cycle proteins were synthesized by Alta Bioscience (University of Birmingham, Birmingham, United Kingdom). GLCTLVAML is an HLA-A2–restricted epitope from an EBV early protein encoded by BMLF1 (28), while RAKFKQLL is an HLA-B8–restricted epitope from an EBV immediate-early protein encoded by BZLF1 (29).
Patients.
Fourteen HLA-A2+ and 10 HLA-B8+ individuals were identified during the acute stage of IM. The diagnosis was confirmed by an EBV-specific latex agglutination test. Samples of peripheral blood were taken at the time of diagnosis and 1 year later.
Isolation and fractionation of lymphocyte preparations.
Peripheral blood (3 ml) was incubated with red-cell lysis buffer (Gentra Systems Inc., Minneapolis, Minnesota, USA) to obtain leukocytes for use in preliminary staining experiments to rapidly identify individuals with populations of HLA-A2/GLCTLVAML or HLA-B8/RAKFKQLL tetramer–reactive T cells. Meanwhile, PBMCs were separated from the remaining 45 ml of peripheral blood using Ficoll-Hypaque density-gradient centrifugation and were used immediately for experiments or were cryopreserved.
Tissue typing.
HLA-A2+ and HLA-B8+ donors were identified rapidly by the preliminary experiments to detect populations of CD8+ T cells that reacted with the HLA-A2/GLCTLVAML or HLA-B8/RAKFKQLL tetrameric complexes within samples of peripheral blood. In addition, genomic DNA was extracted from peripheral blood cells using a Puregene kit (Gentra Systems Inc.) and this was used in PCR reactions using a panel of HLA allele–specific primers in order to formally tissue type all donors. All HLA-A2+ and HLA-B8+ donors had been identified correctly on the basis of appropriate reactivity of CD8+ T cells with the tetrameric complexes.
Analysis of T-cell receptor repertoire.
Samples of PBMCs were stained with one of a panel of mAb’s specific for the human T-cell receptor (TCR) variable (V) chains. Cells were washed and stained with a FITC-conjugated anti-mouse or anti-rat mAb, as appropriate (DAKO Corp., Carpinteria, California, USA), then with PE-labeled HLA/peptide tetrameric complex, and subsequently with a tricolor-conjugated anti-CD8 mAb (Caltag Laboratories Inc., Burlingame, California, USA). Cells were analyzed on a FACScalibur using CellQuest software (Becton Dickinson, Oxford, United Kingdom). Gates were set to include the live lymphocyte population. The BV2 mAb was found to interfere with the binding of the HLA-A2/GLCTLVAML tetramer in some patients, therefore results obtained using this mAb were omitted from the analyses.
Sequence analysis of TCR V β chains.
Samples of PBMCs were stained with the relevant HLA/peptide tetrameric complex and with anti-CD8 mAb. The CD8+ T-cell population of cells that reacted with the tetramer were sorted on a Becton Dickinson cell sorter. The mRNA was extracted from the sorted cells using Tri-Reagent (Sigma-Aldrich Co.) and used in first-strand cDNA synthesis. The cDNA was used as a template in PCR reactions using a 3′ C β-chain primer CGTTTGTCGTCGACCTGCTTCCCATTCACC and a 5′ V β-chain primer as described previously (6). The sequences of the V region primers were as follows: BV7, CTG AAT GCC CCA ACA GCT CTC; BV11, ACA GTC TCC AGA ATA AGG ACG; BV22, TCA TTT CGT TTT ATG AAA AGA TGC. The DNA product was purified and cloned into a pGEM-T Easy Vector (Promega Corp., Madison, Wisconsin, USA), according to the manufacturer’s instructions. After transformations of E. Coli (strain JM 109), plaques containing inserts were sequenced using an automated sequencer.
Ex vivo cytotoxicity assays.
PBMCs from IM patients were used as effectors in classical chromium-release assays to detect antigen-specific cytotoxicity, as described previously (30). HLA-matched PHA blasts, prepulsed with a 2-μM concentration of GLCTLVAML or RAKFKQLL peptide, were used as target cells. Control experiments were performed in the absence of peptide.
Flow cytometry to detect surface Fas and intracellular perforin, Bcl-2, cytokine, and chemokine expression.
For analysis of surface Fas expression, PBMCs were stained with tetramer and anti-CD8 mAb as above, then washed and stained with 0.25 μg anti-Fas/FITC mAb (DAKO Corp.) on ice for 30 minutes.
For analysis of intracellular perforin or Bcl-2 expression PBMCs were stained with tetramer and anti-CD8 mAb and were fixed by incubation with 200 μl of 4% paraformaldehyde on ice for 30 minutes. The samples were then washed twice in a PBS buffer containing 0.1% saponin and 1% FCS (permeabilization buffer) and incubated for 30 minutes on ice in the presence of 0.5 μg anti-perforin/FITC mAb (Ancell Corp., Bayport, Minnesota, USA), 0.5 μg anti–Bcl-2 mAb (DAKO Corp.), 0.5 μg anti-IgG2b/FITC-negative control mAb (PharMingen, San Diego, California, USA), or anti-CD3/FITC mAb (DAKO Corp.) diluted in 100 μl permeabilization buffer.
For analysis of intracellular cytokine or chemokine expression, PBMCs were incubated at room temperature for 30 minutes with the appropriate tetramer in RPMI supplemented with 10% FCS (R10). Cells were washed and incubated at a concentration of 2 × 10⁶ cells/ml in R10 supplemented with 50 U/ml rIL-2 (Sigma-Aldrich Co.) (R10/IL-2), or in a 10-μM solution of GLCTLVAML or RAKFKQLL peptide diluted in R10/IL-2, or with autologous lymphoblastoid B cells (at a ratio of 1:1), which had been prepulsed with 10 μM GLCTLVAML or RAKFKQLL peptide in R10/IL-2 in V-bottomed 25-ml-capacity universal containers, at 37°C in the presence of 5% CO2 for 6 hours. Experiments using peptide-pulsed autologous B-cell lines as a stimulant were, by necessity, performed using cryopreserved PBMCs. Brefeldin A (Sigma-Aldrich Co.) was added to the cultures at a final concentration of 5 μg/ml after the first hour of incubation. Cells were then washed, stained with saturating amounts of anti-CD8/tricolor mAb (Caltag Laboratories, Inc.), fixed in 4% paraformaldehyde (Sigma-Aldrich Co.), washed in permeabilization buffer, and stained with 0.5 μg of anti–IFN-γ/FITC mAb (PharMingen), 0.5 μg anti–macrophage inflammatory protein-1 β (MIP1 β)/FITC mAb (R&D Systems, Abingdon, United Kingdom), 0.5 μg anti-IgG1/FITC-negative control mAb (PharMingen), or with an anti-CD3/FITC mAb (DAKO Corp.) diluted in 100 μl permeabilization buffer, for 60 minutes on ice.
For all experiments analysis was performed using a FACScalibur and CellQuest software. Lymphocytes were gated by forward and side-angle light scatter. In each experiment, cells stained with anti-CD3 and anti-CD8 were used to identify the CD8hi subset of T cells that expressed CD3 and the markers set to allow analysis of this subset.
Cell-culture and death-inhibition assays.
PBMCs from IM patients were incubated at a concentration of 106 cells/ml in R10 in round-bottomed 96-well plates for 30 hours at 37°C in 5% CO2. To assess the effects of a Fas-Fc fusion protein (31) and a DR5-Fc fusion protein (32) on cell death, R10 was supplemented with the relevant fusion protein at final concentrations of 100 ng/ml and 500 ng/ml, respectively. To assess the effects of cytokines on cell death, R10 was supplemented with rIL-2 (Sigma Chemical Co.) at a final concentration of 50 U/ml, or with rIL-7 or rIL-15 (both from Sigma-Aldrich Co.) at final concentrations of 100 ng/ml.
Flow cytometry to assess cell death.
To assess survival of antigen-specific T cells PBMCs were stained with the appropriate tetrameric complex at room temperature, washed in R10, and stained with an anti-CD8/tricolor mAb (Caltag Laboratories Inc.), washed, resuspended in PBS, and analyzed by FACS. After 30 hours in culture, a population of lymphocytes with reduced forward scatter was identifiable. These lymphocytes were stained with propidium iodide and therefore consisted of dead or dying cells with increased membrane permeability. Region 2 was set to include these cells while region 1 was set to include the live lymphocyte population. The frequency of live tetramer-reactive T cells within the lymphocyte population was calculated as percentage of tetramer-reactive T cells in R1/total cells in R1 plus R2. The same regions were used to analyze PBMCs at time points 0 and 30 hours. Levels of TCR and CD8 expression by tetramer-reactive T cells could be analyzed within the R1 and R2 gates.
To analyze phosphatidyl serine exposure PBMCs were stained as above with tetramer and anti-CD8 mAb. They were then washed in HEPES buffer and incubated in annexin V labeling solution (Roche Diagnostics, Lewes, United Kingdom) according to the manufacturer’s instructions. Samples were diluted in the HEPES buffer and analyzed by FACS.
To analyze DNA fragmentation PBMCs were stained as above with tetramer and anti-CD8 mAb. An in situ cell-death detection kit adapted for FACS was used to identify cells containing DNA-strand breaks according to the manufacturer’s instructions (Roche Diagnostics).
Results and Discussion
T-cell selection during primary immune responses in vivo.
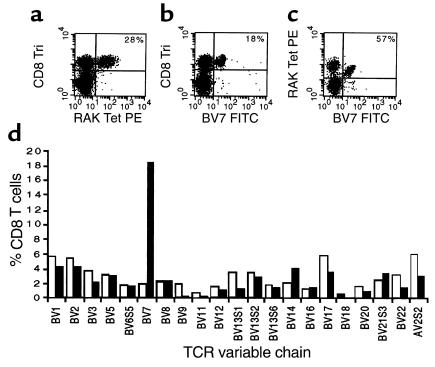
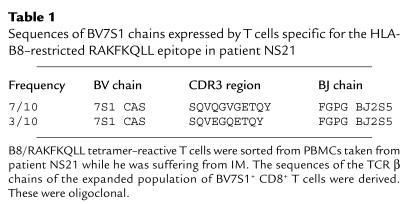
In the first phase of the study we analyzed the clonal composition of the in vivo, primary, CD8+ T-cell response to two dominant epitopes from EBV in order to determine whether such responses were polyclonal or oligoclonal and to ascertain whether the same or similar clonotypes were used by different individuals. We used HLA/peptide tetrameric complexes to analyze the HLA-B8–restricted response to the RAKFKQLL epitope from the BZLF1-encoded protein (29, 33) and the HLA-A2–restricted response to the GLCTLVAML epitope from the BMLF1-encoded protein (28, 33) in ten HLA-B8+ individuals and 14 HLA-A2+ individuals with IM. We found clear populations of CD8+ T cells reactive with the HLA-B8/RAKFKQLL tetrameric complex in all HLA-B8+ individuals, with frequencies ranging from 10 to 45% CD8+ T cells and of CD8+ T cells reactive with the HLA-A2/GLCTLVAML tetrameric complex in the HLA-A2+ individuals with frequencies ranging from 2 to 11% CD8+ T cells. The TCR repertoire of CD8+ T cells reactive with the tetrameric complexes was analyzed in all the patients using a panel of TCR V region–specific mAb’s. Results from an HLA-B8+ patient with IM (patient NS21), are shown in Figure 1. Twenty-eight percent of CD8+ T cells reacted with the HLA-B8/RAKFKQLL tetrameric complex (Figure 1a). This patient’s overall CD8+ TCR repertoire was abnormal with 18% of CD8+ T cells expressing BV7S1 (in healthy individuals a mean of 1.9%, SD 0.93%, CD8+ T cells express BV7S1; Figure 1, b and d). The expanded population of BV7S1+ CD8+ T cells was composed of cells reactive with the HLA-B8/RAKFKQLL tetrameric complex and accounted for 57% of all CD8+ T cells mediating the primary immune response to this epitope (Figure 1c). T cells expressing BV12, BV16, BV21S3, and AV2S2 accounted for smaller fractions of the primary immune response to RAKFKQLL in this individual (data not shown). We sorted the B8/RAKFKQLL tetramer–reactive T cells from PBMCs from patient NS21 and derived the sequences of the TCR β chains of the BV7S1-expressing T cells. These were oligoclonal (Table 1), with only two different sequences being identified from ten transcripts. Both of these β chains used BJ2S5 and showed similarities in the predicted amino acid sequences of the CDR3 regions. These results formally confirm the hypothesis that even very large distortions of the CD8+ TCR repertoire observed in patients with IM are due to clonally/oligoclonally expanded populations of EBV-specific T cells.
Figure 1.
BV7S1 use by HLA-B8–restricted RAKFKQLL-specific T cells in patient NS21 during the primary response to EBV. PBMCs taken from patient NS21 during primary EBV infection were stained with TCR V region–specific mAb’s, with an anti-CD8 mAb, and with the B8/RAKFKQLL tetrameric complex. (a) Twenty-eight percent of the CD8+ T cells react with the B8/RAKFKQLL tetrameric complex; (b) 18% of CD8+ T cells express the TCR BV7S1 chain; (c) 57% of B8/RAKFKQLL tetramer–reactive T cells express BV7S1. (d) The overall CD8+ TCR repertoire of patient NS21 (filled bars) is distorted with an expanded population of CD8+ T cells expressing BV7S1. The mean TCR repertoire of a panel of 21 young control individuals is shown (open bars) for comparison.
Table 1.
Sequences of BV7S1 chains expressed by T cells specific for the HLA-B8–restricted RAKFKQLL epitope in patient NS21
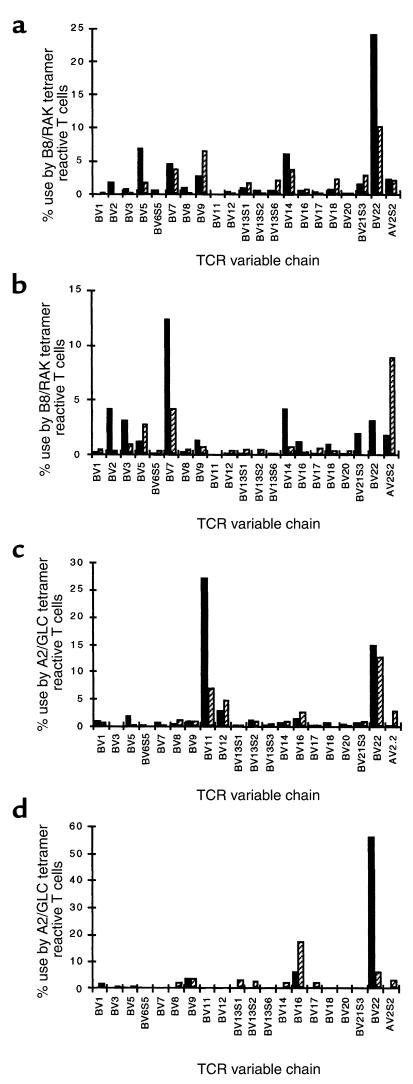
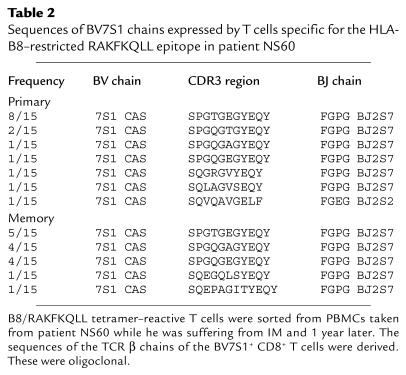
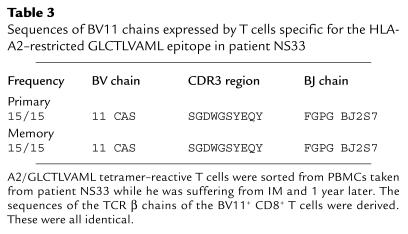
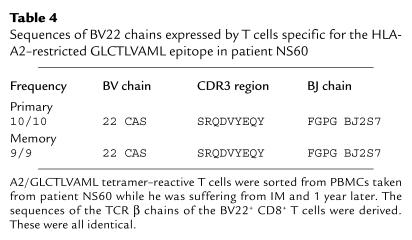
Results of analysis of the TCR repertoire of T cells mediating the primary immune response to the RAKFKQLL or GLCTLVAML epitopes in four further donors are shown in Figure 2 and Tables 2, 3, and 4. The primary immune response to the HLA-B8–restricted RAKFKQLL epitope in patient NS52 (comprising 40.2% CD8+ T cells) was dominated by T cells expressing BV22, used by 24.2% of B8/RAKFKQLL-reactive T cells. BV5, BV7, BV14, and BV9 were used by smaller populations of B8/RAKFKQLL-reactive T cells (Figure 2a). In patient NS60 the primary response to the HLA-B8–restricted RAKFKQLL epitope was dominated by T cells expressing BV7S1, accounting for 12.3% of the total RAKFKQLL-specific response (which comprised 33% CD8+ T cells; Figure 2b). We sorted the B8/RAKFKQLL tetramer–reactive T cells from this donor and found that the sequences of the BV7S1-expressing T cells were oligoclonal during the primary response (Table 2). In patient NS33 the primary response to the GLCTLVAML epitope (comprising 11% CD8 T cells) was dominated by T cells expressing BV11, which accounted for 27.2% of the response (Figure 2c). Analysis of the β chain sequences of this expanded population of BV11-expressing CD8+ T cells suggested that it was clonal/oligoclonal in composition (Table 3). In patient NS60, 56.3% of the HLA-A2–restricted GLCTLVAML-specific T cells mediating the primary immune response to this epitope (comprising 6.6% CD8+ T cells) expressed BV22. Again, this was clearly a clonal/oligoclonal population of cells (Table 4).
Figure 2.
The TCR repertoire of CD8+ T cells specific for EBV antigens during the primary and memory immune responses. PBMCs taken from donor NS52 (a), donor NS60 (b), donor NS33 (c), and donor NS60 (d), during primary EBV infection (black bars) and 1 year later (hatched bars), were stained with a panel of TCR V region–specific mAb’s, with the B8/RAKFKQLL tetrameric complex (a and b), or with the A2/GLCTLVAML tetrameric complex (c and d), and with an Ab specific for CD8. The TCR V–region use of CD8+ T cells reacting with the relevant tetrameric complex is shown. The frequency (% of CD8+ T cells) of RAKFKQLL-specific T cells during primary infection and 1 year later in donor NS52 was 40.2% and 4.4%, respectively, and in donor NS60 was 33% and 4.3%, respectively. The frequency of GLCTLVAML-specific T cells during primary infection and 1 year later in donor NS33 was 11% and 5.5%, respectively, and in donor NS60 was 6.6% and 1.3%, respectively.
Table 2.
Sequences of BV7S1 chains expressed by T cells specific for the HLA-B8–restricted RAKFKQLL epitope in patient NS60
Table 3.
Sequences of BV11 chains expressed by T cells specific for the HLA-A2–restricted GLCTLVAML epitope in patient NS33
Table 4.
Sequences of BV22 chains expressed by T cells specific for the HLA-A2–restricted GLCTLVAML epitope in patient NS60
The estimates of frequency of given clonotypes within a V β subset obtained using the method described, may be distorted by different levels of TCR mRNA expression within different responding T cells and cannot, therefore, be absolute. However, the overwhelming dominance of certain clonotypes in the above examples allows for a high degree of confidence in these results.
The TCR use of the dominant populations of T cells mediating the primary HLA-B8–restricted response to the RAKFKQLL epitope or the HLA-A2–restricted response to the GLCTLVAML epitope was not highly conserved between donors (22, 34). Nevertheless, BV7, BV22, and BV6S5 were commonly used by relatively large populations of T cells recognizing the RAKFKQLL epitope and BV22 and BV14 were commonly used by relatively large populations of T cells recognizing the GLCTLVAML epitope in several different donors.
Despite the presence of large clonal/oligoclonal expansions of antigen-specific T cells, the HLA-B8/RAKFKQLL and HLA-A2/GLCTLVAML tetramer–reactive T cells in any individual used a variety of TCR V segments, highlighting the diversity of the T cells that may recognize a given HLA/peptide complex (Figure 2). The reason for the selective expansion of certain clonal/oligoclonal populations of antigen-specific T cells in the face of a diverse repertoire of potentially reactive T cells remains unclear. Certain clonotypes may be present at relatively high frequency before EBV infection, perhaps because of biases during TCR gene rearrangement (35) or because some clonotypes have been expanded previously by a different but cross-reactive antigen. Some clonotypes may be exposed to antigen earlier or more frequently during the course of infection or may proliferate more efficiently in response to antigen stimulation. The latter may reflect differences in the biophysical properties of the interaction between different TCRs and a given HLA/peptide complex or differences in the phenotype of the responding T cell.
Expanded populations of EBV-specific CD8+ T cells from patients with IM are potent cytotoxic effectors and express perforin constitutively.
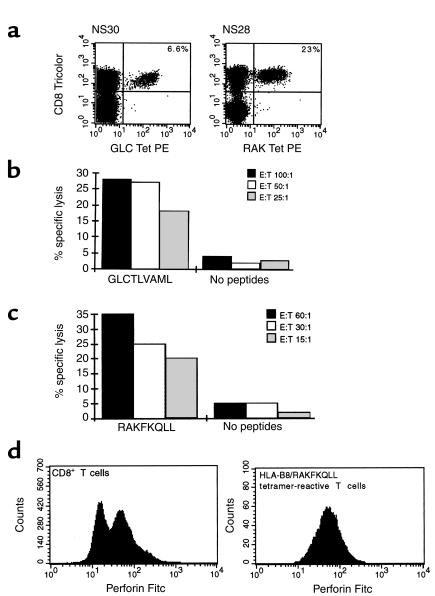
While the above analysis shows that striking antigen-driven clonal proliferation occurs during primary EBV infection, evidence that such massively expanded populations of CD8+ T cells function efficiently as effector cells has been lacking. We therefore analyzed the cytotoxic potential of the large populations of EBV-specific T cells found in patients with IM. Results from two donors, NS30 and NS28, are shown in Figure 3. In patient NS30, 6.6% CD8+ T cells (equivalent to 2.9% total PBMCs) reacted with the HLA-A2/GLCTLVAML tetrameric complex (Figure 3a) while in patient NS28 23.0% CD8+ T cells (equivalent to 8.0% total PBMCs) reacted with the HLA-B8/RAKFKQLL tetrameric complex (Figure 3a). PBMCs from these patients were used ex vivo as effectors in cytotoxicity assays. PBMCs from patient NS30 lysed target cells prepulsed with the HLA-A2–restricted GLCTLVAML peptide epitope at effector/target (E/T) ratios as low as 25 PBMCs/1 target cell (Figure 3b). This is equivalent to an E/T ratio of 0.7 HLA-A2/GLCTLVAML tetramer–reactive T cells/1 target cell. Likewise, PBMCs from patient NS28 lysed target cells prepulsed with the HLA-B8–restricted RAKFKQLL peptide epitope at E/T ratios as low as 15 PBMCs/1 target cell (Figure 3c). This is equivalent to 1.2 HLA-B8/RAKFKQLL tetramer–reactive T cells/1 target cell. The levels of cytotoxicity shown by these antigen-specific T cells mediating a primary immune response in vivo were therefore very similar to levels one would expect from an antigen-specific T-cell clone grown in vitro. Consistent with their cytotoxic potential, EBV antigen-specific T cells from patients with IM expressed high levels of intracellular perforin (Figure 3d). The capacity to kill target cells expressing immediate-early (e.g., BZLF1-encoded) and early (e.g., BMLF1-encoded) proteins expressed during the initial phases of EBV replication will be an important mechanism by which CD8+ T cells control EBV infection.
Figure 3.
Cytotoxicity of EBV-specific T cells during the primary immune response. (a) PBMCs from donor NS30, an HLA-A2+ individual with IM, and donor NS28, an HLA-B8+ individual with IM, were stained with an A2/GLCTLVAML or a B8/RAKFKQLL tetrameric complex and with an anti-CD8 mAb. The frequency (%) of CD8+ T cells that stain with the tetrameric complex is shown. PBMCs from these two patients were used as effector cells in chromium-release assays. PBMCs from donor NS30 caused specific lysis of target cells prepulsed with the GLCTLVAML peptide (b), and PBMCs from donor NS28 caused specific lysis of the targets prepulsed with the RAKFKQLL peptide (c). PBMCs from the HLA-B8+ donor were stained with the B8/RAKFKQLL tetrameric complex, with anti-CD8, and then were fixed, permeabilized, and stained for intracellular perforin expression. Perforin expression on CD8+ T cells was bimodal with 57% of CD8+ T cells being perforin bright. All the HLA-B8/RAKFKQLL tetramer–reactive T cells were perforin bright. The FL-1 threshold was set using a FITC-conjugated IgG2b control mAb.
Subpopulations of EBV-specific CD8+ T cells from patients with IM express IFN-γ and MIP1 β after stimulation with antigen.
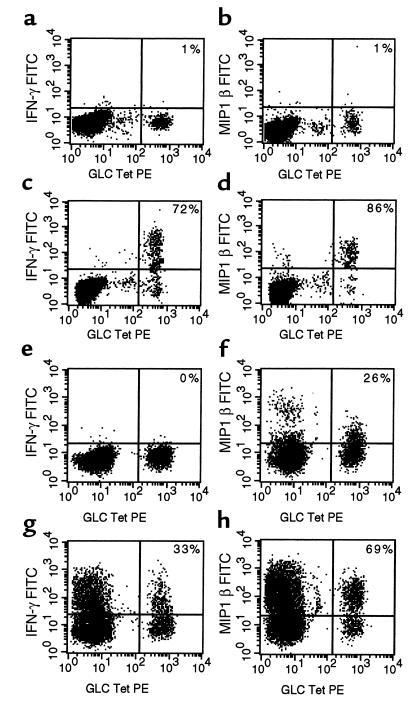
To investigate the functional properties of the expanded populations of CD8+ T cells still further and, in particular, to ascertain whether this degree of antigen-driven proliferation was associated with loss of effector function, we analyzed expression of cytokines and chemokines, including IFN-γ and MIP1 β, by antigen-specific T cells mediating the primary immune response to EBV in patients with IM. These EBV antigen–specific T cells did not express detectable levels of intracellular IFN-γ constitutively but a minority (0–30%) did express low levels of MIP1 β when analyzed ex vivo. Thus IFN-γ was not detected when PBMCs from HLA-A2+ donors with IM (NS120 and NS122) were incubated in the absence of added antigen (Figure 4, a and e). Virtually none of the HLA-A2/GLCTLVAML–reactive T cells from donor 120 expressed MIP1 β constitutively (Figure 4b) although 26% of these cells from donor 122 showed low-level expression of this chemokine ex vivo (Figure 4f). After stimulation with the appropriate peptide, subpopulations of the antigen-specific T cells were able to secrete IFN-γ and/or MIP1 β. In donor NS120, 72% HLA-A2/GLCTLVAML–reactive T cells stained positively for IFN-γ, and 86% of the cells stained positively for MIP1 β (Figure 4, c and d). The frequency of antigen-specific T cells that secreted these cytokines/chemokines was always less than 100% and could be as low as 30%. Increasing the concentration of added peptide to greater than 10 μM or adding anti-CD28 mAb to the cultures did not affect the results. Even when peptide-pulsed autologous lymphoblastoid B-cell lines (LCLs) were used to stimulate PBMCs, clear populations of antigen-specific T cells failed to secrete IFN-γ or MIP1 β. In patient 122, after stimulation of PBMCs by LCLs prepulsed with 10 μM GLCTLVAML peptide, only 33% and 69% of HLA-A2/GLCTLVAML tetramer–reactive T cells expressed detectable intracellular IFN-γ and MIP1 β respectively (Figures 4, g and h). The EBV-transformed LCL also express other EBV antigens, explaining the secretion of IFN-γ and MIP1 β by CD8+ T cells that do not react with the HLA-A2/GLCTLVAML tetramer in these assays.
Figure 4.
Cytokine secretion by EBV-specific T cells during the primary immune response. PBMCs from HLA-A2+ individuals with IM (NS120 and NS122) were stained with the HLA-A2/GLCTLVAML tetrameric complex. PBMCs from NS120 were then cultured in vitro for 6 hours in the absence (a and b) or the presence (c and d) of 10 μM GLCTLVAML peptide in R10 supplemented with rIL-2. PBMCs from NS122 were cultured in vitro for 6 hours in the absence (e and f) or presence (g and h) of an autologous lymphoblastoid B-cell line (at a ratio of 1 B cell/1 PBMC) prepulsed with 10 μM GLCTLVAML peptide in R10 supplemented with rIL-2. Brefeldin A was added to the cultures after the first hour. Cells were surface-stained with an anti-CD8 mAb, fixed, permeabilized, and stained for intracellular IFN-γ (a, c, e, and g) or MIP1 β (b, d, f, and h). Only CD8+ T cells were included in the analyses. The frequency (%) of tetramer-reactive T cells that stained positively with mAb’s specific for IFN-γ or MIP1 β is shown.
The experiments show clear functional heterogeneity within the antigen-specific T-cell pool during the primary immune response. We were unable to detect secretion of IL-4 by the cells after stimulation, suggesting that failure to secrete IFN-γ did not reflect a Tc2 phenotype (data not shown). The most likely explanation is that the non–cytokine-secreting cells were functionally “exhausted” or “anergic”, perhaps reflecting recent or recurrent stimulation in vivo (2, 7). In support of this we have found recently that the majority of the clonally expanded population of V β 22–expressing, HLA-A2/GLCTLVAML tetramer–reactive, CD8+ T cells in patient NS60 did not express IFN-γ after stimulation with GLCTLVAML peptide in vitro (data not shown). High antigen dose, chronicity of infection, and a lack of CD4+ T-cell help may be implicated in such a loss of effector function. The development of large populations of functionally compromised cells during a primary viral infection may delay effective control of infection and is potentially dangerous. There are, however, additional or alternative explanations for functional heterogeneity. The cells that do not secrete cytokines may be in an early state of differentiation and have yet to gain full effector function. Lastly, such cells might be a part of a distinct population that does not gain full effector function during the primary response but that does differentiate to form a future memory population. Whatever the explanation, this work shows that an in vivo primary response is not composed of a homogenous population of functional effector cells and that investigation of such responses using tetramers alone or cytokine assays alone will give an incomplete or misleading picture.
The majority of EBV antigen–specific T cells from patients with primary EBV infection are programmed to die.
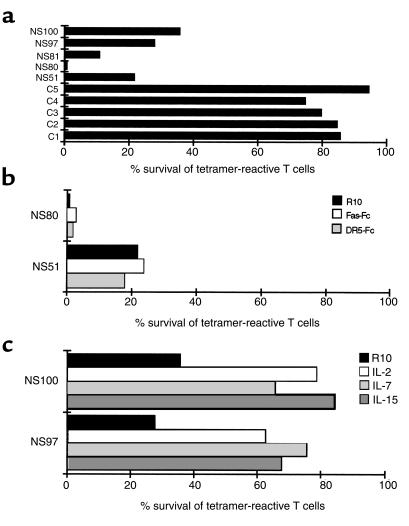
We went on to determine the fate of the antigen-specific CD8+ T cells that mediated the primary response to EBV in our patients and to investigate mechanisms that might be involved in the downregulation of the response and the establishment of T-cell memory. Analysis of PBMCs from our patients 1 year after primary infection showed a fall in the overall number of CD8+ T cells (mean of 4.8-fold) together with a fall in frequency within the contracted CD8+ T-cell compartment of RAKFKQLL-specific T cells in HLA-B8+ donors to between 2.7 and 7.3% CD8+ T cells and of GLCTLVAML-specific T cells in HLA-A2+ donors to between 1.3 and 5.5% CD8+ T cells. In one donor this was equivalent to the loss of 95% of the antigen-specific T cells present in peripheral blood during the primary response. The death of most antigen-specific T cells mediating the primary response is a critical immunoregulatory mechanism whereby an optimally responsive peripheral T-cell repertoire is reestablished after infection. To investigate susceptibility to death of antigen-specific T cells mediating a primary response after a fall in antigen load, we incubated PBMCs from IM patients for 30 hours in R10 in vitro in the absence of added antigen or cytokine stimulation. The majority of EBV antigen-specific T cells taken from individuals suffering from primary EBV infection died during 30 hours in culture (Figure 5a). Over this time these cells exposed phosphatidylserine at the surface, downregulated TCR and CD8, and fragmented their DNA. These experiments show that the majority of these antigen-specific cells are programmed to die rapidly by apoptosis. Importantly, in control experiments we found that the majority (75–95%) of EBV antigen–specific CD8+ T cells from healthy EBV seropositive donors survived 30 hours in these culture conditions (Figure 5a).
Figure 5.
Death of antigen-specific T cells taken from patients with primary EBV infection. (a) PBMCs from HLA-A2+ (NS80, NS81, NS97) and HLA-B8+ (NS51, NS100) individuals with IM and from HLA-A2+ (C1, C3, C4) and HLA-B8+ (C2, C5) healthy EBV-seropositive individuals were cultured for 30 hours in R10. The frequency of live CD8+ T cells that reacted with the HLA-A2/GLCTLVAML or HLA-B8/RAKFKQLL tetrameric complexes as a proportion of the total lymphocytes was calculated at 0 hours and 30 hours. Survival (%) of the tetramer-reactive T cells at 30 hours is shown. (b) PBMCs from an HLA-A2+ (NS80) and HLA-B8+ (NS51) individual with IM were cultured in R10, in R10 in the presence of 100 ng/ml Fas-Fc fusion protein, or in R10 in the presence of 500 ng/ml DR5-Fc fusion protein for 30 hours. Survival (%) of the tetramer-reactive T cells is shown. (c) PBMCs from an HLA-A2+ (NS97) and HLA-B8+ (NS100) individual with IM were cultured in R10, in R10 in the presence of 50 U/ml rIL-2, 100 ng/ml rIL-7 or 100 ng/ml rIL-15. Survival (%) of the tetramer-reactive T cells is shown.
The EBV antigen-specific T cells from patients with IM express the death receptor Fas (data not shown). We cultured PBMCs from patients with IM in R10 for 30 hours in the presence and absence of Fas-Fc fusion protein. Fas-Fc did not protect antigen-specific T cells from patients with IM from death (Figure 5b), although it did prevent the death of Fas-expressing Jurkat cells induced by the Fas ligand–transfected IA12 cell line. Thus the interaction between Fas ligand and Fas is not required for the death of the antigen-specific T cells primed in vivo. A DR5-Fc fusion protein likewise failed to protect antigen-specific T cells from patients with IM from death (Figure 5b), suggesting that the interaction between TNF-related apoptosis-inducing ligand (TRAIL) and its receptors (18, 32, 36) is also not required for the death of these cells.
We went on to analyze the second major pathway of apoptotic death, the pathway characterized by release of cytochrome c from mitochondria. Bcl-2 protects cells from apoptosis and exerts its effect predominantly on cells dying via the mitochondrial pathway of death (37). We found that Bcl-2 is often downregulated within the antigen-specific T cells from patients with IM (data not shown), suggesting that the cells might be susceptible to death via a mitochondrial pathway. Cytokines that signal through the common γ chain can rescue cells from death mediated via this pathway (38, 39). We therefore cultured PBMCs from IM patients in the presence and absence of IL-2, IL-7, and IL-15. These cytokines improved survival of antigen-specific T cells (Figure 5c) and protected against all features of cell death, including TCR and CD8 downregulation, DNA fragmentation, and changes in cell permeability and size. Thus, in the absence of antigen or exogenous cytokines, the majority of antigen-specific T cells from patients with IM are programmed to die via a mitochondrial/cytokine rescuable pathway of apoptotic death.
T-cell selection during the evolution of memory in vivo.
Small populations of EBV-specific T cells do survive the downregulation of the immune response in vivo and form a memory population of T cells. We wished to define the relationship between the T cells that mediated the strong primary response to EBV and those that survived to mediate the long-term memory response, in the hope that such an analysis would help elucidate the pathway by which T-cell memory develops. In five HLA-B8+ and five HLA-A2+ patients we compared the TCR repertoire of T cells specific for the RAKFKQLL and GLCTLVAML epitopes in samples of PBMCs taken during the primary immune response with that of T cells specific for these epitopes in samples of PBMCs taken 1 year later. Results from four donors are shown in Figure 2. The BV22- and BV7-expressing T cells that dominated the primary response to the RAKFKQLL epitope in patients NS52 and NS60, respectively, were less dominant within the memory response. Likewise, the expanded populations of BV11- and BV22-expressing T cells that dominated the primary response to the GLCTLVAML epitope in patients NS33 and NS60 were subdominant in the memory response to this epitope. There were therefore clear differences between TCR use of antigen-specific T cells mediating the primary and memory responses, with the TCR V β chains selected most strongly, in a given individual, during the primary immune response to an EBV antigen, being relatively less dominant within the memory pool of T cells specific for the same antigen and with different TCR V chains being used instead. Notably, where the relative frequency of T cells expressing a particular BV chain rose in the memory, compared with the primary response to a given epitope, calculations of the numbers of antigen-specific T cells using that BV chain based on the fall in the total numbers of CD8+ T cells and the fall in frequency of the epitope-specific T cells within the CD8+ T-cell compartment, showed that the absolute numbers had fallen.
The possibility that the loss of dominant peaks within the TCR repertoire of the memory population is an artifact resulting from increased nonspecific binding of tetramer to T cells in PBMCs from the follow-up samples compared with the primary samples is unlikely. Control experiments performed using these tetramers have confirmed their specificity (4, 6) and, in particular, have shown that they do not bind significant populations of T cells in PBMCs from healthy EBV-seronegative individuals (4, 6, and data not shown).
In some individuals we found that relatively few of the antigen-specific T cells reacted with our panel of TCR V region–specific mAb’s, suggesting that TCRs using other variable chains (e.g., BV4) might be important components of the response.
We wanted to know whether the clonotypes that dominated the primary response had effectively been deleted (high zone tolerance) (23, 40, 41) or whether they were present, albeit at much lower frequency. We therefore sorted B8/RAKFKQLL-reactive T cells from donor NS60 and A2/GLCTLVAML-reactive T cells from PBMCs taken from donors NS33 and NS60 1 year after primary infection and derived the sequences of the TCR β chains of the BV7S1-, BV11-, and BV22-expressing T cells (respectively) within the relevant antigen-specific T-cell population. We found that the repertoire of BV7S1-expressing T cells mediating the memory response to RAKFKQLL in donor NS60 was similar to that of the BV7S1-expressing T cells mediating the primary response (Table 2). Likewise, we found that the small populations of BV11- and BV22-expressing T cells involved in the memory response to the GLCTLVAML epitope in patients NS33 and NS60 included T cells expressing β chains identical to those found in the primary response (Table 3 and Table 4). The results therefore show that the clonotypes that had been massively expanded during the primary response in these donors were still detectable in the memory response, albeit at much lower frequencies. Thus, while these clones have been heavily culled during the establishment of memory, we do not find evidence in these individuals to support the idea that the dominant components of the response have actually been deleted.
The results we report differ from those described by previous investigators. The majority of studies investigating the relationship between primary and memory T-cell responses have concluded that the repertoire of cells that mediates these responses is similar or identical and that memory T cells are selected stochastically from the primary population (20, 22, 24, 26). There are also studies that support the hypothesis that, in some circumstances, further clonal selection may occur, perhaps on the basis of TCR affinity or specificity, in the presence of persistent or recurrent exposure to antigen (19, 21, 25). Other reports suggest that deletion of T cells mediating the primary response may occur, resulting in long-term failure to control antigen load (2, 40, 41). It is possible that a limited form of deletion, involving only certain clones, may explain results from yet further studies that show that the clonal compositions of primary and memory responses may be different (23). The conflicting results may reflect differences in the experimental systems used and differences between CD4+ and CD8+ responses. In murine studies, analysis of TCR use of ex vivo populations of antigen-specific T cells has been limited by difficulties in obtaining sufficient cells from a mouse on two different occasions. In studies of human T-cell responses, investigation of the relationship between primary and memory responses has relied heavily on analysis of antigen-specific T-cell clones derived from peripheral blood at two different time points and is therefore subject to biases introduced by in vitro culture conditions. Furthermore, much of the work has focused on responses where TCR use of antigen-specific T cells is restricted and conserved between donors (19, 20, 24). Such responses are relatively unusual and conclusions derived from the study of these responses may not be widely applicable. The major advantages of this study are that we have been able to analyze the repertoire of antigen-specific T cells in vivo during primary and memory responses in the same donors in the context of a natural antigenic challenge. The use of TCR V chain–specific mAb’s in conjunction with HLA/peptide tetrameric complexes has allowed us to quantify subpopulations of antigen-specific T cells, and the use of V region–specific PCR performed on cDNA from sorted populations of tetramer-reactive CD8+ T cells has allowed us to analyze the clonality of the responses in some detail. The results show that the repertoire of the memory response may be constrained by the relative depletion of T-cell clonotypes, which have preferentially expanded during the primary response.
Models for the development of T-cell memory.
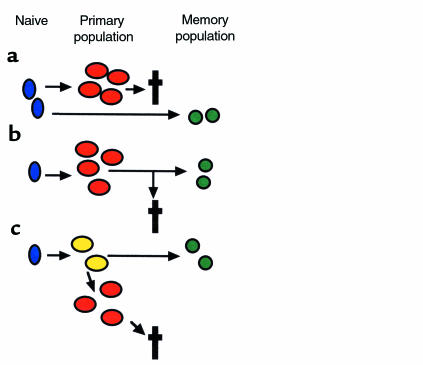
The differences we observed between the composition of primary and memory responses shed light on the possible pathway by which T-cell memory is established. Many theoretical models for the development of T-cell memory have been proposed. Three of these are shown in Figure 6. The first model involves parallel but separate pathways of differentiation for primary and memory cells, with T cells mediating the primary and memory responses being derived from different naive T cells (Figure 6a). This model predicts that the TCR use of the primary and memory populations of cells would not be closely related. Our study clearly shows that the same T-cell clones are involved in primary and memory responses to antigen in vivo and argues strongly against this type of model. The second is a form of linear differentiation model (Figure 6b). Naive T cells are stimulated to differentiate into a primary population. During the downregulation of the primary response, memory cells are selected from the expanded primary population. The selection of cells entering the memory pool might be stochastic or might be based on affinity or specificity. This type of linear differentiation model would predict that the TCR use of primary and memory cells would be closely related (identical if selection were stochastic and increasingly restricted in memory if continuing selection on the basis of affinity or specificity occurred). We did find clear similarities between TCR use by antigen-specific T cells involved in the primary and memory responses in vivo. However, the repertoire of the memory population of cells did not precisely reflect that of the primary population, and we did not observe narrowing of the repertoire of responding cells. The model therefore needs to be modified to take into account the relative depletion of the dominant primary clonotypes in memory. This can be done in the context of a branched differentiation model where one proposes the existence of an intermediate cell type, which we have referred to here as the “core cell population.” We suggest that these cells are antigen experienced and have the capacity to divide vigorously to form an “expanded primary population”, which then dies, and also to differentiate into a memory population, which survives (Figure 6c). Massive expansion of a particular clone during the primary response would deplete the core cell population of that clonotype such that it would be under-represented in memory. In some cases this process might actually result in the loss of a clonotype from the memory population (physical exhaustion). Further studies are required to define the phenotypic and functional properties of the putative core cell population. However, the functional heterogeneity we observed in the primary response in vivo would be consistent with the idea that T cells in different states of differentiation (e.g., core cells and a more highly differentiated “expanded population”) might contribute to the primary population. The model would also be consistent with other work suggesting that only a subgroup of cells present during a primary immune response is destined to survive into memory (42) and that the requirements for induction of full effector or memory function may be different (43).
Figure 6.
Models for the development of T-cell memory. (a) Primary and memory populations of T cells may derive from different naive precursors. The TCR use of the primary and memory populations would not be closely related. (b) Naive T cells differentiate to form a primary population. A minority of these cells persist into memory, while the majority die. The TCR use of the memory population would be identical to, or possibly more restricted than, that of the primary population. (c) Naive T cells differentiate to form an intermediate core cell from which both an expanded primary population (destined to die) and a memory population may derive. The TCR use of the memory population would be similar to that of the primary population, but relative depletion of the clonotypes most expanded during the primary response might occur.
In conclusion, this study provides the most detailed analysis to date of the clonal composition, functional properties, and downregulation of the primary immune response to a natural virus infection. The work highlights the extraordinary potency of the primary cytotoxic T-cell response and sheds light on factors that influence the downregulation of the response and the development of T-cell memory.
Acknowledgments
This work was supported by grants from the Medical Research Council. We are grateful to A. Rickinson for helpful discussion, to P. Marrack for the gift of the H131 and H132 hybridoma, to X. Xu and J. Monkgolsapaya for the gift of Fas-Fc and DR5-Fc fusion protein, and to A. Patterson, T. Boyce, and general practitioners in Oxfordshire for their help with recruiting patients.
References
- 1.Butz EA, Bevan MJ. Massive expansion of antigen-specific CD8+ T cells during an acute virus infection. Immunity. 1998;8:167–175. doi: 10.1016/s1074-7613(00)80469-0. [DOI] [PMC free article] [PubMed] [Google Scholar]
- 2.Gallimore A, et al. Induction and exhaustion of lymphocytic choriomeningitis virus-specific cytotoxic T lymphocytes visualized using soluble tetrameric major histocompatibility complex class I-peptide complexes. J Exp Med. 1998;187:1383–1393. doi: 10.1084/jem.187.9.1383. [DOI] [PMC free article] [PubMed] [Google Scholar]
- 3.Murali-Krishna K, et al. Counting antigen-specific CD8+ T cells: a reevaluation of bystander activation during viral infection. Immunity. 1998;8:177–187. doi: 10.1016/s1074-7613(00)80470-7. [DOI] [PubMed] [Google Scholar]
- 4.Callan MFC, et al. Direct visualization of antigen-specific CD8+ T cells during the primary immune response to Epstein Barr Virus in vivo. J Exp Med. 1998;187:1395–1402. doi: 10.1084/jem.187.9.1395. [DOI] [PMC free article] [PubMed] [Google Scholar]
- 5.Tan L, et al. A re-evaluation of the frequency of CD8+ T cells specific for EBV in healthy virus carriers. J Immunol. 1999;162:1827–1835. [PubMed] [Google Scholar]
- 6.Callan MFC, et al. Large clonal expansions of CD8+ T cells in acute infectious mononucleosis. Nat Med. 1996;2:906–911. doi: 10.1038/nm0896-906. [DOI] [PubMed] [Google Scholar]
- 7.Zajac A, et al. Viral immune evasion due to persistence of activated T cells without effector function. J Exp Med. 1998;188:2205–2212. doi: 10.1084/jem.188.12.2205. [DOI] [PMC free article] [PubMed] [Google Scholar]
- 8.Tierney R, Steven N, Young L, Rickinson A. Epstein-Barr virus latency in blood mononuclear cells; analysis of viral gene transcription during primary infection and in the carrier state. J Virol. 1994;68:7374–7385. doi: 10.1128/jvi.68.11.7374-7385.1994. [DOI] [PMC free article] [PubMed] [Google Scholar]
- 9.Parijs L, Peterson D, Abbas A. The Fas/Fas ligand pathway and Bcl2 regulate T cell responses to model self and foreign antigens. Immunity. 1998;8:265–274. doi: 10.1016/s1074-7613(00)80478-1. [DOI] [PubMed] [Google Scholar]
- 10.Singer G, Abbas A. The Fas antigen is involved in peripheral but not thymic deletion of T lymphocytes in T cell receptor transgenic mice. Immunity. 1994;1:365–371. doi: 10.1016/1074-7613(94)90067-1. [DOI] [PubMed] [Google Scholar]
- 11.Sytwu H, Liblau R, McDevitt H. The roles of Fas/APO-1 (CD95) and TNF in antigen-induced programmed cell death in T cell receptor transgenic mice. Immunity. 1996;5:17–30. doi: 10.1016/s1074-7613(00)80306-4. [DOI] [PubMed] [Google Scholar]
- 12.Zimmermann C, Rawiel M, Blaser C, Kaufman M, Pircher H. Homeostatic regulation of CD8+ T cells after antigen challenge in the absence of Fas (CD95) Eur J Immunol. 1996;26:2903–2910. doi: 10.1002/eji.1830261215. [DOI] [PubMed] [Google Scholar]
- 13.Brunner T, et al. Cell-autonomous Fas (CD95)/Fas-ligand interaction mediates activation induced apoptosis in T cell hybridomas. Nature. 1995;373:441–444. doi: 10.1038/373441a0. [DOI] [PubMed] [Google Scholar]
- 14.Dhein J, Walczak H, Braumler C, Debatin K, Krammer P. Autocrine T cell suicide mediated by APO-1/Fas (CD95) Nature. 1995;373:438–441. doi: 10.1038/373438a0. [DOI] [PubMed] [Google Scholar]
- 15.Ju S, et al. Fas (CD95)/FasL interactions required for programmed cell death after T cell activation. Nature. 1995;373:444–448. doi: 10.1038/373444a0. [DOI] [PubMed] [Google Scholar]
- 16.Zheng L, et al. Induction of apoptosis in mature T cells by tumour necrosis factor. Nature. 1995;377:348–351. doi: 10.1038/377348a0. [DOI] [PubMed] [Google Scholar]
- 17.Hildeman D, et al. Reactive oxygen species regulate activation induced T cell apoptosis. Immunity. 1999;10:735–744. doi: 10.1016/s1074-7613(00)80072-2. [DOI] [PubMed] [Google Scholar]
- 18.Wiley SR, et al. Identification and characterization of a new member of the TNF family that induces apoptosis. Immunity. 1995;3:673–682. doi: 10.1016/1074-7613(95)90057-8. [DOI] [PubMed] [Google Scholar]
- 19.McHeyzer-Williams MG, Davis MM. Antigen-specific development of primary and memory T cells in vivo. Science. 1995;268:106–111. doi: 10.1126/science.7535476. [DOI] [PubMed] [Google Scholar]
- 20.Maryanski JL, Jongeneel CV, Bucher P, Casanova JL, Walker PR. Single-cell PCR analysis of TCR repertoires selected by antigen in vivo: a high magnitude CD8 response is comprised of very few clones. Immunity. 1996;4:47–55. doi: 10.1016/s1074-7613(00)80297-6. [DOI] [PubMed] [Google Scholar]
- 21.Bachmann MF, Speiser DE, Ohashi PS. Functional maturation of an antiviral cytotoxic T-cell response. J Virol. 1997;71:5764–5768. doi: 10.1128/jvi.71.8.5764-5768.1997. [DOI] [PMC free article] [PubMed] [Google Scholar]
- 22.Silins SL, et al. Selection of a diverse TCR repertoire in response to an Epstein Barr virus encoded transactivator protein BZLF1 by CD8+ cytotoxic T lymphocytes during primary and persistent infection. Int Immunol. 1997;9:1745–1756. doi: 10.1093/intimm/9.11.1745. [DOI] [PubMed] [Google Scholar]
- 23.Pantaleo G, et al. Evidence for rapid disappearance of initially expanded HIV-specific CD8+ T cell clones during primary HIV infection. Proc Natl Acad Sci USA. 1997;94:9848–9853. doi: 10.1073/pnas.94.18.9848. [DOI] [PMC free article] [PubMed] [Google Scholar]
- 24.Callan MFC, et al. T cell selection during the evolution of CD8+ T cell memory in vivo. Eur J Immunol. 1998;28:4382–4390. doi: 10.1002/(SICI)1521-4141(199812)28:12<4382::AID-IMMU4382>3.0.CO;2-Z. [DOI] [PubMed] [Google Scholar]
- 25.Busch DH, Pilip I, Palmer EG. Evolution of a complex T cell receptor repertoire during primary and recall bacterial infection. J Exp Med. 1998;188:61–70. doi: 10.1084/jem.188.1.61. [DOI] [PMC free article] [PubMed] [Google Scholar]
- 26.Sourdive JD, et al. Conserved T cell receptor repertoire in primary and memory CD8 T cell responses to an acute viral infection. J Exp Med. 1998;188:71–82. doi: 10.1084/jem.188.1.71. [DOI] [PMC free article] [PubMed] [Google Scholar]
- 27.Altman JD, et al. Phenotypic analysis of antigen-specific T lymphocytes. Science. 1996;275:94–96. [Google Scholar]
- 28.Scotet E, et al. T cell response to Epstein-Barr virus transactivators in chronic rheumatoid arthritis. J Exp Med. 1996;184:1791–1800. doi: 10.1084/jem.184.5.1791. [DOI] [PMC free article] [PubMed] [Google Scholar]
- 29.Bogedain C, Wof H, Modrow S, Stuber G, Jilg W. Specific cytotoxic T lymphocytes recognize the immediate-early transactivator Zta of Epstein-Barr virus. J Virol. 1995;69:4872–4879. doi: 10.1128/jvi.69.8.4872-4879.1995. [DOI] [PMC free article] [PubMed] [Google Scholar]
- 30.Steven N, Leese AM, Annels NE, Lee SP, Rickinson AB. Epitope focusing in the primary cytotoxic T cell response to Epstein Barr Virus and its relationship to T cell memory. J Exp Med. 1996;184:1801–1813. doi: 10.1084/jem.184.5.1801. [DOI] [PMC free article] [PubMed] [Google Scholar]
- 31.Xu X, et al. Evasion of cytotoxic T lymphocyte responses by nef-dependent induction of Fas ligand (CD95L) expression on simian immunodeficiency virus-infected cells. J Exp Med. 1997;186:7–16. doi: 10.1084/jem.186.1.7. [DOI] [PMC free article] [PubMed] [Google Scholar]
- 32.Screaton G, Mongkolsapaya J, Xu X, Cowper A, McMichael AJ, Bell JI. TRICK2, a new alternatively spliced receptor that transduces the cytotoxic signal from TRAIL. Curr Biol. 1997;7:693–696. doi: 10.1016/s0960-9822(06)00297-1. [DOI] [PubMed] [Google Scholar]
- 33.Steven N, et al. Immediate early and early lytic cycle proteins are frequent targets of the Epstein-Barr virus induced cytotoxic T cell response. J Exp Med. 1997;185:1605–1617. doi: 10.1084/jem.185.9.1605. [DOI] [PMC free article] [PubMed] [Google Scholar]
- 34.Misko I, et al. Crossreactive recognition of viral, self and bacterial peptide ligands by human class I-restricted cytotoxic T lymphocyte clonotypes. Implications for molecular mimicry in autoimmune disease. Proc Natl Acad Sci USA. 1999;96:2279–2284. doi: 10.1073/pnas.96.5.2279. [DOI] [PMC free article] [PubMed] [Google Scholar]
- 35.Argaet VP, et al. Dominant selection of an invariant T cell antigen receptor in response to persistent infection by Epstein-Barr virus. J Exp Med. 1994;180:2335–2340. doi: 10.1084/jem.180.6.2335. [DOI] [PMC free article] [PubMed] [Google Scholar]
- 36.Mongkolsapaya J, et al. Lymphocytes inhibitor of TRAIL (TNF-related apoptosis-inducing ligand): a new receptor protecting lymphocytes from the death ligand TRAIL. J Immunol. 1998;160:3–6. [PubMed] [Google Scholar]
- 37.Kluck R, Bossy-Wetzel E, Green D, Newmeyer D. The release of cytochrome c from mitochondria: a primary site for Bcl-2 regulation of apoptosis. Science. 1997;275:1132–1126. doi: 10.1126/science.275.5303.1132. [DOI] [PubMed] [Google Scholar]
- 38.Boise L, Minn A, June C, Lindsten T, Thompson C. Growth factors can enhance lymphocyte survival without committing the cell to undergo cell division. Proc Natl Acad Sci USA. 1995;92:5491–5495. doi: 10.1073/pnas.92.12.5491. [DOI] [PMC free article] [PubMed] [Google Scholar]
- 39.Akbar A, et al. Interleukin-2 receptor common gamma-chain signaling cytokines regulate activated T cell apoptosis in response to growth factor withdrawal: selective induction of anti-apoptotic (bcl-2, bcl-xl) but not pro-apoptotic (bax, bcl-xs) gene expression. Eur J Immunol. 1996;26:294–299. doi: 10.1002/eji.1830260204. [DOI] [PubMed] [Google Scholar]
- 40.Moskophidis D, Laine E, Zinkernagel RM. Peripheral clonal deletion of anti-viral memory CD8+ T cells. Eur J Immunol. 1993;23:3306–3311. doi: 10.1002/eji.1830231237. [DOI] [PubMed] [Google Scholar]
- 41.Moskophidis D, Lechner F, Pircher H, Zinkernagel RM. Virus persistence in acutely infected immunocompetent mice by exhaustion of antiviral cytotoxic effector T cells. Nature. 1993;362:758–761. doi: 10.1038/362758a0. [DOI] [PubMed] [Google Scholar]
- 42.Jacob J, Baltimore D. Modelling T cell memory by genetic marking of memory T cells in vivo. Nature. 1999;399:593–597. doi: 10.1038/21208. [DOI] [PubMed] [Google Scholar]
- 43.Liu Y, Wenger R, Zhao M, Nielsen P. Distinct costimulatory molecules are required for the induction of effector and memory cytotoxic T lymphocytes. J Exp Med. 1997;185:251–262. doi: 10.1084/jem.185.2.251. [DOI] [PMC free article] [PubMed] [Google Scholar]


