Abstract
We outline a paradigm for meta-microarray database creation and integration with clinical variables. We use as our implementation example a breast cancer database linking RNA expression measurements (by microarray) and clinical variables, such as survival metrics and tumor size. Such an endeavor involves integrating across different microarray datasets as well as clinical parameters. To this end, we created a data curation and processing pipeline, formal database ontology, and SQL schema to optimally query, analyze and visualize data from over 30 publicly available breast cancer microarray studies listed in the Gene Expression Omnibus (GEO). We demonstrate several pilot examples using this database. This methodology serves as a model for future meta-analyses of complex public clinical datasets, in particular those in the field of cancer.
Introduction
While meta-analysis studies using genomic measurements (either RNA or DNA) are on the rise, most disease-specific meta-analyses that integrate multiple publicly available datasets fail to harness the full potential of these datasets. In the field of breast cancer, a widely studied disease, genomic meta-analyses tend to focus on only one dimension of the available data. As an example, recent studies have explored re-clustering patients for novel subtypes and single signatures that relate one type of breast cancer patient to survival1,2. Past examples of clinical measurements successfully related to molecular measurements include the linking of liver cancer gene expression to CT imaging features, and gliablastoma multiforme (GBM) gene expression with Magnetic Resonance (MR) image features3,4. However, these molecular measurements were available from the same institution, and neither example incorporates data first deposited into public repositories.
A broad search for “breast cancer” in NCBI’s Gene Expression Omnibus (GEO) database returns well over 30,000 available samples. This enormous database of human tissue, xenograft samples, and cell lines could provide immense potential to answer countless medical questions, if properly organized and harnessed and linked to clinical features.
The complexity – and ambiguity – of such massive amounts of data can prove daunting even to the most seasoned biomedical informatician. Beyond just “omics” data such as mRNA expression levels, samples excised directly from a patient are often accompanied by important clinical parameters, such as tumor size, treatment regimen, and survival metrics. While expression data may hold undiscovered quantitative patterns across different patients, this clinical data holds the key to producing clinically actionable, and therefore, relevant, meta-analyses. Thus, in order to build a searchable meta-database that integrates biological and clinical data, one needs clear methods for processing the biological data and semantic normalization of clinical parameters in addition to an overarching database schema.
This study uses the example of a breast cancer database that integrates microarray gene expression and clinical parameters, specifically for patients with treatment information and treatment response and/or long-term survival outcomes. Our analysis differs from previous work on biomarkers of breast cancer treatment because such studies tend to use only 1–2 sets of clinical data and a single treatment protocol. For example, biomarkers have been explored for chemotherapy, hormone therapy and specific subtypes of cancer, such as lymph node negative breast cancer5,6,7,8. Some studies compare two types of treatment, such as tamoxifen or letrozole9. Additionally, recent studies focused on well-curated databases such as The Cancer Genome Atlas (TCGA) hold rich cross-platform analyses, but currently lack outcomes metrics measured beyond 17 months10. Conversely, the minimum number of months for relapse measurement in our database is 36 months, with many patient measurements as long as 120 months.
We provide guiding principles for analyzing the microarray data, semantically normalizing patients, and creating a MySQL database schema that allows for flexible queries across different patient subsets.
Methods
Gene Expression Processing
The majority of RNA microarray datasets were collected from the National Center for Biotechnology (NCBI) Gene Expression Omnibus (GEO), a public functional genomics data repository that supports standardized data following the Minimum Information About a Microarray Experiment (MIAME) protocol11. Public samples from the European Genome-phenome Archive (EGA) were also included.
Using the GEO DataSets Advanced Search Builder, we conducted a query to retrieve only microarray expression samples directly excised from human patients, such as biopsies. This returned 158 datasets; a manual curation of these 158 datasets was then conducted to select datasets with either pathological complete response (pCR) or long-term outcomes such as Overall Survival (OS) or Disease-Free Survival (RFS). Among these remaining datasets, only datasets describing the treatment protocol were selected for our database. This, along with the EGA datasets retrieved in a similar fashion, resulted in 30 datasets and 4,923 patient samples.
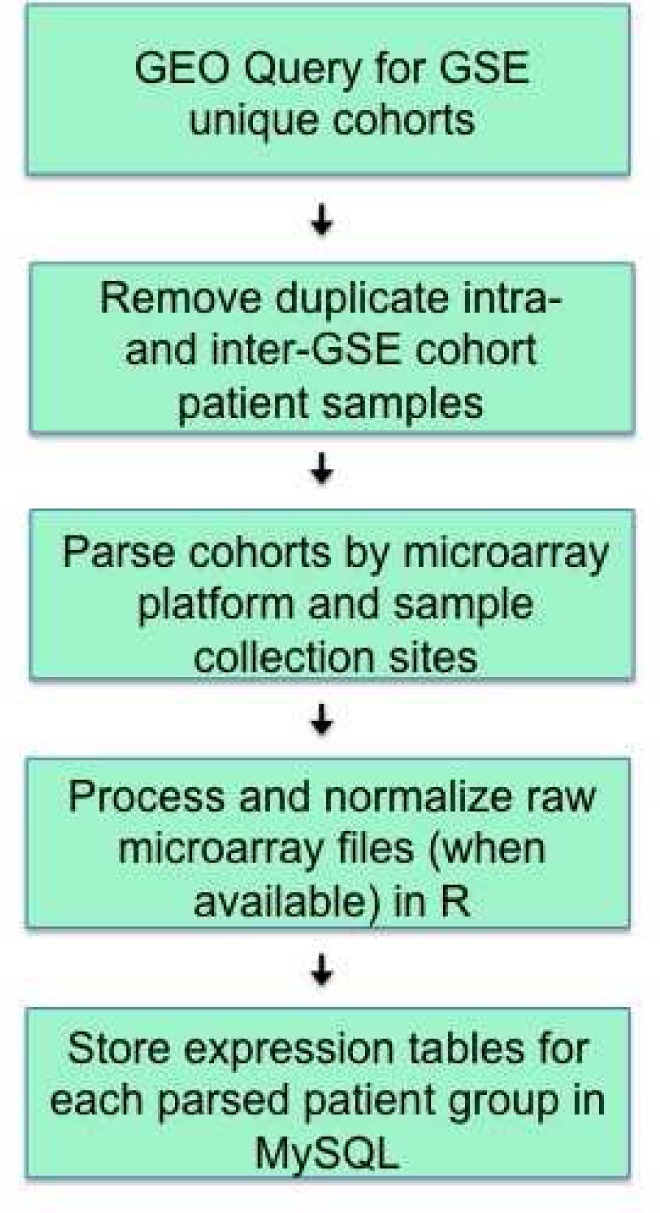
We next followed a general heuristic to pre-process and analyze all the microarray data. The workflow is outlined in Figure 1. After selecting the final 30 datasets, microarray files for each patient were downloaded. Most steps outlined are standard to any microarray analysis; however, a meta-analysis introduces two new steps that are critical to the final expression values: analysis of samples measured across different arrays, and handling of samples collected from different sites but included in the same GEO dataset. Large datasets in GEO, whether from retrospective searches through a hospital’s tissue bank or a clinical trial, often cull together samples measured on different arrays or from different sites.
Figure 1.

Pipeline for meta-microarray analysis across GEO cohorts.
Each type of array was clearly indicated by the GEO Platform (GPL) identifier. However, the study site was often only indicated by the GEO sample file name or in the GEO Series Matrix file. The Series Matrix file contained all clinical parameters, and oftentimes included the original site ID for the patient. It was quite clear if patients were collected from different sites by the original site ID prefix. The corresponding PubMed publication also often confirmed multiple sites. Because samples may have been handled differently at different sites, we treated patient samples from different site locations as distinct populations and normalized these patient sub-populations separately.
Using Series Matrix data also enabled us to parse out patients with multiple samples across time points. The unique sample GSM ID alone did not link samples to the same physical organism. Thus, a variable in the MySQL database was created to note the number of days post-treatment the sample was collected (zero days indicated the biopsy was taken pre-treatment.) If there were duplicate samples for the same time point, only one was catalogued. This microarray sample curation process could greatly impact effect sizes across cohorts, and thus any final biomarker analysis.
After identifying appropriate normalization groups, raw data was re-processed when available. We background corrected and normalized all datasets using the robust multi-array average (RMA) method. RMA has proven a robust method, particularly for Affymetrix arrays, and is available in most R microarray analysis packages12.
Clinical Parameters
The processed and normalized microarray data is only the beginning of an integrated clinical database. As previously mentioned, most GEO GSE cohort studies with patient samples also contained linked clinical data. This data generally contains standard clinical variables such as tumor size, age, and outcomes variables. However, the labels used for each variable vary widely, due to different laboratory, institutional, and international protocols.
One example is receptor status in breast cancer; estrogen (ER) receptor status is a common measurement. However, ER can be measured via various assays, some binary, some on a 0–3 scale. In our database, such measurements were catalogued both with the original data format, and also a semantically normalized 0/1 binary variable. Thus, we can still query across all patients whether they were ER positive (1) or negative (0), regardless of the original assay.
For this breast cancer database, we sought the advice of breast cancer surgeons, oncologists, and radiologists from multiple institutions. Ideally, this would help facilitate the correct cataloguing of data, and also a database structure that corresponds to meaningful issues the clinical community is already discussing, such as how to treat patients who have triple-negative (negative ER, PR, HER2 status) tumors.
Discussions with clinicians also elucidated data discrepancies that needed to be catalogued. For example, one clinician noted that the sample quality from a population-based cohort versus a clinical trial can vary widely. Population-based analyses are often conducted by retrieving decades-old frozen samples, while clinical trials analyze the gene expression data with a few weeks of surgical excision. Thus, a binary MySQL variable was added to indicate the type of study.
Results
The data curation steps were manual and time-intensive, taking 400 person-hours to process 30 public experiments totalling 4923 microarrays. While it is readily apparent the importance of standardizing clinical variable terms, the careful normalization of microarray subgroups also provided critical to removing bias. The statistical effects introduced by different study sites or platform arrays can prove significant in meta-analysis.
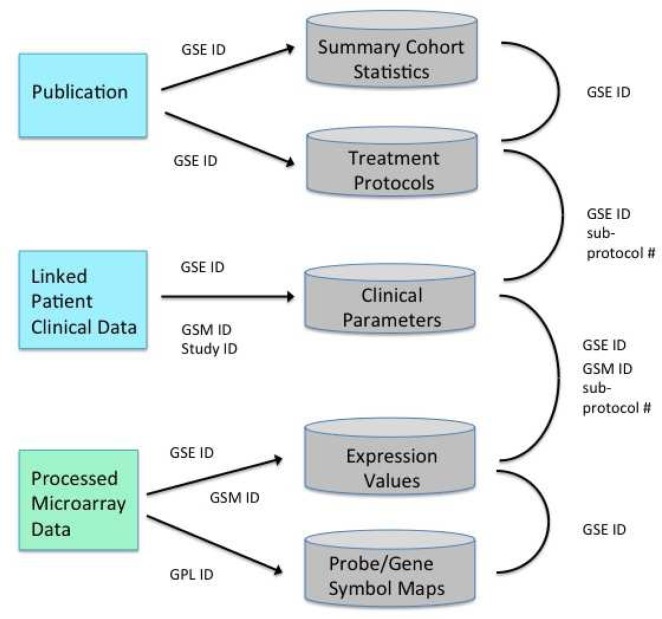
The final MySQL database schema, with the corrected microarray data and semantically normalized clinical variables, is displayed below in Figure 3. There is a separate per-patient clinical table, master cohort-level table, a global cohort summary table for publication-based summary statistics, and a treatment regimen table containing drug names and length of treatment. The global summary statistics information can prove useful if not all patient-specific parameters are provided; at a minimum, one can ascertain if the cohort is balanced across various parameters. All these tables are linked by unique keys, such as the GEO GSE cohort ID, the GSE sample-specific GSM ID and the provided original study ID. Processed expression is also stored in separate tables; they can be accessed via the GSE cohort ID and then the sample-specific GSM ID.
Figure 3.
Final integrated database schema. Unique keys for each MySQL table, such as GSE or GSM IDs, provided by GEO, allow for linkage of the patient-level microarray and clinical data to summary statistics published from the PubMed articles reporting the original analyses from each dataset.
Our database currently contains 4923 patient records; 592 patients have pCR records recording treatment response immediately after all therapy was completed, and 4331 have long-term relapse and/or disease-free survival records for at least 3 years. We have data on patients from various cancer stages, hormone receptor status, and lymph node status. It also includes various combinations of radiotherapy, chemotherapy, and endocrine/hormone treatment protocols.
These clinical variables now enable exploration across breast cancer sub-groups and treatment protocols, an important consideration because breast cancer is highly heterogeneous. A preliminary gene expression analysis across all patients provided genes with significant False Discovery Rate (FDR) values, but insignificant p-values for over- or under-expression across all datasets. Future analysis of breast cancer subcategories within the database will provide more robust gene expression analyses.
Conclusion
We showed here that important molecular measurements and clinical information on thousands of breast cancer patients can be successfully obtained from public deidentified repositories, enabling novel molecular meta-analyses to answer important questions about treatments and responses. The results of our planned meta-analyses could have a significant impact on treatment decisions, due to the large number of patients and the rich and varied documentation of treatment protocols. We next plan to explore gene expression signatures based on hormone receptor status, in particular triple-negative breast cancers, an especially heterogeneous and lethal subtype13. Additionally, the recent breast cancer TCGA paper in Nature outlines 4 subtypes based on key genes from an integrative analysis combing DNA copy number, DNA methylation, exome sequencing, microRNA sequencing, and reverse-phase protein arrays10. However, this database does not yet contain long-term outcomes as the patients are still being followed. We plan to subtype the samples in our database using the publication’s corresponding genes and then explore predictive biomarkers for these 4 subtypes for both treatment response and long-term outcomes. Public data meta-analyses have proved a robust method for novel biomarker discovery in other clinical fields like organ transplantation14.
The combination of different cohorts provides a robust method to eliminate non-specific signals in our analysis of biomarkers. The identification of genes significantly regulated in more than 30 different clinical trials is a convincing argument. By identifying appropriate normalization groups among microarray datasets, semantically normalizing variables, constructing a coherent database ontology, and an integrated MySQL schema, we have provided a paradigm for effectively standardizing public data to allow for various queries across multiple data types and thousands of patients.
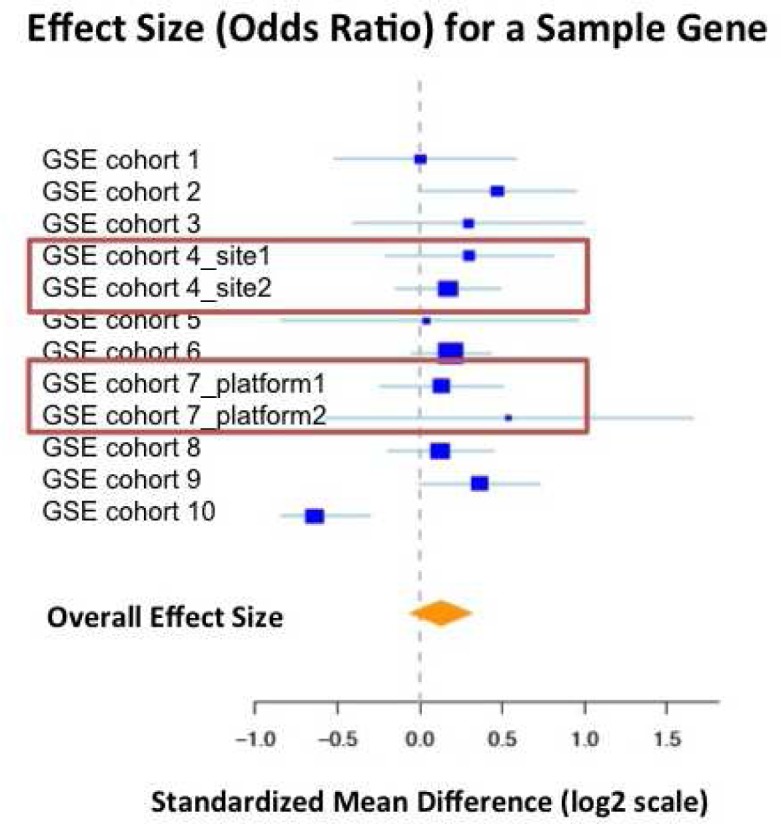
Figure 2.

One arbitrarily chosen gene is displayed on this forest plot, with actual measurement data. The plot displays relative strength of the effect of a gene’s differential expression on differentiating between case (relapsed) and control (no relapse) patients. Boxes past the zero log2 axis indicate a gene is over-expressed in case patients; the greater the distance from the zero log2 axis, the greater the signal. The blue squares are effect size strength for a single normalized microarray group with confidence interval bars, and the gold diamond is a summary statistic for the strength of this gene’s signal across all datasets. The red boxes couple normalized groups that were initially listed as a single group in GEO, but were normalized separately for this study.
References
- 1.Lehmann BD, Bauer JA, Chen X, Sanders ME, CHakravarthy AB, Shyr Y, Pietenpol JA. Identification of human triple-negative breast cancer subtypes and preclinical models for selection of targeted therapies. J Clin Invest. 2011;121(7):2750–67. doi: 10.1172/JCI45014. [DOI] [PMC free article] [PubMed] [Google Scholar]
- 2.van’t Veer LJ, Dai H, van de Vijver MJ, He YD, Hart AAM, Mao M, et al. Gene expression profiling predicts clinical outcome of breast cancer. Nature. 2001;415:530–36. doi: 10.1038/415530a. [DOI] [PubMed] [Google Scholar]
- 3.Segal E, Sirlin CB, Ooi C, Adler AS, Gollub J, Chen X, et al. Decoding global gene expression programs in liver cancer by noninvasive imaging. Nat Biotechnol. 2007;25(6):675–80. doi: 10.1038/nbt1306. [DOI] [PubMed] [Google Scholar]
- 4.Diehn M, Nardini C, Wang DS, McGovern S, Jayaraman M, Liang Y, et al. Identification of noninvasive imaging surrogates for brain tumor gene-expression modules. Proc Natl Acad Sci U.S.A. 2008;105(13):5213–18. doi: 10.1073/pnas.0801279105. [DOI] [PMC free article] [PubMed] [Google Scholar]
- 5.Li Y, Zou L, Haibe-Kains B, Tian R, Li Y, Desmedt C, et al. Amplification of LAPTM4B and YWHAZ contributes to chemotherapy resistance and recurrence of breast cancer. Nature Medicine. 2010;16(2):214–18. doi: 10.1038/nm.2090. [DOI] [PMC free article] [PubMed] [Google Scholar]
- 6.Hatzis C, Pusztai L, Valero V, Booser DJ, Esserman L, Vidaurre T, et al. A Genomic Predictor of Response and Survival following taxane-anthracycline chemotherapy for invasive breast cancer. JAMA. 2011;305(18):1873–81. doi: 10.1001/jama.2011.593. [DOI] [PMC free article] [PubMed] [Google Scholar]
- 7.Desmedt C, Giobbie-Hurder A, Neven P, Paridaens R, Christiaens MR, Smeets A, et al. BMC Biomedical Genomics. 2009;2(40) doi: 10.1186/1755-8794-2-40. [DOI] [PMC free article] [PubMed] [Google Scholar]
- 8.Karlsson E, Delle U, Danielsson A, Olsson B, Abel F, Karlsson P, et al. Gene expression variation to predict 10-year survival in lymph-node-negative breast cancer. BMC Cancer. 2008;8(254) doi: 10.1186/1471-2407-8-254. [DOI] [PMC free article] [PubMed] [Google Scholar]
- 9.The Breast International Group (BIG) 1–98 Collaborative Group A comparision of letrozole and tamoxifen in postmenopausal women with early breast cancer. The New England Journal of Medicine. 2005;353(6):2747–57. doi: 10.1056/NEJMoa052258. [DOI] [PubMed] [Google Scholar]
- 10.The Cancer Genomic Atlas Network Comprehensive molecular portraits of human breast tumours. Nature. 2012 doi: 10.1038/nature11412. advance online publication. [DOI] [PMC free article] [PubMed] [Google Scholar]
- 11.Barrett T, Edgar R. Gene Expression Omnibus (GEO): Microarray data storage, submission, retrieval, and analysis. Methods Enzymol. 2006;411:352–69. doi: 10.1016/S0076-6879(06)11019-8. [DOI] [PMC free article] [PubMed] [Google Scholar]
- 12.Irizarry RA, Hobbs B, Collin F, Antonelli KJ, Scherf U, Speed TP. Exploration, normalization, and summaries of high density oligonucleotide array probe level data. Biostatistics. 2003;4(2):249–64. doi: 10.1093/biostatistics/4.2.249. [DOI] [PubMed] [Google Scholar]
- 13.Irshad S, Ellis P, Tutt A. Molecular heterogeneity of triple-negative breast cancer and its clinical implications. Curr Opin Oncol. 2011;23(6):566–77. doi: 10.1097/CCO.0b013e32834bf8ae. [DOI] [PubMed] [Google Scholar]
- 14.Chen R, Sigdel T, Li L, Kambham N, Dudley J, Hsieh S, et al. Differentially expressed RNA from public microarray data identifies serum protein biomarkers from cross-organ transplant rejection and other conditions. PLOS Computational Biology. 2010;6(9) doi: 10.1371/journal.pcbi.1000940. [DOI] [PMC free article] [PubMed] [Google Scholar]


