

Abstract
By using pseudorabies virus expressing green fluorescence protein, we found that efferent bone marrow–neural connections trace to sympathetic centers of the central nervous system in normal mice. However, this was markedly reduced in type 1 diabetes, suggesting a significant loss of bone marrow innervation. This loss of innervation was associated with a change in hematopoiesis toward generation of more monocytes and an altered diurnal release of monocytes in rodents and patients with type 1 diabetes. In the hypothalamus and granular insular cortex of mice with type 1 diabetes, bone marrow–derived microglia/macrophages were activated and found at a greater density than in controls. Infiltration of CD45+/CCR2+/GR-1+/Iba-1+ bone marrow–derived monocytes into the hypothalamus could be mitigated by treatment with minocycline, an anti-inflammatory agent capable of crossing the blood-brain barrier. Our studies suggest that targeting central inflammation may facilitate management of microvascular complications.
Diabetes is responsible for 60% of all deaths worldwide and is one of the world’s major causes of premature illness and death (World Health Organization, http://www.who.int/mediacentre/factsheets/fs312/en, last accessed September 10, 2013). Vascular complications, including cardiovascular disease, diabetic retinopathy and neuropathy, and kidney failure, are largely responsible for the marked risk of premature death seen in individuals afflicted with diabetes. Chronic hyperglycemia leads to pathological characteristics of both the peripheral and central nervous systems (CNS).1 Oxidative stress, abnormal lipid metabolism, impaired vascular reactivity with reduced blood flow, and neuroinflammation have been implicated in the pathogenesis of both peripheral neuropathy and CNS disease associated with diabetes.2 Although the origins of this neuroinflammation are incompletely understood, both local and systemic inflammatory cells are believed to contribute to these pathological characteristics.
A functional link between the sympathetic nervous system (SNS) and bone marrow cells has long been appreciated,3 and the regulation of inflammatory cell release from the bone marrow is part of normal immunosurveillance.4 By modulating the immune system, the SNS influences the pathophysiological characteristics of a wide spectrum of diseases, including cardiovascular diseases.5 Direct sympathetic innervation of the immune organs, including bone marrow, spleen, and lymph nodes,6 and increased splenic sympathetic nerve activity, induced by angiotensin II infusion in the CNS, have been shown to enhance the splenic immune response.7 In conditions such as neurogenic hypertension, the paraventricular nucleus (PVN) of the hypothalamus (HYPO) exhibits sympathetic hyperactivity that is associated with neuroinflammation.5,8 In contrast, stimulation of the vagus nerve exerts anti-inflammatory effects by decreasing levels of the inflammatory cytokines and suppressing the activation of immune cells.9
Although, in health, the release of bone marrow cells into the circulation is dynamically and precisely regulated, in disease, this release can be altered.10 We have previously shown that, in diabetes, the circadian pattern of hematopoietic stem cell (HSC) release is dampened and phase shifted.11 The regulation of leukocyte generation and hematopoiesis as a whole is achieved by intimate intracellular interactions between developing blood cells and stromal elements, which release cytokines in response to neural stimulation.12 This direct cellular association between bone marrow stromal cells, HSCs, and nerve terminals is described as the neuroreticular complex.12 Within the healthy bone marrow compartment, there exists an optimal balance between lymphoid and myeloid differentiation of HSCs, producing 10% myeloid and 90% lymphoid cells. However, with aging, for example, this balance shifts toward more myeloid and fewer lymphoid cell types.13–15 Changes in hematopoiesis and immune function associated with aging have, in the past, been correlated with regression of neural innervations from the marrow.16
Circulating monocytes are divided into two subsets: one expresses Ly6C/Gr-1 at high levels (Ly6Chi), representing 50% to 60% of the monocyte pool in steady state and which is a potent inflammatory mediator (proinflammatory subset), and the other expresses Ly6C at low levels. Ly6Clo monocytes are termed resident or homeostatic because they traffic through noninflamed tissues, perform surveillance functions, and resolve inflammation.17 Cysteine chemokine ligand 2 (CCL2) is a chemoattractant that increases monocyte release from bone marrow, facilitates monocyte accumulation at the vessel wall and transmigration across microvascular endothelial cell layers, and attracts cysteine chemokine receptor 2+ (CCR2+) monocytes into inflamed tissue.18–22 Increased expression of CCL2 mRNA has been seen in the retina and kidney of diabetic mice.23 Based on the expression of the receptor for CCL2 (CCR2), mouse Ly6Chi are CCR2+ monocytes, whereas Ly6Clo are characterized as CCR2−.
In this study, we examined the impact of type 1 diabetes (T1D) on bone marrow and CNS. We studied the following: i) the connections between bone marrow and the CNS using pseudorabies virus (PRV)–tracing studies; ii) the contribution of bone marrow–derived cells in CNS neuroinflammation using a time course study of gfp chimeric mice made diabetic with streptozotocin (STZ); iii) the phenotype of the cells in specific CNS regions using flow cytometry and the expression of cytokines in these same regions; iv) changes in peripheral nerves innervating the bone marrow, cytokine expression within the bone marrow, and cellular composition of the bone marrow; and v) the effect of minocycline, an anti-inflammatory agent capable of crossing the blood-brain barrier (BBB), on neuroinflammation in T1D mice.
Materials and Methods
Human Studies
The study was approved by University of Florida (Gainesville) Institutional Review Board 407-2010. All study subjects signed an informed consent. To accomplish our studies, patients were brought into the Center for Translational Science Institute for 48 hours. During the first 24 hours, patients were evaluated, and on the evening of the first day, a heparin lock was placed. During the second 24 hours, the patients had 1 mL of blood removed every 2 hours and this blood was used for fluorescence-activated cell sorter analysis to enumerate the monocytes. Both diabetic (n = 3) and nondiabetic (n = 3) patients were examined.
Patient Characteristics
Patients were chosen based on the diagnosis of type 1 diabetes based on clinical history and fasting C-peptide level of <0.1 nmol/L. The daily insulin dose for these individuals was a total 45 ± 13 U per day, with basal insulin units of 22 ± 7 and hemoglobin A1C of 7.0 ± 0.4. Controls were deemed healthy and matched for age and sex to the diabetic subjects.
Inclusion Criteria
Those aged between 21 and 65 years were eligible to participate.
Exclusion Criteria
The exclusion criteria were as follows: i) evidence of ongoing acute or chronic infection (HIV, hepatitis B or C, or tuberculosis); ii) ongoing malignancy; iii) cerebral vascular accident or cerebral vascular procedure; iv) current pregnancy; v) history of organ transplantation; vi) presence of a graft; vii) uremic symptoms, an estimated glomerular filtration rate of <20 mL/minute (by a Modification of Diet in Renal Disease equation), or an albumin level of <3.6 (to avoid malnutrition as a confounding variable); viii) smoking history; and ix) anemia.
Animals
Male Wistar rats were obtained from Charles River (Wilmington, MA). C57Bl6 mice and transgenic mice homozygous for green fluorescent protein (GFP+) were obtained from the Jackson Laboratory (Bar Harbor, ME), and housed in the institutional animal care facilities at the University of Florida. All animals were treated in accordance with the Guiding Principles in the Care and Use of Animals (NIH, Bethesda, MD) and the Association for Research in Vision and Ophthalmology Statement for the Use of Animals in Ophthalmic and Vision Research. All experiments were approved by the Institutional Animal Care and Use Committee of the University of Florida.
Experimental Diabetes
Experimental diabetes was induced as previously described.24,25 C57Bl/6J mice (Jackson Laboratory), aged 7 to 10 weeks, were rendered diabetic with five consecutive daily 55 mg/kg i.p. injections of STZ freshly dissolved in citrate buffer (pH 4.5). For rats, a single injection of 60 mg/kg was used. Development of diabetes (defined by a blood glucose level of >250 mg/dL) was verified 1 week after the first STZ injection (Glucometer Elite XL; Bayer Corp, Elkhart, IN). Glycemic control was estimated on multiple occasions from the measurement of glycohemoglobin, using either a glacated hemoglobin assay (Glyc-Affin; PerkinElmer, Norton, OH) or a glycohemoglobin assay (Helena Glyco Tek Laboratory, Beaumont, TX). Diabetes was confirmed 1 week after induction by measuring the blood glucose level. A minimum of four animals were examined for each time point. A second group of animals was induced with T1D and fed either minocycline-supplemented chow (1 g/kg of food) or control chow (Purina Mills, Gray Summit, MO) at 14 days after T1D induction and sacrificed at 10 weeks. The relative density of ionized calcium-binding adapter molecule 1 (Iba-1)+ microglia/macrophages was determined in the HYPO and compared with T1D mice without minocycline treatment and age-matched control animals.
Tissue Processing
After confirmed diabetes of durations 4, 8, 12, 35, and 42 weeks, diabetic animals and age-matched controls were deeply anesthetized and perfused intracardiac with PBS, followed by 4% paraformaldehyde in 0.1 mol/L PB. Brains were immersion fixed overnight, followed by cryoprotection in 20% sucrose/PB and mounted in optimal cutting temperature compound. Serial cross sections of brains (20 μm thick) were cut on a cryostat and mounted. Retinal whole mounts were prepared at 35 weeks after diabetes induction26 and examined using immunohistochemistry (IHC).
Immunofluorescence Histochemistry
Slides and/or whole mounts were reacted with Iba-1 (Wako, Osaka, Japan) for visualization of microglia/macrophages27; and with biotinylated Griffonia simplicifolia (Bandeiraea) isolectin B4 (GS lectin; Sigma-Aldrich, St. Louis, MO) for endothelial cells and activated microglia/macrophages. The tissues were washed and transferred to species-specific secondary antibodies conjugated with either Alexa594 or Alexa488 (Invitrogen–Molecular Probes, Carlsbad, CA). The sections and whole mounts were then examined under either epifluorescence or spinning-disc confocal microscopy.
Quantitative Analysis of Iba-1+ Microglia/Macrophages
Iba-1+ microglia/macrophage density at 4, 8, 12, 35, and 42 weeks after diabetes induction was examined in the HYPO, granular insular cortex (GIC), and basal nuclear region (BN) of the brain, as well as Iba-1+ microglia/macrophage densities in retinal whole mounts from diabetic and control mice. For each region or tissue, three or more images were taken from different sections for analysis. The density of Iba-1+ microglia/macrophages was quantified using ImageJ software version 1.43u (NIH, Bethesda, MD). To account for variation, the density of Iba-1+ microglia was normalized by dividing by the mean values of age-matched controls in the same region or tissue, and expressed as the percentage of relative densities for each animal.
Quantitative Analysis of Iba-1+ Alone, Iba-1+/GFP+ Microglia/Macrophages, and GFP+ Alone Bone Marrow Cells
To count all positive cells in different focal planes in the same areas, the positive cells were counted while under microscopic observation. For Iba-1+ alone, Iba-1+/GFP+, and GFP+ alone cells, sequential captures on each (for CY3, CY3/fluorescein isothiocyanate, and fluorescein isothiocyanate) plane were made. The relative density was determined for each group, and a mean and SE were determined, where P < 0.05 indicated significant differences using one tailed t-tests.
Quantitative Analysis of c-Fos
The polyclonal rabbit anti–c-Fos antibody (sc-52; Santa Cruz Biotechnology, Santa Cruz, CA) and mouse anti-neuronal nuclei (NeuN, monoclonal antibody 377; Chemicon, Temecula, CA) were used for these studies. Four mice from each group (control, diabetic 12 weeks, and diabetic + minocycline) were used and three to four images were taken from each mouse (×10 magnification confocal images; 0.9 × 0.9 mm). The density of c-fos+ cells was quantified using ImageJ software.
Results
Diabetes Reduces Sympathetic Neuronal Connections to the Bone Marrow
To examine the connections between the bone marrow and the CNS, PRV–GFP was administered into the bone marrow cavity of normal nondiabetic mice. Time course studies of neuronal labeling after bone marrow injection with PRV-152 showed spinal cord cells labeled within 24 to 48 hours, brainstem nuclei at 3 to 4 days, and hypothalamic nuclei at 6 days, supporting a polysynaptic-specific brain-bone circuit. Intense CNS labeling was seen 7 days after bone marrow injection. Retrograde transport of the virus produced labeling in SNS-associated nuclei, including the PVN (Supplemental Figure 1A), nucleus tractus solitarii (Supplemental Figure 1B), rostral ventrolateral medulla (Supplemental Figure 1C), caudal raphe, and noradrenergic nuclei of the subfornical organ (Supplemental Figure 1D). Our data show a clear polysynaptic link between brain and bone marrow. It is known that the virus replicates in the soma and travels only in a retrograde direction; thus, the brain regions labeled are efferent systems that maintain heterosynaptic connections with the bone marrow.
Because of the small size of the bone marrow cavity of mice, viral-tracing patterns were confirmed in nondiabetic rats to control for possible leakage during murine injections. Rats showed robust GFP labeling in the PVN (Figure 1A). To assess the impact of T1D diabetes on the bone marrow CNS connections, T1D rats with 2 months’ duration of disease received an injection of PRV-GFP into the bone marrow cavity (Figure 1B). Quantitation of GFP+ neurons in the age-matched control and diabetic groups (Figure 1C) showed reduced numbers of GFP-labeled neurons in the PVN (P < 0.05) of the diabetic rat, supporting the loss of innervation and presence of peripheral neuropathy associated with the bone marrow.
Figure 1.
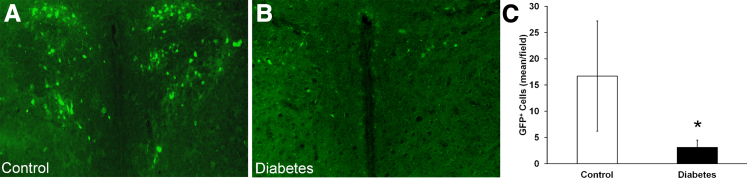
Tracing with GFP-labeled pseudo rabies virus (PRV) shows neural connections between the sympathetic nervous system (SNS) and bone marrow in rats. Injection of PRV-152 GFP into the bone marrow (BM) of the femur in rats shows differential tracing with disease state. Control rats (A) show robust GFP labeling in the PVN compared with type 1 diabetics rats (B). C: Diabetic rats show fewer GFP-labeled neurons in the PVN. ∗P < 0.05.
Diabetic Loss of Neural Control in Bone Marrow Alters Neurotransmitter Balance and Changes Hematopoiesis toward Generation of Monocytes
To further characterize the reduced neural projections, we examined the bone marrow using IHC of neurotransmitters. In 2-month-old T1D rats, tyrosine hydroxylase–positive axons were reduced by 37% (P < 0.05); however, there were no significant differences in calcitonin gene-related peptide, acetylcholine, somatostatin, and vasoactive intestinal peptide (Figure 2, A–K). We next examined levels of proinflammatory cytokines in the bone marrow supernatant of mice with 1 and 9 months of diabetes and compared levels with age-matched control mice. Notably, there were age-related changes [specifically, an age-related decrease in IL-1β, IL-3, and IL-10 and an age-related increase in IL-6 and tumor necrosis factor α (TNF-α)]. In diabetes, the reduction in neurotransmitters was associated with an increase in IL-1β and TNF-α (Figure 3A). Age-related decreases were observed in stromal cell-derived factor-1, stem cell factor, granulocyte colony-stimulating factor (G-CSF), and insulin-like growth factor-1 (IGF-1) (Figure 3B) in the bone marrow supernatant. In the diabetic mice, we observed an increase in vascular endothelial growth factor and G-CSF and a decrease in IGF-1 at 9 months of T1D when compared with age-matched controls. An age-related decrease in both matrix metalloprotease (MMP)-2, required for mobilization of cells from the bone marrow, and MMP-9 was observed. Both MMP-2 and MMP-9 were decreased at 1 month of T1D compared with age-matched controls (Figure 3C), and MMP-9 was decreased in the diabetic mice at 9 months compared with age-matched controls.
Figure 2.

Key neurotransmitters in bone marrow are reduced in type 1 diabetic rats. Calcitonin gene-related peptide (CGRP) was reduced by 29% in control (A) compared with diabetes (B; not significant), tyrosine hydroxylase (TH) was reduced by 37% in control (C) compared with diabetes (D; P < 0.05), acetylcholine (Ach) was slightly increased by 9% in control (E) compared with diabetes (F), somatostatin was reduced by 13% in control (G) compared with diabetes (H), and vasoactive intestinal peptide (VIP) was reduced by 13% in control (I) compared with diabetes (J). K: Quantitative data.
Figure 3.

Cytokines/growth factors measured in bone marrow supernatant by ELISA. Diabetes results in alteration in the levels of cytokines and growth factors in bone marrow supernatant. The bone marrow supernatant of 1- and 9-month diabetic and age-matched control mice was analyzed. A: Age-related changes were observed (specifically, an age-related decrease in IL-1β, IL-3, and IL-10 and an age-related increase in IL-6 and TNF-α. In diabetes, the reduction in neurotransmitters was associated with an increase in IL-1β and TNF-α. B: Age-related decreases were observed in stromal-derived factor-1 (SDF-1), stem cell factor (SCF), granulocyte colony stimulating factor (G-CSF), and IGF-1. In the diabetic mice, an increase in vascular endothelial growth factor (VEGF) and G-CSF and a decrease in IGF-1 at 1 month of T1D were observed. C: An age-related decrease in both MMP-2 and MMP-9 was observed. Both MMP-2 and MMP-9 were decreased at 1 month of T1D compared with age-matched controls, and MMP-9 was decreased in the diabetic mice at 9 months compared with age-matched controls. *P < 0.05 for diabetes compared with age-matched control; †P < 0.05 for 9-month control compared with 1-month control; and ‡P < 0.05 for 9-month diabetes compared with 1-month diabetes. n.d., not done.
To determine whether there is a functional alternation in brain–bone marrow communication, we examined the circadian release pattern of bone marrow cells into the circulation of diabetic rodents and human subjects compared with controls. Twenty-four hour sampling of peripheral blood of T1D rats (Figure 4A) showed monocytosis throughout the entire period. This circadian pattern was associated with a phase shift in the peak of monocytes in T1D rats compared with age- and sex-matched controls, suggesting that CNS-controlled neural signals regulating monocyte mobilization are altered in diabetes. These findings in diabetic rats were corroborated in a small cohort of human T1D subjects (Figure 4B).
Figure 4.

Twenty-four hour monitoring of peripheral blood showed an increase in the numbers of monocytes in the circulation and a phase shift in peak levels in diabetes. Twenty-four hour monitoring of peripheral blood of type 1 diabetic rats (PT; A) and diabetic humans and controls (B) was performed. In both rats and humans, diabetes was associated with more monocytes in the circulation and a phase shift in peak levels compared with age- and sex-matched controls, suggesting that diurnal-controlled neural signals influenced monocyte mobilization and were altered in diabetes. The monocytes were plotted by individual points and a cosine function–fitted curve for rats (A), and by individual points with a line conjugated for each human patient and a fitted curve derived from a nonlinear mixed-effects model with cosine function (B). WBC, white blood cell; ZT, Zeitgeber time.
Diabetes Results in an Accumulation of Bone Marrow–Derived Inflammatory Cells in the Sympathetic Regions of the CNS
To determine whether the observed systemic monocytosis had any consequences in the CNS, we assessed the contribution of bone marrow–derived cells to CNS inflammation in T1D and control mice by generating bone marrow–GFP+ chimeric mice and examining them for CNS inflammation. Iba-1 was used as a marker for macrophage/microglia activation, the intensity of which increases in activated microglia.28 Sections were collected from the most rostral extension of the PVN to the most caudal aspect, and within each section the areas quantified for microglia activation included all subdivisions of the PVN, the lateral hypothalamus, the anterior hypothalamic area, and the ventral medial hypothalamic nucleus (collectively termed HYPO). The densities of GFP+/Iba-1+ bone marrow–derived macrophage populations and GFP−/Iba-1+ activated resident microglia were determined in the HYPO, GIC, and BN which served as an adjacent control region (Figure 5, A–I). The sympathetic-associated HYPO and GIC regions were found to show marked inflammation in contrast to the BN region (Figure 5G). GFP+/Iba-1+ cells represent the bone marrow–derived macrophages that have extravasated into the CNS tissue parenchyma and have produced Iba-1+ macrophages (Figure 5, A–F). GFP+/Iba-1+ bone marrow–derived macrophages were compared in control (Figure 5, A–C) and diabetic (Figure 5, D–F) mice. The proportion of Iba-1+/GFP+ bone marrow–derived macrophages, expressed as a percentage of total Iba-1+ macrophages, increased significantly in the HYPO (22.0% versus 4.0%) and GIC (14.1% versus 2.1%) groups at 8 weeks after the induction of diabetes compared with control (P < 0.05) (Figure 5H). No significant differences were observed in BN (3.9% versus 3.0%) between conditions. Thus, in T1D, both activated resident microglia and bone marrow–derived macrophages contribute to inflammation in the sympathetic regions of the CNS.
Figure 5.

Activated resident microglia and GFP+ bone marrow–derived macrophages both contribute to inflammation in the hypothalamus (HYPO) and granular insular cortex (GIC) in type 1 diabetes (T1D). By using chimeric GFP mice, three populations of cells were identified: Iba+ resident microglia/macrophages, GFP+ bone marrow–derived cells and Iba-1+/GFP+ bone marrow–derived macrophages. Representative Iba-1+/GFP+ bone marrow–derived macrophages (arrows) in HYPO of control (A–C) and T1D diabetic (D–F) mice. G: Schematic diagram of a brain section showing the location of the three brain regions analyzed. H: The percentage of Iba-1+/GFP+ bone marrow–derived macrophages as a percentage of total Iba-1+ microglia/macrophages increased significantly in diabetic brains compared with control in HYPO and GIC, but not in the BN. I: Quantitative analysis of the relative density of Iba-1+ cells showed a statistically significant increase in the density of Iba-1+ cells in diabetic versus control brains in HYPO and GIC from 4 to 42 weeks. However, in the BN, the density was not increased at all postinduction time points. Scale bar = 100 μm (in B for images in A–F). ∗P < 0.05.
A time course study was performed to determine whether the changes we observed early in T1D were persistent with longer duration of disease. In the T1D mice, the density of Iba-1+ microglia was significantly increased in the HYPO and GIC (P < 0.05) at all five time points examined (4, 8, 12, 35, and 42 weeks after diabetes induction) (Figure 5I) relative to age-matched controls.
SNS-Associated Brain Regions Exhibit Increased Inflammatory Cytokine Levels
mRNA levels of cytokines were examined in SNS-associated regions that showed increased bone marrow–derived macrophages in diabetes. In mice with 8 weeks of T1D, a 1.4-fold increase in interferon-γ mRNA was found in both the HYPO and GIC (P < 0.05) compared with controls. CCL2 and IL-1β mRNAs were similarly increased, with 2.2-fold (P < 0.05) and 1.6-fold (P < 0.05) increases, respectively, in the HYPO of diabetics compared with controls. However, no changes in IL-6, IL-12, and TNF-α were evident.
Pharmacological Inhibition of Neuroinflammation Pathways with Minocycline Reduces Inflammatory Cell Numbers in SNS Regions
We hypothesize that a CCR2+ monocyte subset contributed to the pool of mononuclear cells in the brain regions affected by diabetes, including the HYPO. To test this, brain regions were dissected and then digested for analysis by FACS.29 Levels of GR-1+, CCR2+, and CD45+ cells are increased in the PVN region of diabetic mice (Figure 6, A–C), and these levels could be decreased by treatment of diabetic mice with minocycline, an anti-inflammatory agent that crosses the BBB (Figure 6, D–F).
Figure 6.

Minocycline reduces monocyte/macrophage infiltration in the diabetic hypothalamus and retina. A–F: Single-cell suspensions made from collagenase-digested tissue were analyzed for CD45+ expression. CD45+-gated events were subsequently analyzed for CCR2+ and GR-1+. Levels of GR-1+/CCR2+ cells are increased in the paraventricular nucleus (PVN) region of diabetic mice (A–C) and are decreased by treatment of diabetic mice with minocycline (D–F). The IHC analysis in the hypothalamus (HYPO) detects the presence of Iba-1+ cells in control (G), untreated type 1 diabetes (T1D) mice at 12 weeks (H), and T1D mice treated with minocycline (I). J: Quantitation of Iba-1+ cell density in control, T1D, and T1D with minocycline showed that the density of Iba-1+ cells increased in diabetes, and minocycline reduced the number of Iba-1+cells in the HYPO to levels observed in control mice. The IHC staining with Griffonia simplicifolia isolectin to detect blood vessels in the retina, and Iba-1+ (red) shows the presence of activated microglia in proximity to retinal blood vessels of control, T1D, and T1D with minocycline mice (K–M). K: Retina of age-matched control mice shows low levels of GS lectin expression on Iba-1+ resting ramified microglia. L: There is marked up-regulation of GS lectin and Iba-1 expression and change in microglial morphological characteristics and increased density in T1D. M: Treatment of T1D mice with minocycline reduced the density of Iba-1+–activated microglia, similar to that observed in control retina. N: Cumulative quantitation of cell density confirms increased Iba-1+ cell density in the retinal vasculature of diabetic mice, which is reduced to the control level with minocycline treatment. ∗P < 0.05. Scale bar = 50 μm (in G and K for images in G–I and K–M).
The brains of diabetic mice treated with minocycline were also examined for the frequency of Iba-1+ macrophages/activated microglia, as assessed by staining and morphological features. The density of Iba-1+ cells increased significantly in T1D mice (Figure 6, G, H, and J). Minocycline treatment in T1D resulted in an 18.3% reduction in Iba-1+ cell density in the HYPO (P < 0.05) (Figure 6, I and J) compared with control mice.
As a known target tissue of diabetic complications, we next examined the retina of T1D mice for the presence of Iba-1+ macrophages/activated microglia. T1D mice showed significantly more Iba-1+ and GS IB4+ double-labeled macrophages/activated microglia (also shown around GS IB4+ blood vessels) compared with control (Figure 6, K, L, and N). Quantitative analysis of Iba-1+ microglia showed that minocycline treatment reduced the numbers of Iba-1+ cells in diabetic animals to those found in age-matched control retina (Figure 6, M and N).
The proto-oncogene, c-Fos, is a regulator of cytokine expression and an important modulator in inflammatory processes.30 In the CNS, there is only a low constitutive level of c-Fos expression in neuronal cells of adult animals under normal conditions.31 However, various extracellular stimuli transiently induce the expression of c-Fos mRNA and protein in mammalian neurons.31 The expression of c-Fos in the CNS also is remarkably increased in T1D rats.30 The increased expression of c-Fos in neurons in diabetic HYPO is thought to contribute to the elevated levels of vasopressin and autonomic dysfunction during diabetes.30 For these reasons, we examined c-Fos expression IHC in the HYPO, a region of the CNS that has polysynaptic connections with bone marrow (Figure 1) and increased neuroinflammation in T1D (Figure 7). The total number of c-Fos–expressing cells, and c-Fos+/NeuN+ cells, was determined in the HYPO of control, T1D, and T1D plus minocycline-treated mice. In control HYPO mice, there were some weakly c-Fos+ cells (Figure 7A). To determine the cell type expressing c-Fos, we undertook double staining for c-Fos and NeuN antigens. Approximately 89% of the c-Fos+ cells were double labeled with NeuN, representing neurons (Figure 7, B and G). c-Fos expression was increased approximately twofold in the HYPO of T1D mice (P < 0.003 versus control), especially in the periventricular region (Figure 7, C, D, and G). In the HYPO of T1D mice treated with minocycline, the density of c-Fos+/NeuN+ cells was significantly reduced when compared with HYPO of untreated T1D mice (P < 0.05) (Figure 7, E–G).
Figure 7.

c-Fos+ expression is increased in type 1 diabetes (T1D), and this increase is partially mitigated by minocycline. The IHC analysis of c-Fos and NeuN labeling in the hypothalamus (HYPO) of control (A and B), untreated type 1 diabetic mice at 12 weeks (C and D), and diabetic mice treated with minocycline (E and F). Two populations of cells were counted in each experimental group: total c-Fos+ cells (arrowheads) and c-Fos+/NeuN+ cells (arrows). c-Fos+ cell density increased in diabetic HYPO, especially in the periventricular region (C and D) whereas minocycline treatment in T1D dampened c-Fos expression in T1D (E and F). G: Minocycline treatment reduced c-Fos+ cell density. Quantitation of c-Fos+ cell density in the three groups confirms that both total c-Fos cells and c-Fos+/NeuN+ neurons are increased in diabetes when compared with control age-matched mice (∗P < 0.003), and minocycline reduced the number of c-Fos+cells in the HYPO significantly lower than that in T1D (∗P < 0.05), but the number was still higher than that found in controls (†P < 0.05). Scale bar = 100 μm (in A for images in A–F). V, position of the third ventricle.
Discussion
In this study, we identify a loss of key neurotransmitters in the bone marrow that is associated with increased inflammatory cytokines and decreased growth factor expression. These critical changes resulted in a shift in hematopoiesis toward generation of predominantly monocytes.32 The bone marrow within the large bones produces new blood cells and stem/progenitor cells, with both the generation and the release of these cells into the circulation being dynamically and precisely regulated by the sympathetic nervous system.10 Previously, we demonstrated that there exists a dramatic reduction in the numbers of sympathetic terminals in the bone marrow in type 2 diabetes.11 In the present study, we show this for T1D mice and rats. This denervation with loss of neurotransmitters and neuropeptides promotes changes in the bone marrow microenvironment associated with increased inflammatory cytokines and decreased growth factor expression (Figure 3). The denervation also changes the circadian pattern of release of bone marrow cells into the circulation and supports changes in neuronal function to the bone marrow.
In diabetic rodents, changes in the diurnal rhythm of monocyte release are observed with both an increase in amplitude of peak release and a phase shift compared with age-matched controls. This same abnormal pattern is observed in the T1D human subjects we studied compared with nondiabetic controls. Blood leukocyte numbers have long been known to exhibit circadian oscillations.33 However, to our knowledge, we are the first to show this distinct difference in diabetes. The current findings are in agreement with our previous published studies showing a disturbed pattern of release of endothelial progenitor cells from the bone marrow in T1D.11 Thus, bone marrow neuropathy shifts hematopoiesis toward fewer vascular progenitors and increased generation of monocytes, which, when released into the peripheral blood, home to brain regions expressing cytokines, such as CCL2. Although we have demonstrated the specificity of the inflammation in regions anatomically connected with the bone marrow, it remains to be determined why these regions respond to hyperglycemia by increasing CCL2 expression. Increased microglia activation and localization in the PVN and centers of the autonomic nervous system are not transient events, but they occur at early (4 to 8 weeks), mid (12 weeks), and late (35 to 42 weeks) stages of diabetes.
In addition to the well-accepted peripheral neuropathy associated with diabetes, there is the involvement of the autonomic nervous system in diabetes, and this condition affects multiple tissues and organ systems.34–36 SNS brain regions have connections with all peripheral organs, and this has been well delineated with the kidney37 and the spleen.38 However, the brain–bone marrow connection has not yet garnered much attention and its involvement in diabetic complications is even less well studied. By using PRV tracing, the presence of polysynaptic bone marrow–SNS connections was demonstrated; however, the number of neurons connecting the bone marrow within the SNS centers is markedly reduced in diabetes, further suggesting the presence of a peripheral neuropathy affecting bone marrow.
The activated microglial response observed in the bone marrow–relevant regions of the SNS may be responsible for the increase in cytokines we observed. Activated microglia are responsible for the production of reactive oxygen species and inducible nitric oxide synthase, which diffuse into adjacent tissues to modulate neural activity and ion channels and reduce BBB integrity.39 Once in the brain, bone marrow–derived cells can have a powerful effect on the resident microglia, as described by Chen et al,40 who showed that defective microglia cause pathological grooming in Hoxb8-mutant mice, and a bone marrow transplant from wild-type mice modified the brain microglia and normalized the pathological grooming of the Hoxb8 mice. Furthermore, Longo et al41 demonstrated that many activated microglia observed in the hippocampus of status epilepticus mice are derived from bone marrow. Thus, there seems to be a two-way communication in which the brain has control of bone marrow hematopoiesis, which can be severely affected by conditions altering the neural pathways involved, and bone marrow–derived microglia can directly affect brain activity to modify peripheral control pathways and behavior.
In our studies, we identified a marked increase in CCR2+ monocytes. The major ligand for CCR2 is CCL2, a chemoattractant that increases monocyte release from the bone marrow, attracts monocytes/macrophages into inflamed tissue, and facilitates their transmigration across the microvascular endothelial cell layers into the brain.20–22 The expression of CCL2 is virtually undetectable in healthy tissue, but is greatly increased in diabetics,23 including in the vitreous of patients with proliferative diabetic retinopathy.42–45 Circulating CCL2 levels are also increased in patients with diabetes.46 Distinct CCL2 genotypes are associated with diabetic microvascular complications.47–49 High glucose treatment of endothelial cells isolated from diabetic subjects resulted in a 40% to 70% increase of CCL2 release, a 10% to 20% increase of the basal expression of vascular cell adhesion molecule-1, and an enhancement of the monocyte-endothelial cell interaction.50 Similarly, 7 days of incubation of human umbilical vein endothelial cells with high glucose increased mRNA expression and the production rate of CCL2 in a time-dependent and concentration-dependent (10 to 35 mmol/L) manner, through up-regulation of reactive oxygen species and subsequent activation of p38 mitogen-activated protein kinase.51 Thus, hyperglycemia promotes increased expression of CCL2. This was validated in vivo in our study because we observed an increase in CCL2 mRNA only in regions of the CNS with direct neuronal connections to the bone marrow.
Our data show that T1D produces elevated c-Fos labeling in the hypothalamus. Although our current study does not identify the precise neuronal mechanisms responsible for elevated cFos, this will be evaluated in future studies. A causal relationship or exact temporal relationship between bone marrow–connected neurons, cFos labeling, and cytokine expression can only be implied. All these end points were measured in brains from different animals because PRV-152 produces inflammation in the regions it labels and would, thus, confound the c-Fos labeling and the cytokine measurements. Nevertheless, our data convincingly show elevated cFos as a result of T1D, brain–to–bone marrow connections, and elevated cytokine expression in T1D. c-Fos expression in the hypothalamus is colocalized with NeuN, indicating that most c-Fos–expressing cells are neurons. In diabetes, neurons in the HYPO can undergo degeneration52 and apoptosis.53 Ultrastructural studies demonstrate that neurons in the HYPO in STZ-induced diabetic rats exhibit distension of rough endoplasmic reticulum, swollen mitochondria, and enhanced electron density of their cytoplasm54,55 and increased arginine, vasopressin, oxytocin, N-methyl-d-aspartate receptor 1, neuronal nitric oxide synthase, and vasopressin expression, but reduced GluR2/3 expression.56 The hypothalamic neuronal changes in diabetes have been suggested to be due to hyperglycemia and hyperosmolality, which triggers an increase in neuronal activity.53 Thus, the increased c-Fos expression that we observed in the neurons in the HYPO may be due to both hyperglycemia and hyperosmolality. c-Fos was found in increased levels in the same brain regions of diabetics that demonstrate connections to the bone marrow.
Our results suggest that neuropathy involving the bone marrow fosters generation of CCR2+ monocytes, whereas the hyperglycemic environment promotes CCL2 expression in the SNS centers. This leads to recruitment of bone marrow–derived cells that respond to these CCL2 gradients, facilitating their extravasation and promoting activation of resident microglia in these regions (Figure 8).
Figure 8.

Schematic of brain–bone marrow communication. Based on our studies and the published literature, we postulate that a two-way communication occurs between the brain and the bone marrow. The sympathetic centers of the brain regulate the release of bone marrow cells into the circulation, and the innervation of stromal cells also regulates hematopoiesis. In T1D, the neural pathways involved are adversely affected, resulting in altered circadian release patterns and the generation of excessive numbers of monocytes. The bone marrow–derived monocytes that express CCR2 can infiltrate the brain, responding to gradients of cysteine CCL2 generated by hyperglycemia-stimulated neurons. The CCR2+ monocytes become activated cells and directly affect brain activity to modify peripheral control pathways. This increase in generation of monocytes results in neuroinflammation targeted to the same brain regions that also influence the release of bone marrow–derived cells in health, with the sympathetic nervous system (SNS) centers generating a feed-forward pattern to the neuroinflammation.
Minocycline treatment resulted in fewer monocytes infiltrating into the HYPO and also fewer activated microglia. Minocycline is a second-generation tetracycline that effectively crosses the BBB.57 It has remarkable neuroprotective qualities in models of cerebral ischemia, traumatic brain injury, and Huntington’s and Parkinson’s diseases.58 Minocycline-mediated neuroprotection is associated with inhibition of caspase-1, caspase-3, and inducible nitric oxide synthase transcriptional up-regulation and activation.59 Inhibitions of p38 mitogen-activated protein kinase and microglial activation have also been associated with minocycline-mediated neuroprotection.59
Minocycline prevented the development of diabetic retinopathy in rodent models.60 Animal studies of the efficacy of minocycline in treating DR in mice show that long-term administration of the drug successfully prevented retinal capillary degeneration in diabetic mice.29 In contrast, doxycycline, which is equally effective at reducing inflammation but does not cross the BBB, did not prevent retinopathy in diabetic rodents.29 Thus, this notion of separating peripheral versus central effects of minocycline has been examined by the comparison of doxycycline (peripheral inhibition) to minocycline (both peripheral and central inhibition), and the results suggest that minocycline was more effective in treatment of diabetic retinopathy. We and others have used minocycline to treat diabetic retinopathy in human subjects. In a cohort of morbidly obese type 2 diabetic subjects, we showed that minocycline treatment improved visual acuity and symptoms associated with painful neuropathy. Minocycline-treated subjects experienced weight loss, reductions in hemoglobin A1C, and improved blood pressures.61
Minocycline has also been successfully used to treat painful diabetic neuropathy,62 and we confirmed this finding in our study of subjects with morbidly obese type 2 diabetes.61 Cukras et al63 showed that minocycline treatment of diabetic subjects with diabetic retinopathy and diabetic macular edema (DME) resulted in improved visual function, reduced central DME, and less vascular leakage. They concluded that inhibition of microglia with oral minocycline may be a promising therapeutic strategy targeting the inflammatory etiology of DME.63 Our current studies have limitations, however, because we do not distinguish between the central and peripheral effects of minocycline, and additional studies need to be performed before therapeutic targeting of central inflammation is conclusive for management of diabetic retinopathy and other diabetic complications.
In summary, our findings lead us to suggest that there is a two-way brain–bone marrow communication. The sympathetic centers of the brain regulate the release of bone marrow cells into the circulation. The innervation of stromal cells within the bone marrow regulates hematopoiesis. In T1D, the neural pathways involved are adversely affected, resulting in altered diurnal release patterns of monocytes and in generation of excessive numbers of monocytes. The bone marrow–derived monocytes that express CCR2 infiltrate the brain, responding to gradients of CCL2 likely generated by hyperglycemia-stimulated neurons. These CCR2+ monocytes become activated cells promoting neuroinflammation in the same sympathetic nervous system regions that regulate release of bone marrow–derived cells.
Acknowledgments
We thank Jane Nappi and Marda Jorgenson for their technical assistance and Dr. Wolfgang Striet (all from University of Florida).
P.H., J.S.T., Y.Y., S.H., S.C., T.S., W.L., J.D., A.D., A.Z., M.T., S.P.M., and D.R.S. conducted research and contributed to writing; and M.E.B., J.V.B., M.K.R., T.C.-L., and M.B.G. directed research and contributed to writing. T.C.-L. and M.B.G. are the guarantors of this work, had full access to all the data, and take full responsibility for the integrity of data and the accuracy of data analysis.
Footnotes
Supported by NIH grants RO1 EY07739, RO1 EY12601, RO1 DK090730-02, RO1 EY018358, and R21 EY021626 (M.B.G.), National Health and Medical Research Council of Australia grant 571100, and Australian Government Department of Innovation, Industry, Science, and Research International Science Linkages Program grant CG130097 (T.C.-L.). P.H. is a Brian M. Kirby Foundation Scholar and Juvenile Diabetes Research Foundation and Macquarie Group Foundation Travel Grant Awardee.
T.C.-L. and M.B.G. contributed equally to this work as senior authors.
Supplemental Data
Neural connections between sympathetic nervous system (SNS) and bone marrow in mice are shown by tracing with GFP-labeled pseudo rabies virus (PRV). PVR tracing: mouse brain sections containing GFP+ neurons after injection of PRV-152 into the bone marrow (BM) of the femur in nondiabetic mice. Bilateral labeling of neurons in the PVN of the hypothalamus (A), the nucleus of the solitary tract (NTS; B), the rostral ventrolateral medulla (RVLM; C), and the subfornical organ (SFO; D). These results show direct connections between the BM and the SNS. Original magnification, ×100.
References
- 1.Reijmer Y.D., van den Berg E., Ruis C., Kappelle L.J., Biessels G.J. Cognitive dysfunction in patients with type 2 diabetes. Diabetes Metab Res Rev. 2010;26:507–519. doi: 10.1002/dmrr.1112. [DOI] [PubMed] [Google Scholar]
- 2.Yates K.F., Sweat V., Yau P.L., Turchiano M.M., Convit A. Impact of metabolic syndrome on cognition and brain: a selected review of the literature. Arterioscler Thromb Vasc Biol. 2012;32:2060–2067. doi: 10.1161/ATVBAHA.112.252759. [DOI] [PMC free article] [PubMed] [Google Scholar]
- 3.Miyan J.A., Broome C.S., Whetton A.D. Neural regulation of bone marrow. Blood. 1998;92:2971–2973. [PubMed] [Google Scholar]
- 4.Massberg S., Schaerli P., Knezevic-Maramica I., Kollnberger M., Tubo N., Moseman E.A., Huff I.V., Junt T., Wagers A.J., Mazo I.B., von Andrian U.H. Immunosurveillance by hematopoietic progenitor cells trafficking through blood, lymph, and peripheral tissues. Cell. 2007;131:994–1008. doi: 10.1016/j.cell.2007.09.047. [DOI] [PMC free article] [PubMed] [Google Scholar]
- 5.Abboud F.M., Harwani S.C., Chapleau M.W. Autonomic neural regulation of the immune system: implications for hypertension and cardiovascular disease. Hypertension. 2012;59:755–762. doi: 10.1161/HYPERTENSIONAHA.111.186833. [DOI] [PMC free article] [PubMed] [Google Scholar]
- 6.Mignini F., Streccioni V., Amenta F. Autonomic innervation of immune organs and neuroimmune modulation. Auton Autacoid Pharmacol. 2003;23:1–25. doi: 10.1046/j.1474-8673.2003.00280.x. [DOI] [PubMed] [Google Scholar]
- 7.Ganta C.K., Lu N., Helwig B.G., Blecha F., Ganta R.R., Zheng L., Ross C.R., Musch T.I., Fels R.J., Kenney M.J. Central angiotensin II-enhanced splenic cytokine gene expression is mediated by the sympathetic nervous system. Am J Physiol Heart Circ Physiol. 2005;289:H1683–H1691. doi: 10.1152/ajpheart.00125.2005. [DOI] [PubMed] [Google Scholar]
- 8.Yi C.X., Tschöp M.H., Woods S.C., Hofmann S.M. High-fat-diet exposure induces IgG accumulation in hypothalamic microglia. Dis Model Mech. 2012;5:686–690. doi: 10.1242/dmm.009464. [DOI] [PMC free article] [PubMed] [Google Scholar]
- 9.Rosas-Ballina M., Olofsson P.S., Ochani M., Valdes-Ferrer S.I., Levine Y.A., Reardon C., Tusche M.W., Pavlov V.A., Andersson U., Chavan S., Mak T.W., Tracey K.J. Acetylcholine-synthesizing T cells relay neural signals in a vagus nerve circuit. Science. 2011;334:98–101. doi: 10.1126/science.1209985. [DOI] [PMC free article] [PubMed] [Google Scholar]
- 10.Mendez-Ferrer S., Lucas D., Battista M., Frenette P.S. Haematopoietic stem cell release is regulated by circadian oscillations. Nature. 2008;452:442–447. doi: 10.1038/nature06685. [DOI] [PubMed] [Google Scholar]
- 11.Busik J.V., Tikhonenko M., Bhatwadekar A., Opreanu M., Yakubova N., Caballero S., Player D., Nakagawa T., Afzal A., Kielczewski J., Sochacki A., Hasty S., Li Calzi S., Kim S., Duclas S.K., Segal M.S., Guberski D.L., Esselman W.J., Boulton M.E., Grant M.B. Diabetic retinopathy is associated with bone marrow neuropathy and a depressed peripheral clock. J Exp Med. 2009;206:2897–2906. doi: 10.1084/jem.20090889. [DOI] [PMC free article] [PubMed] [Google Scholar]
- 12.Yamazaki K., Allen T.D. Ultrastructural morphometric study of efferent nerve terminals on murine bone marrow stromal cells, and the recognition of a novel anatomical unit: the “neuro-reticular complex.”. Am J Anat. 1990;187:261–276. doi: 10.1002/aja.1001870306. [DOI] [PubMed] [Google Scholar]
- 13.Linton P.J., Dorshkind K. Age-related changes in lymphocyte development and function. Nat Immunol. 2004;5:133–139. doi: 10.1038/ni1033. [DOI] [PubMed] [Google Scholar]
- 14.Joussen A.M., Poulaki V., Le M.L., Koizumi K., Esser C., Janicki H., Schraermeyer U., Kociok N., Fauser S., Kirchhof B., Kern T.S., Adamis A.P. A central role for inflammation in the pathogenesis of diabetic retinopathy. FASEB J. 2004;18:1450–1452. doi: 10.1096/fj.03-1476fje. [DOI] [PubMed] [Google Scholar]
- 15.Zheng L., Howell S.J., Hatala D.A., Huang K., Kern T.S. Salicylate-based anti-inflammatory drugs inhibit the early lesion of diabetic retinopathy. Diabetes. 2007;56:337–345. doi: 10.2337/db06-0789. [DOI] [PubMed] [Google Scholar]
- 16.Felten D.L., Felten S.Y., Bellinger D.L., Carlson S.L., Ackerman K.D., Madden K.S., Olschowki J.A., Livnat S. Noradrenergic sympathetic neural interactions with the immune system: structure and function. Immunol Rev. 1987;100:225–260. doi: 10.1111/j.1600-065x.1987.tb00534.x. [DOI] [PubMed] [Google Scholar]
- 17.Geissmann F., Revy P., Brousse N., Lepelletier Y., Folli C., Durandy A., Chambon P., Dy M. Retinoids regulate survival and antigen presentation by immature dendritic cells. J Exp Med. 2003;198:623–634. doi: 10.1084/jem.20030390. [DOI] [PMC free article] [PubMed] [Google Scholar]
- 18.Hinojosa A.E., Garcia-Bueno B., Leza J.C., Madrigal J.L. CCL2/MCP-1 modulation of microglial activation and proliferation. J Neuroinflammation. 2011;8:77. doi: 10.1186/1742-2094-8-77. [DOI] [PMC free article] [PubMed] [Google Scholar]
- 19.Schilling M., Strecker J.K., Ringelstein E.B., Schabitz W.R., Kiefer R. The role of CC chemokine receptor 2 on microglia activation and blood-borne cell recruitment after transient focal cerebral ischemia in mice. Brain Res. 2009;1289:79–84. doi: 10.1016/j.brainres.2009.06.054. [DOI] [PubMed] [Google Scholar]
- 20.Huang D., Wujek J., Kidd G., He T.T., Cardona A., Sasse M.E., Stein E.J., Kish J., Tani M., Charo I.F., Proudfoot A.E., Rollins B.J., Handel T., Ransohoff R.M. Chronic expression of monocyte chemoattractant protein-1 in the central nervous system causes delayed encephalopathy and impaired microglial function in mice. FASEB J. 2005;19:761–772. doi: 10.1096/fj.04-3104com. [DOI] [PubMed] [Google Scholar]
- 21.Semple B.D., Bye N., Rancan M., Ziebell J.M., Morganti-Kossmann M.C. Role of CCL2 (MCP-1) in traumatic brain injury (TBI): evidence from severe TBI patients and CCL2-/- mice. J Cereb Blood Flow Metab. 2010;30:769–782. doi: 10.1038/jcbfm.2009.262. [DOI] [PMC free article] [PubMed] [Google Scholar]
- 22.Tsou C.L., Peters W., Si Y., Slaymaker S., Aslanian A.M., Weisberg S.P., Mack M., Charo I.F. Critical roles for CCR2 and MCP-3 in monocyte mobilization from bone marrow and recruitment to inflammatory sites. J Clin Invest. 2007;117:902–909. doi: 10.1172/JCI29919. [DOI] [PMC free article] [PubMed] [Google Scholar]
- 23.Brucklacher R.M., Patel K.M., VanGuilder H.D., Bixler G.V., Barber A.J., Antonetti D.A., Lin C.M., LaNoue K.F., Gardner T.W., Bronson S.K., Freeman W.M. Whole genome assessment of the retinal response to diabetes reveals a progressive neurovascular inflammatory response. BMC Med Genomics. 2008;1:26. doi: 10.1186/1755-8794-1-26. [DOI] [PMC free article] [PubMed] [Google Scholar]
- 24.Feit-Leichman R.A., Kinouchi R., Takeda M., Fan Z., Mohr S., Kern T.S., Chen D.F. Vascular damage in a mouse model of diabetic retinopathy: relation to neuronal and glial changes. Invest Ophthalmol Vis Sci. 2005;46:4281–4287. doi: 10.1167/iovs.04-1361. [DOI] [PubMed] [Google Scholar]
- 25.Caballero S., Sengupta N., Afzal A., Chang K.H., Li Calzi S., Guberski D.L., Kern T.S., Grant M.B. Ischemic vascular damage can be repaired by healthy, but not diabetic, endothelial progenitor cells. Diabetes. 2007;56:960–967. doi: 10.2337/db06-1254. [DOI] [PMC free article] [PubMed] [Google Scholar]
- 26.Chan-Ling T. Glial, vascular, and neuronal cytogenesis in whole-mounted cat retina. Microsc Res Tech. 1997;36:1–16. doi: 10.1002/(SICI)1097-0029(19970101)36:1<1::AID-JEMT1>3.0.CO;2-V. [DOI] [PubMed] [Google Scholar]
- 27.Nakano K., Migita M., Mochizuki H., Shimada T. Differentiation of transplanted bone marrow cells in the adult mouse brain. Transplantation. 2001;71:1735–1740. doi: 10.1097/00007890-200106270-00006. [DOI] [PubMed] [Google Scholar]
- 28.Ito D., Imai Y., Ohsawa K., Nakajima K., Fukuuchi Y., Kohsaka S. Microglia-specific localisation of a novel calcium binding protein, Iba1. Brain Res Mol Brain Res. 1998;57:1–9. doi: 10.1016/s0169-328x(98)00040-0. [DOI] [PubMed] [Google Scholar]
- 29.Vincent J.A., Mohr S. Inhibition of caspase-1/interleukin-1beta signaling prevents degeneration of retinal capillaries in diabetes and galactosemia. Diabetes. 2007;56:224–230. doi: 10.2337/db06-0427. [DOI] [PubMed] [Google Scholar]
- 30.Zheng H., Li Y.F., Weiss M., Mayhan W.G., Patel K.P. Neuronal expression of fos protein in the forebrain of diabetic rats. Brain research. 2002;956:268–275. doi: 10.1016/s0006-8993(02)03550-3. [DOI] [PubMed] [Google Scholar]
- 31.Morgan J.I., Cohen D.R., Hempstead J.L., Curran T. Mapping patterns of c-fos expression in the central nervous system after seizure. Science. 1987;237:192–197. doi: 10.1126/science.3037702. [DOI] [PubMed] [Google Scholar]
- 32.Hazra S., Jarajapu Y.P., Stepps V., Caballero S., Thinschmidt J.S., Sautina L., Bengtsson N., Licalzi S., Dominguez J., Kern T.S., Segal M.S., Ash J.D., Saban D.R., Bartelmez S.H., Grant M.B. Long-term type 1 diabetes influences haematopoietic stem cells by reducing vascular repair potential and increasing inflammatory monocyte generation in a murine model. Diabetologia. 2013;56:644–653. doi: 10.1007/s00125-012-2781-0. [DOI] [PMC free article] [PubMed] [Google Scholar]
- 33.Haus E., Smolensky M.H. Biologic rhythms in the immune system. Chronobiol Int. 1999;16:581–622. doi: 10.3109/07420529908998730. [DOI] [PubMed] [Google Scholar]
- 34.Kamenov Z.A., Traykov L.D. Diabetic autonomic neuropathy. Adv Exp Med Biol. 2012;771:176–193. doi: 10.1007/978-1-4614-5441-0_15. [DOI] [PubMed] [Google Scholar]
- 35.Harrison S.A., Brunt E.M., Goodman Z.D., Di Bisceglie A.M. Diabetic hepatosclerosis: diabetic microangiopathy of the liver. Arch Pathol Lab Med. 2006;130:27–32. doi: 10.5858/2006-130-27-DHDMOT. [DOI] [PubMed] [Google Scholar]
- 36.Kazakos K.A., Sarafidis P.A., Yovos J.G. The impact of diabetic autonomic neuropathy on the incretin effect. Med Sci Monit. 2008;14:CR213–CR220. [PubMed] [Google Scholar]
- 37.Cano G., Card J.P., Sved A.F. Dual viral transneuronal tracing of central autonomic circuits involved in the innervation of the two kidneys in rat. J Comp Neurol. 2004;471:462–481. doi: 10.1002/cne.20040. [DOI] [PubMed] [Google Scholar]
- 38.Cano G., Sved A.F., Rinaman L., Rabin B.S., Card J.P. Characterization of the central nervous system innervation of the rat spleen using viral transneuronal tracing. J Comp Neurol. 2001;439:1–18. doi: 10.1002/cne.1331. [DOI] [PubMed] [Google Scholar]
- 39.Peterson J.R., Sharma R.V., Davisson R.L. Reactive oxygen species in the neuropathogenesis of hypertension. Curr Hypertens Rep. 2006;8:232–241. doi: 10.1007/s11906-006-0056-1. [DOI] [PubMed] [Google Scholar]
- 40.Chen S.K., Tvrdik P., Peden E., Cho S., Wu S., Spangrude G., Capecchi M.R. Hematopoietic origin of pathological grooming in Hoxb8 mutant mice. Cell. 2010;141:775–785. doi: 10.1016/j.cell.2010.03.055. [DOI] [PMC free article] [PubMed] [Google Scholar]
- 41.Longo B., Romariz S., Blanco M.M., Vasconcelos J.F., Bahia L., Soares M.B., Mello L.E., Ribeiro-dos-Santos R. Distribution and proliferation of bone marrow cells in the brain after pilocarpine-induced status epilepticus in mice. Epilepsia. 2010;51:1628–1632. doi: 10.1111/j.1528-1167.2010.02570.x. [DOI] [PubMed] [Google Scholar]
- 42.Amann B., Tinzmann R., Angelkort B. ACE inhibitors improve diabetic nephropathy through suppression of renal MCP-1. Diabetes Care. 2003;26:2421–2425. doi: 10.2337/diacare.26.8.2421. [DOI] [PubMed] [Google Scholar]
- 43.Wakabayashi Y., Usui Y., Okunuki Y., Kezuka T., Takeuchi M., Iwasaki T., Ohno A., Goto H. Increases of vitreous monocyte chemotactic protein 1 and interleukin 8 levels in patients with concurrent hypertension and diabetic retinopathy. Retina. 2011;31:1951–1957. doi: 10.1097/IAE.0b013e31820d3cee. [DOI] [PubMed] [Google Scholar]
- 44.Sell H., Dietze-Schroeder D., Kaiser U., Eckel J. Monocyte chemotactic protein-1 is a potential player in the negative cross-talk between adipose tissue and skeletal muscle. Endocrinology. 2006;147:2458–2467. doi: 10.1210/en.2005-0969. [DOI] [PubMed] [Google Scholar]
- 45.Meleth A.D., Agron E., Chan C.C., Reed G.F., Arora K., Byrnes G., Csaky K.G., Ferris F.L., 3rd, Chew E.Y. Serum inflammatory markers in diabetic retinopathy. Invest Ophthalmol Vis Sci. 2005;46:4295–4301. doi: 10.1167/iovs.04-1057. [DOI] [PubMed] [Google Scholar]
- 46.Piemonti L., Calori G., Lattuada G., Mercalli A., Ragogna F., Garancini M.P., Ruotolo G., Luzi L., Perseghin G. Association between plasma monocyte chemoattractant protein-1 concentration and cardiovascular disease mortality in middle-aged diabetic and nondiabetic individuals. Diabetes Care. 2009;32:2105–2110. doi: 10.2337/dc09-0763. [DOI] [PMC free article] [PubMed] [Google Scholar]
- 47.Simeoni E., Hoffmann M.M., Winkelmann B.R., Ruiz J., Fleury S., Boehm B.O., Marz W., Vassalli G. Association between the A-2518G polymorphism in the monocyte chemoattractant protein-1 gene and insulin resistance and type 2 diabetes mellitus. Diabetologia. 2004;47:1574–1580. doi: 10.1007/s00125-004-1494-4. [DOI] [PubMed] [Google Scholar]
- 48.Katakami N., Matsuhisa M., Kaneto H., Matsuoka T.A., Imamura K., Ishibashi F., Kanda T., Kawai K., Osonoi T., Kashiwagi A., Kawamori R., Shimomura I., Yamasaki Y. Monocyte chemoattractant protein-1 (MCP-1) gene polymorphism as a potential risk factor for diabetic retinopathy in Japanese patients with type 2 diabetes. Diabetes Res Clin Pract. 2010;89:e9–e12. doi: 10.1016/j.diabres.2010.04.006. [DOI] [PubMed] [Google Scholar]
- 49.Moon J.Y., Jeong L., Lee S., Jeong K., Lee T., Ihm C.G., Suh J., Kim J., Jung Y.Y., Chung J.H. Association of polymorphisms in monocyte chemoattractant protein-1 promoter with diabetic kidney failure in Korean patients with type 2 diabetes mellitus. J Korean Med Sci. 2007;22:810–814. doi: 10.3346/jkms.2007.22.5.810. [DOI] [PMC free article] [PubMed] [Google Scholar]
- 50.Shanmugam N., Reddy M.A., Guha M., Natarajan R. High glucose-induced expression of proinflammatory cytokine and chemokine genes in monocytic cells. Diabetes. 2003;52:1256–1264. doi: 10.2337/diabetes.52.5.1256. [DOI] [PubMed] [Google Scholar]
- 51.Takaishi H., Taniguchi T., Takahashi A., Ishikawa Y., Yokoyama M. High glucose accelerates MCP-1 production via p38 MAPK in vascular endothelial cells. Biochem Biophys Res Commun. 2003;305:122–128. doi: 10.1016/s0006-291x(03)00712-5. [DOI] [PubMed] [Google Scholar]
- 52.Luo Y., Kaur C., Ling E.A. Neuronal and glial response in the rat hypothalamus-neurohypophysis complex with streptozotocin-induced diabetes. Brain Res. 2002;925:42–54. doi: 10.1016/s0006-8993(01)03258-9. [DOI] [PubMed] [Google Scholar]
- 53.Klein J.P., Hains B.C., Craner M.J., Black J.A., Waxman S.G. Apoptosis of vasopressinergic hypothalamic neurons in chronic diabetes mellitus. Neurobiol Dis. 2004;15:221–228. doi: 10.1016/j.nbd.2003.10.009. [DOI] [PubMed] [Google Scholar]
- 54.Dheen S.T., Tay S.S., Wong W.C. Ultrastructural changes in the hypothalamic supraoptic nucleus of the streptozotocin-induced diabetic rat. J Anatomy. 1994;184(Pt 3):615–623. [PMC free article] [PubMed] [Google Scholar]
- 55.Dheen S.T., Tay S.S., Wong W.C. Ultrastructural changes in the hypothalamic paraventricular nucleus of the streptozotocin-induced diabetic rat. Acta Anat. 1994;149:291–299. doi: 10.1159/000147590. [DOI] [PubMed] [Google Scholar]
- 56.Fernstrom J.D., Fernstrom M.H., Kwok R.P. In vivo somatostatin, vasopressin, and oxytocin synthesis in diabetic rat hypothalamus. Am J Physiol. 1990;258:E661–E666. doi: 10.1152/ajpendo.1990.258.4.E661. [DOI] [PubMed] [Google Scholar]
- 57.Amin A.R., Attur M.G., Thakker G.D., Patel P.D., Vyas P.R., Patel R.N., Patel I.R., Abramson S.B. A novel mechanism of action of tetracyclines: effects on nitric oxide synthases. Proc Natl Acad Sci U S A. 1996;93:14014–14019. doi: 10.1073/pnas.93.24.14014. [DOI] [PMC free article] [PubMed] [Google Scholar]
- 58.Sanchez Mejia R.O. Friedlander RM: Caspases in Huntington’s disease. Neuroscientist. 2001;7:480–489. doi: 10.1177/107385840100700604. [DOI] [PubMed] [Google Scholar]
- 59.Zhu S., Stavrovskaya I.G., Drozda M., Kim B.Y., Ona V., Li M., Sarang S., Liu A.S., Hartley D.M., Wu D.C., Gullans S., Ferrante R.J., Przedborski S., Kristal B.S., Friedlander R.M. Minocycline inhibits cytochrome c release and delays progression of amyotrophic lateral sclerosis in mice. Nature. 2002;417:74–78. doi: 10.1038/417074a. [DOI] [PubMed] [Google Scholar]
- 60.Barza M., Brown R.B., Shanks C., Gamble C., Weinstein L. Relation between lipophilicity and pharmacological behavior of minocycline, doxycycline, tetracycline, and oxytetracycline in dogs. Antimicrob Agents Chemother. 1975;8:713–720. doi: 10.1128/aac.8.6.713. [DOI] [PMC free article] [PubMed] [Google Scholar]
- 61.Yellowlees Douglas J., Bhatwadekar A.D., Li Calzi S., Shaw L.C., Carnegie D., Caballero S., Li Q., Stitt A.W., Raizada M.K. Grant MB: Bone marrow-CNS connections: implications in the pathogenesis of diabetic retinopathy. Prog Retin Eye Res. 2012;31:481–494. doi: 10.1016/j.preteyeres.2012.04.005. [DOI] [PMC free article] [PubMed] [Google Scholar]
- 62.Dray A. Neuropathic pain: emerging treatments. Br J Anaesth. 2008;101:48–58. doi: 10.1093/bja/aen107. [DOI] [PubMed] [Google Scholar]
- 63.Cukras C.A., Petrou P., Chew E.Y., Meyerle C.B., Wong W.T. Oral minocycline for the treatment of diabetic macular edema (DME): results of a phase I/II clinical study. Invest Ophthalmol Vis Sci. 2012;53:3865–3874. doi: 10.1167/iovs.11-9413. [DOI] [PMC free article] [PubMed] [Google Scholar]
Associated Data
This section collects any data citations, data availability statements, or supplementary materials included in this article.
Supplementary Materials
Neural connections between sympathetic nervous system (SNS) and bone marrow in mice are shown by tracing with GFP-labeled pseudo rabies virus (PRV). PVR tracing: mouse brain sections containing GFP+ neurons after injection of PRV-152 into the bone marrow (BM) of the femur in nondiabetic mice. Bilateral labeling of neurons in the PVN of the hypothalamus (A), the nucleus of the solitary tract (NTS; B), the rostral ventrolateral medulla (RVLM; C), and the subfornical organ (SFO; D). These results show direct connections between the BM and the SNS. Original magnification, ×100.