

Abstract
Inhibitory parvalbumin-containing interneurons (PVIs) control neuronal discharge and support the generation of theta- and gamma-frequency oscillations in cortical networks. Fast GABAergic input onto PVIs is crucial for their synchronization and oscillatory entrainment, but the role of metabotropic GABAB receptors (GABABRs) in mediating slow presynaptic and postsynaptic inhibition remains unknown. In this study, we have combined high-resolution immunoelectron microscopy, whole-cell patch-clamp recording, and computational modeling to investigate the subcellular distribution and effects of GABABRs and their postsynaptic effector Kir3 channels in rat hippocampal PVIs. Pre-embedding immunogold labeling revealed that the receptors and channels localize at high levels to the extrasynaptic membrane of parvalbumin-immunoreactive dendrites. Immunoreactivity for GABABRs was also present at lower levels on PVI axon terminals. Whole-cell recordings further showed that synaptically released GABA in response to extracellular stimulation evokes large GABABR-mediated slow IPSCs in perisomatic-targeting (PT) PVIs, but only small or no currents in dendrite-targeting (DT) PVIs. In contrast, paired recordings demonstrated that GABABR activation results in presynaptic inhibition at the output synapses of both PT and DT PVIs, but more strongly in the latter. Finally, computational analysis indicated that GABAB IPSCs can phasically modulate the discharge of PT interneurons at theta frequencies. In summary, our results show that GABABRs differentially mediate slow presynaptic and postsynaptic inhibition in PVIs and can contribute to the dynamic modulation of their activity during oscillations. Furthermore, these data provide evidence for a compartment-specific molecular divergence of hippocampal PVI subtypes, suggesting that activation of GABABRs may shift the balance between perisomatic and dendritic inhibition.
Introduction
Neuronal activity in cortical circuits is controlled by a heterogeneous population of GABAergic interneurons (Markram et al., 2004; Klausberger and Somogyi, 2008). Parvalbumin interneurons (PVIs) form a major subset and play central roles in the generation of oscillations at theta and gamma frequencies (Klausberger et al., 2003; Sohal et al., 2009; Wulff et al., 2009). In the hippocampus, PVIs are diverse and include perisomatic-targeting (PT) basket and axo-axonic cells, as well as dendrite-targeting (DT) bistratified cells (Buhl et al., 1996; Pawelzik et al., 2002; Baude et al., 2007). Although these interneuron types share a fast-spiking (FS) phenotype and can discharge at high rates, they show substantial differences in the timing and frequency of their activity during oscillatory network states both in vitro and in vivo (Klausberger et al., 2003, 2004; Hájos et al., 2004; Gloveli et al., 2005). However, the cellular mechanisms underlying these differences are not yet fully understood.
PVIs receive inhibitory input from diverse sources, including the septo-hippocampal GABAergic system and various types of local interneurons, including other PVIs via mutual inhibitory synapses (Tóth et al., 1997; Gulyás et al., 1999; Bartos et al., 2001). Inhibition mediated by fast ionotropic GABAA receptors (GABAARs) has been well characterized and found to be crucial for their synchronization and oscillatory entrainment (Bartos et al., 2001; Galarreta and Hestrin, 2002; Vida et al., 2006; Wulff et al., 2009). In contrast, it remains controversial whether GABAB receptors (GABABRs) and their postsynaptic effectors, G-protein-coupled inwardly rectifying potassium (GIRK/Kir3) channels are expressed in PVIs and modulate their activity and inhibitory synaptic output. In situ hybridization and light microscopic immunocytochemical studies have revealed that GABAB1 subunits accumulate in the somata of a subset of hippocampal interneurons (Fritschy et al., 1999; Kulik et al., 2003); this observation was taken as evidence for a high expression of functional GABABRs. However, results of double immunofluorescent labeling have suggested that PVIs express none, or only very low levels, of these receptors (Sloviter et al., 1999). In fact, the absence of GABABRs would be consistent with the hypothesis that FS PVIs mediate rapid signaling and largely lack slow neuromodulatory mechanisms (Freund and Katona, 2007). In contrast, electrophysiological recordings have revealed slow GABABR-mediated IPSCs in basket cells of the dentate gyrus and CA1 (Buhl et al., 1996; Mott et al., 1999), although these studies did not determine the neurochemical identity of these cells.
To clarify whether functional GABABR signaling cascades are present in PVIs, we have performed light and quantitative electron microscopic localization of GABABR and Kir3 channel subunits and characterized slow postsynaptic inhibitory responses, as well as the presynaptic modulation of GABA release from identified PVIs. We present compelling evidence that PT, but not DT, PVIs possess high levels of postsynaptic GABABR-mediated effects, whereas presynaptic inhibition is present in both cell types. This differential compartment-specific functional localization of GABABR effects could explain in part the differences observed in the activity patterns of these two PVI subtypes during network oscillations in vitro and in vivo.
Materials and Methods
Antibodies and controls
Antibodies.
An affinity-purified rabbit polyclonal antibody recognizing the GABAB1 subunit (B17) was used for both light and electron microscopic analysis. Its characteristics and specificity have been described previously (Kulik et al., 2002). An antibody against GABAB2 (B32) was raised in rabbits, and its specificity was described previously (Li et al., 2001). Affinity-purified rabbit polyclonal antibodies were used to detect Kir3.1 and Kir3.3 subunits (Ciruela et al., 2010); a commercially available rabbit polyclonal antibody was used against Kir3.2 (Alomone Labs). PVIs were identified using a mouse monoclonal antibody (Swant). A monoclonal mouse antibody against cholecystokinin (CCK) was generously provided by Dr. G. V. Ohning (CURE Center, University of California-Los Angeles); rabbit polyclonal antibody against neuropeptide-Y (NPY) was obtained from Bachem.
Controls.
To validate the specificity of immunoreactivity for subunits of GABABRs and Kir3 channels, two sets of experiments were performed. First, we compared the labeling intensity in the analyzed subcellular compartments to that in mitochondria. The mean labeling intensity for GABAB1 over the ER (25.5–37.2 particles/μm2) and at cytoplasmic membranes of dendrites (8.8–59.5 particles/μm2, over a 20-nm-wide area at the inner surface of membranes) were significantly higher than the mean intensity over mitochondria (0.8 ± 0.2 particles/μm2, 50 mitochondria, p ≪ 0.001 for all samples). Similarly, Kir3.1, Kir3.2, and Kir3.3 background labeling over mitochondria was very low at 1.6 ± 0.4 particles/μm2, 1.2 ± 0.3 particles/μm2, and 1.5 ± 0.5 particles/μm2 (each sample of 50–55 mitochondria), respectively, whereas labeling on membranes was significantly higher with 18.8 ± 2.2 to 37.6 ± 3.1 particles/μm2 (15–20 PV-positive dendrites; p ≪ 0.001 for all samples). Second, the specificity of labeling for the proteins was controlled by staining of sections obtained from GABAB1-deficient (Schuler et al., 2001), Kir3.1-deficient (Bettahi et al., 2002), Kir3.2-deficient (Signorini et al., 1997), or Kir3.3-deficient (Torrecilla et al., 2002) mice. Immunostaining for the respective subunits was absent in sections derived from these subunit-deficient animals at the light microscopic level. Furthermore, electron microscopic analysis revealed no specific membrane-bound particles in these tissues.
Immunocytochemistry
Tissue preparation.
A total of 9 adult male Wistar rats, 4 adult wild-type mice, 4 GABAB1-deficient mice, 2 Kir3.1-deficient mice, 2 Kir3.2-deficient mice, and 2 Kir3.3-deficient mice were used in the present study. Care and handling of the animals before and during the experimental procedures followed European Union regulations and were approved by the animal care and use committees of the authors' institutions. Animals were deeply anesthetized by Narkodorm-n (180 mg/kg, i.p.; Alvetra) and the hearts were surgically exposed for transcardial perfusion fixation as described previously (Kulik et al., 2003). For light microscopic immunohistochemistry, 4 rats, 2 wild-type mice, 2 GABAB1-deficient mice, and 3 Kir3-deficient mice were perfused with a fixative solution containing 4% paraformaldehyde (Merck) and 15% (v/v) saturated picric acid. For electron microscopic immunocytochemistry, 5 rats, 2 wild-type mice, 2 GABAB1-deficient mice, and 3 Kir3-deficient mice were perfused with the above fixative that also contained 0.05% glutaraldehyde (Polyscience).
Double immunofluorescent labeling for light microscopy.
Sections were cut on a Vibratome (VT1000; Leica, Wetzlar, Germany) at a thickness of 50 μm and extensively rinsed in 25 mm phosphate buffer (PB) containing 0.9% NaCl (PBS). After a 1 h incubation in PBS containing 10% normal goat serum (NGS; Vector Laboratories) and 0.3% Triton X-100 at room temperature, sections were transferred into a mixture of primary antibodies (GABAB1: 1–1.5 μg/ml, Kir3.1: 0.5–1 μg/ml, Kir3.2: 1–1.5 μg/ml, Kir3.3: 1–1.5 μg/ml) diluted in PBS containing 5% NGS, 0.3% Triton X-100, and 0.05% NaN3, for 48–72 h at 4°C. The anti-PV antibody was applied at a dilution of 1:10,000. Subsequently, sections were incubated in a mixture of secondary antibodies (anti-rabbit-conjugated Alexa Fluor 546 and anti-mouse conjugated Alexa Fluor 488 antibodies; Invitrogen) diluted at 1:500 in PBS containing 3% NGS overnight at 4°C. After incubation with secondary antibodies, sections were rinsed extensively in 25 mm PBS, then in 0.1 m PB, and embedded in a fluorescent mounting medium (Anti-fade; Invitrogen) under coverslips.
Immunoelectron microscopy.
For double immunoelectron microscopy, sections were prepared as described previously (Kulik et al., 2006), blocked, and then incubated in primary antibodies (GABAB1: 1–2 μg/ml, GABAB2: 1:3000 serum; Kir3.1: 1–1.5 μg/ml, Kir3.2: 1–2 μg/ml, or Kir3.3: 1.5–2.5 μg/ml, in combination with PV 1:8000) diluted in TBS containing 3% NGS for 24 h at 4°C. Subsequently, they were transferred into a mixture of the following secondary antibodies: goat anti-rabbit (Fab fragment diluted 1:100) coupled to 1.4 nm gold (Nanoprobes) and biotinylated goat anti-mouse antibodies (diluted 1:50; Vector Laboratories). Later, sections were processed for silver enhancement of the gold particles with an HQ Silver kit (Nanoprobes), incubated with avidin-biotin peroxidase complex (ABC kit; Vector Laboratories), and visualized with 3,3′-diaminobenzidine tetrahydrochloride (0.05%) as a chromogen and 0.01% H2O2 as substrate. Sections were then treated with 1% osmium tetroxide and uranyl acetate, dehydrated, then embedded in epoxy resin (Durcupan ACM Fluka; Sigma-Aldrich). Ultrathin sections were cut on an ultramicrotome (Reichert Ultracut E; Leica), observed in a Philips CM100 electron microscope. Images were taken with a CCD camera (Orius SC600; GATAN) and analyzed using GATAN imaging software.
Quantification of immunogold labeling.
Serial ultrathin sections (65 nm) were cut from the very surface of sections (up to 3 μm depth) because immunoreactivity decreased with depth due to the limited penetration of antibodies (Kulik et al., 2002; Ciruela et al., 2010). Samples of PV-immunoperoxidase-labeled dendrites and unlabeled PC dendritic shafts and spines in stratum (str.) radiatum and somata and axon terminals from the str. pyramidale of area CA1 were collected from consecutive serial sections. The density of proteins over the cytoplasmic membrane surface was estimated by dividing the number of immunogold particles localized within 20 nm of the inner surface of the plasma membrane with the membrane surface of dendritic profiles. To calculate the area of plasma membrane in the section, the perimeter of the profiles was measured using ImageJ software (W.S. Rasband, National Institutes of Health, Bethesda, Maryland, http://rsb.info.nih.gov/ij/) and was multiplied by the nominal thickness taken as 65 nm. Note that the membrane surface density calculated here differs from the density values over the cross-sectional area used for evaluating the specificity of immunogold labeling (see above).
Electrophysiology
Acute hippocampal slice preparation.
For electrophysiological recordings, slices were obtained from 17- to 27-d-old wild-type Wistar rats or Wistar rats expressing the Venus fluorescent protein under the vGAT promoter (Uematsu et al., 2008). All procedures and animal maintenance were performed in accordance with Institutional and UK Home Office guidelines under Schedule 1 of the Scientific Procedures Act (1986), the German Animal Welfare Act, and the European Council Directive 86/609/EEC regarding the protection of animals, as well as guidelines from local authorities (Berlin, T 0215/11). After cervical dislocation, brains were quickly removed and transferred to carbogenated (95% O2/5% CO2), ice-cold sucrose-ACSF (in mm: 87 NaCl, 2.5 KCl, 25 NaHCO3, 1.25 NaH2PO4, 25 glucose, 75 sucrose, 7 MgCl2, 0.5 CaCl2, 1 Na-pyruvate, 1 ascorbic acid). Transverse, 300-μm-thick hippocampal slices were cut on a Vibratome (VT1200s; Leica) and transferred to a submerged holding chamber containing carbogenated sucrose-ACSF. The slices were incubated at 35°C for 30 min and stored subsequently at room temperature. For recording, slices were transferred to a submerged recording chamber and superfused with carbogenated normal ACSF (in mm: 125 NaCl, 2.5 KCl, 25 NaHCO3, 1.25 NaH2PO4, 25 glucose, 1 MgCl2, 2 CaCl2, 1 Na-pyruvate, 1 ascorbic acid) at 32–34°C.
Whole-cell patch-clamp recordings.
Slices were visualized using an upright microscope (BX-50-WI; Olympus) equipped with infrared differential interference contrast optics and a digital camera (ORCA 285; Hamamatsu). Recording electrodes were produced from borosilicate glass capillaries (2 mm outer/1 mm inner diameter; Hilgenberg) on a P-97 puller (Sutter Instrument). Pipettes were filled with K-gluconate-based solution containing the following (in mm): 130 K-gluconate, 10 KCl, 2 MgCl2, 10 EGTA, 10 HEPES, 2 Na2-ATP, 0.3 Na2-GTP, 1 Na2-creatinine, 0.1% biotinylated-lysine (Biocytin, Invitrogen), pH 7.3, 290–310 mOsm, and had series resistance (Rs) of 2–4 MΩ.
Recordings were performed using an AxoPatch 200B amplifier (Molecular Devices). Voltage and current signals were filtered at 10 kHz using the built-in low-pass Bessel filter of the amplifier, digitized at 20 kHz (CED 1401; Cambridge Instruments) and acquired for off-line analysis using WinWCP software (courtesy of J. Dempster, Strathclyde University, Glasgow). Data analysis was performed using the Stimfit software package (courtesy of C. Schmidt-Hieber; http://www.stimfit.org). Cells were recorded initially in current-clamp and a family of 50 pA depolarizing to hyperpolarizing current steps injected (−250 to 250 pA, 500 ms duration) to determine intrinsic membrane properties and action potential discharge properties. Pharmacologically isolated GABABR-mediated IPSCs were elicited by extracellular stimulation while voltage-clamped to a holding potential of −65 mV in the presence of NBQX (10 μm), d-AP5 (50 μm), and bicuculline or gabazine (SR-95531; both at 10 μm). Stimulating electrodes were patch pipettes filled with 2 M NaCl (resistance 0.1–0.3 MΩ) and positioned at the border of str. lacunosum-moleculare and str. radiatum. Single stimuli or 200 Hz trains of 3 or 5 pulses were applied every 20 s; stimuli had duration of 0.1 ms with an intensity of 50 V from a constant-voltage-isolated stimulus generator. RS was monitored constantly, but not compensated, and recordings were abandoned if it exceeded 30 MΩ or deviated by >10%. IPSC amplitudes were measured over a 10 ms time window at the peak from baseline level directly preceding the stimulus in averages of at least five evoked responses. For kinetic analysis, only those cells in which a single stimulus evoked IPSCs with amplitudes larger than 5 pA were considered. Decay time constant of IPSCs was determined by fitting a mono-exponential function (Sodickson and Bean, 1996) using the Levenberg-Marquardt sum-of-squared errors method. In some interneurons, a small inward current was detected after blockade of ionotropic receptors. This current was not identified, but it had negligible impact on the slow GABABR IPSCs.
To analyze GABABR-mediated whole-cell currents, the selective agonist baclofen (10 μm) was applied to the bath. The current induced by GABABR activation was measured as the change in holding current between a 2 min baseline directly preceding drug application and at the maximal response over 2 min after drug wash-in. GABABR-mediated currents were blocked by the selective GABABR antagonist CGP-55845 (CGP, 5 μm). To study the voltage dependence of the currents induced by baclofen, voltage ramps from −40 mV to −120 mV (slope of −0.67 mV/ms; preceded by a 50 ms pre-pulse to −40 mV) were run during baclofen steady state and after full blockade of GABABRs by CGP; the currents evoked during CGP were subtracted from the baclofen response. RS was compensated to ≥80% during ramp tests. For all cells, we analyzed the membrane capacitance (Cm), measured from a 10 ms, 2 mV hyperpolarizing test pulse at the end of IPSC traces, in voltage-clamp. In all cells, these test pulses were better fitted with a biexponential, rather than a monoexponential function (Levenberg-Marquardt sum-of-squared errors method), presumably due to the morphologically distributed nature of membrane capacitance. Cm was calculated using the following equation:
 |
where τ is the relevant time constant, GT is the pipette conductance (reciprocal of RS), and I is the peak amplitude of the relevant time constant.
Paired recordings were performed using either two AxoPatch 200B amplifiers or a two-channel MultiClamp 700B amplifier (Molecular Devices). To improve signal-to-noise ratio in the recordings of GABAAR-mediated IPSCs, patch electrodes were filled with a high Cl− internal solution (in mm: 105 K-Gluc, 40 KCl, 2 MgCl2, 0.1 EGTA, 10 HEPES, 2 Na2-ATP, 0.3 Na2-GTP, 1 Na2-creatinine, 0.1% biocytin, pH 7.3, 290–300 mOsm). Action potentials were elicited in presynaptic PVIs by delivering 500 μs depolarizing current pulses to the cell, sufficient to fire a single action potential (3–5 μA). IPSCs were recorded in the postsynaptic CA1 PC under voltage-clamp conditions at a holding potential of −65 mV, with RS (5–20 MΩ) compensated to 70–80%. IPSCs were recorded every 5 s and at least 30 synaptic responses were collected before bath application of 10 μm baclofen. Thirty traces were collected after reaching a steady-state baclofen effect (∼2 min), at which time 5 μm CGP was applied to the bath, allowed to reach steady state, and a further 30 traces collected. Changes in the membrane potential of the presynaptic interneuron in response to application of the drugs were not corrected. For time course data, IPSC amplitudes from individual traces are shown; mean IPSC amplitudes were calculated in time windows of 500 μs around the peak in averages of ≥30 traces.
To determine the cellular source of GABA capable of producing GABABR-mediated responses, we performed paired recordings between potential presynaptic interneurons and postsynaptic CA1 PCs or PVIs. Action potentials in presynaptic interneurons were elicited with a single current pulse or short trains of pulses (1.5 nA amplitude, 1 ms duration, trains of 10 pulses at 100 or 200 Hz) in normal ACSF to determine synaptic connectivity between the two recorded cells. To record isolated slow IPSCs 10 μm DNQX, 50 μm d-AP5, 10 μm bicuculline, and the GABA uptake inhibitor tiagabine (10 μm) were added to the bath. To further enhance GABA release from the presynaptic interneurons, longer trains of stimuli (300 ms at ∼100 Hz) were applied in another set of experiments. To prevent synaptic run-down in these experiments, 10 mm GABA was included in the intracellular solution. All recorded pairs were morphologically identified and analyzed to determine whether the axon of presynaptic interneurons was present and overlapping with the dendritic tree of the postsynaptic neuron. From these longer stimuli, at least 30 traces were collected and averaged. In all experiments, after stimulation of the presynaptic neuron, 5 μm CGP-55845 was bath-applied to confirm that the slow responses were mediated by GABABRs.
Visualization and immunocytochemical characterization of recorded neurons
After recording, slices were immersion fixed overnight in 0.1 m PB containing 4% paraformaldehyde. Slices were extensively rinsed in PB and processed without resectioning. Biocytin-filled cells were visualized using avidin-conjugated Alexa Fluor 647 (1:1000; Invitrogen) and processed for immunofluorescent labeling against PV (see above), NPY (dilution 1:2000), and CCK (dilution 1:5000). Slices were coverslipped using an aqueous fluorescence mounting medium. Morphological and immunocytochemical analysis of the cells was performed on a confocal laser-scanning microscope (Bio-Rad Radiance 2100 or FluoView 1000; Olympus). On the basis of their morphological features, neurons were classified as CA1 PCs, or interneurons. Parvalbumin-immunoreactive interneurons were further subdivided into two groups: (1) PT cells, with axons in and near the str. pyramidale, and (2) DT bistratified cells, with axons in the str. radiatum and str. oriens. All interneurons presented in this study showed immunoreactivity for PV. Selected cells and pairs of cells were 3D reconstructed using either Neurolucida software (MicroBrightField) or the Simple Neurite Tracer plug-in (Longair et al., 2011) in the Fiji distribution of ImageJ software (http://fiji.sc/) from confocal image stacks obtained with either a 20× objective (numerical aperture [NA] 0.75), an oil-immersion 40× objective (NA 1.3), or a silicone-immersion 60× objective (NA 1.3).
Network simulations
Network activity was simulated using Neuron 7.1 running on a PC under Linux (Hines and Carnevale, 1997) based on our previously developed FS interneuron network model (Vida et al., 2006). In brief, interneurons were represented as single compartments with a specific leak conductance of 0.1 mS cm−2 including voltage-gated Na+ and K+ conductances modeled using modified Hodgkin-Huxley equations. The network was assembled from 200 FS neurons (corresponding to PT PVIs) arranged on a virtual ring with 50 μm spacing between adjacent cells. Each FS neuron was randomly connected to 60 of its 100 nearest neighbors via mutual inhibitory synapses, with fast kinetics and a shunting inhibitory effect (Bartos et al., 2001; Vida et al., 2006). The unitary peak conductance was set to 0.1 mS cm−2, the rise time constant was 0.16 ms, the biexponential decay time constants were 1.2 ms (90% amplitude contribution) and 8 ms (10%), and the synaptic reversal potential was −58 mV. In addition, each FS neuron was randomly connected to four of its eight nearest neighbors by electrical synapses (transcellular conductance: 0.01 mS cm−2). Neurons were initialized to a membrane potential of −65 mV and tonic excitatory currents were applied to each neuron with amplitudes randomly chosen from a normal distribution with mean of 2 μA cm−2 and a coefficient of variation of 10%.
To simulate the effects of GABABR-mediated slow inhibition onto the FS cells, 20 interneurons discharging synchronously at theta frequencies (theta cells [TCs]) were incorporated in the network. The discharge of TCs was synchronized and varied between 4 and 12 Hz by applying a low excitatory drive in the range of 0.15–0.25 μA cm−2. Each TC evoked slow GABABR-mediated IPSCs in all FS interneurons; the peak “unitary” amplitude of the IPSCs was varied between 1 and 25 μS cm−2, onset latency was set to 89 ms, rise time constant 35 ms to match the 66 ms rise time, decay time constant 150 ms, and the synaptic reversal potential −95 mV. Network activity was simulated in epochs of 2000 ms; mean network frequency and coherence of FS cells was measured between 1500 and 2000 ms when the summation of the compound GABAB conductance reached steady state. The upper limit of discharge frequency was determined in a 50 ms window at the trough of the compound conductance; the lower limit was measured in a 50–120 ms window at the peak to account for the transient silencing with higher conductance amplitudes. Network frequency was calculated from the mean interspike interval (Bartos et al., 2001). Phase relationship of FS cells was calculated from the mean discharge latency relative to the theta cycle defined by the discharge of the TCs. Frequency and coherence values indicated are averages of three independent simulation runs.
The potential impact of GABAAR-mediated inhibition from TCs onto FS cells was tested in a set of simulations. The synaptic latency was 2 ms, the rise and decay time constants of the IPSCs were 3 and 20 ms, respectively, and the reversal potential was assumed to be −55 mV. Surprisingly, the fast inhibitory conductance (0.5–25 μS cm−2) resulted in only minimal perturbation of the FS network activity, with network frequency reduced from 66.45 ± 0.07 Hz to 65.9 ± 0.14 Hz for the largest conductance in a 50 ms time window after the TC discharge (p = 0.02, Kruskal–Wallis rank-sum test for six increasing conductance amplitudes).
Statistical analysis
All values are given as mean ± SEM. Statistical analyses were performed using either the R (GNU R Project, http://www.r-project.org) or Prism 3.0 (GraphPad) software packages. Multiple group comparisons were performed first using the Kruskal–Wallis rank-sum test. Pairwise comparisons of groups and pharmacological effects were assessed by the Wilcoxon rank-sum (Mann–Whitney–Wilcoxon) or the Wilcoxon signed-rank tests, respectively. Prevalence of monosynaptic GABABR-mediated responses was assessed with a χ2 test. Statistical significance was accepted at p < 0.05.
Results
GABAB1 immunoreactivity is present at low levels in somata of PVIs
Previous studies have revealed strong immunoreactivity for the GABAB1 subunit in the somata of distinct subsets of interneurons (Fritschy et al., 1999; Sloviter et al., 1999; Kulik et al., 2003). However, PVIs were reported to show only weak or no signal for GABABRs (Sloviter et al., 1999) and the expression of functional receptors remained controversial. Therefore, to assess the somatic immunoreactivity in these interneurons, we first performed double immunofluorescent labeling for GABAB1 and PV in the rat hippocampus (Fig. 1A). The resulting staining pattern corresponded well to those published previously, with preferential immunolabeling in dendritic layers, notably str. lacunosum-moleculare of the CA areas. Labeled nonprincipal cells were scattered throughout hippocampal areas, but neurons showing strong immunoreactivity for GABAB1 were consistently negative for PV (Fig. 1A, arrow). However, closer inspection of PV-positive somata revealed that the intensity of immunolabeling for the receptor subunit was above background, often equivalent to or exceeding that of neighboring pyramidal cells (PCs; Fig. 1A, arrowheads).
Figure 1.
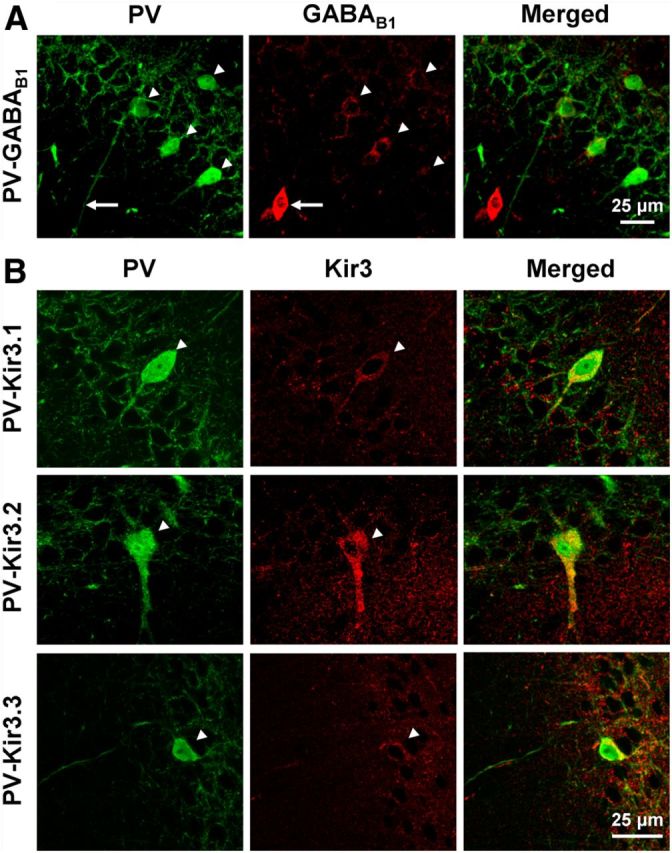
Immunoreactivity for GABAB1 and Kir3 subunits in hippocampal PVIs. A, Confocal images of the cell body layer of the hippocampal CA1 area showing immunofluorescent labeling for PV (left, green) and GABAB1 (middle, red) and their colocalization in the superimposed image (right). Note the strong immunolabeling for the GABAB1 subunit in the soma of a PV-negative interneuron (arrow) and the lower but discernible labeling in PV-positive somata (arrowheads). B, Confocal images illustrating the colocalization of PV (left, green) with Kir3.1 (top row, middle, red), Kir3.2 (middle row, middle), and Kir3.3 subunits (bottom row, middle). Immunoreactivity for all the three Kir3 subunits is present in PV-positive interneurons in and near the CA1 str. pyramidale (arrowheads).
The GABAB1 immunoreactivity observed in neuronal cell bodies at the light microscopic level corresponded primarily to proteins localized to the endoplasmic reticulum (ER; Kulik et al., 2003). Therefore, to further confirm that somata of PVIs contain the GABAB1 subunit, we performed high-resolution immunogold electron microscopic analysis. Our results showed consistent immunogold labeling for GABAB1 over the ER of PV-positive cells (data not shown) with a mean immunogold particle density of 37.3 ± 5.4 particles/μm2 (in 3 cells). This labeling was significantly higher than background (0.8 ± 0.2 particles/μm2, p ≪ 0.001), confirming the specificity of this signal. These results thus demonstrate that the GABAB1 subunit is expressed by PVIs and is present in their ER.
Effector Kir3 channel subunits are expressed by PVIs
Postsynaptic effects of GABABRs are primarily mediated by Kir3 channels (Lüscher et al., 1997; Kaupmann et al., 1998). To determine whether these effector channels are also expressed by PVIs, we performed double immunofluorescent labeling for PV and the Kir3.1, Kir3.2, or Kir3.3 subunits (Fig. 1B). In good agreement with earlier publications (Grosse et al., 2003; Koyrakh et al., 2005; Kulik et al., 2006), all three Kir3 subunits showed preferential staining in dendritic layers of the hippocampus. In the str. pyramidale of CA1, Kir3 labeling intensities were generally low, but PV-positive somata often showed immunoreactivity for Kir3 subunits comparable to or above that of neighboring PCs (Fig. 1B, arrowheads). Therefore, our light microscopic investigations confirmed that PVIs show immunoreactivity not only for GABABR, but also for the three main subunits of their postsynaptic effector Kir3 channels.
PV-immunoreactive dendrites show high levels of surface-localized GABABRs
We next investigated the subcellular distribution of GABABRs over the somatodendritic plasma membrane of PVIs by immunoelectron microscopy (Fig. 2). Immunogold particles for GABAB1 subunit were mainly found along the extrasynaptic plasma membrane of immunoperoxidase-labeled PV-positive dendritic shafts in str. radiatum (Fig. 2A). Consistent with the requirement of GABABR subunit heterodimerization for surface localization and formation of functional receptors, immunogold particles for GABAB2 showed a similar subcellular distribution and were found preferentially along the extrasynaptic plasma membrane of PV-immunopositive dendrites (Fig. 2B). To quantify the intensity of immunolabeling, the surface density of immunogold particles for GABAB1 was determined for the dendritic membranes of PVIs and pyramidal cells in serial ultrathin sections (Fig. 2C). Although there was an inherently high variability of labeling in sampled PVI dendritic segments (n = 23 from 2 animals; Fig. 2C), the mean immunoparticle density was high, with 13.0 ± 1.7 particles/μm2 (Fig. 2C). In comparison, the density of immunogold particles on plasma membranes of putative CA1 PC spiny dendrites was not statistically different (12.1 ± 2.1 particles/μm2, 9 dendritic shafts, p = 0.81; Fig. 2C). Immunogold particle density did not show any correlation with diameter of the dendrites (data not shown), suggesting that the distribution was homogeneous over the dendritic arbor. Interestingly, the labeling density with 11.5 ± 2.1 particles/μm2 was comparably high on the somatic membrane of PVI cell bodies (n = 3, p = 0.76 compared with PVI dendrites; Fig. 2C). These results indicate a high density of GABABRs over the somatodendritic membrane of PVIs at levels comparable to those of CA1 PCs.
Figure 2.

GABABR subunits are present on the plasma membrane of PV-immunopositive interneurons. A, B, Electron micrographs showing immunoreactivity for GABAB1 (A, immunoparticles) and GABAB2 (B, immunoparticles) in PV-positive dendrites (Den, peroxidase reaction end-product) contacted by several presynaptic boutons (b) in the CA1 str. radiatum. The majority of the particles for the receptor subunits were found on the extrasynaptic plasma membrane of the dendrites (arrows). C, Summary bar graphs of the surface density of immunogold particles in immunoperoxidase-negative spiny dendrites of putative PCs and PV-positive dendrites, somata, and boutons. D, Consecutive serial electron micrographs of a PVI bouton in the CA1 str. pyramidale showing immunoreactivity for GABAB1 (arrows). Note that the bouton makes a symmetrical putative GABAergic synapse (double arrows) with a pyramidal cell soma (S).
GABABRs in PV-positive axon terminals
Presynaptic GABABRs function as autoreceptors in GABAergic terminals and control the output of inhibitory interneurons (Lüscher et al., 1997). Therefore, we next assessed the subcellular distribution of the GABABRs in PVI axon terminals (Fig. 2D). Immunoperoxidase-labeled PVI boutons that established clear symmetrical synapses with the somata or proximal dendrites of principal cells in or near str. pyramidale of the CA1 showed weak but consistent immunoreactivity for the GABAB1 subunit. Similar to postsynaptic elements, immunogold particles for the subunit were primarily observed along the extrasynaptic plasma membrane (Fig. 2D), but were occasionally also seen over the presynaptic membrane specialization. However, the density of immunogold labeling was substantially lower on axons than on the somatodendritic surface and, in 26% of boutons (9 of 35), no labeling was observed. The mean density of the immunogold particles calculated for the membrane surface was 2.7 ± 0.5 particles/μm2 on PVI boutons (Fig. 2C), fourfold lower than on dendritic membranes (p = 0.004). Although presynaptic labeling was weak, the immunogold particle density on PVI boutons was significantly above the background level measured over mitochondria (p ≪ 0.001; see Materials and Methods). Therefore, these results demonstrate clearly that GABABRs are present on the plasma membrane of PVI axon terminals.
Surface-localized Kir3 channel subunits on PV-immunoreactive dendrites
At the subcellular level, Kir3 channels showed a similar distribution to that of GABABRs in hippocampal PCs (Kulik et al., 2006). To investigate whether Kir3 channels are also present on dendritic domains of PVIs, we performed pre-embedding immunogold labeling for the Kir3.1, Kir3.2, and Kir3.3 subunits (Fig. 3). Particles for all three proteins were found to localize to the extrasynaptic membrane of immunoperoxidase-labeled PVI dendrites (Fig. 3A–C). The density of immunogold particles for Kir3.1 and Kir3.2 was low, with a mean membrane surface density of 11.6 ± 1.0 particles/μm2 for Kir3.1 and 5.9 ± 1.0 particles/μm2 for Kir3.2 (20 dendrites from 2 animals each; Fig. 3D,E). CA1 PC dendrites from the same section were nearly twice as strongly labeled for both subunits (19.1 ± 1.6 particles/μm2 for Kir3.1, 31 dendritic shafts, p ≪ 0.001 and 12.4 ± 0.9 particles/μm2 for Kir3.2, 20 dendritic shafts, p ≪ 0.001; Fig. 3D,E). Interestingly, Kir3.3 density on the dendrites of PVIs was comparable to that of CA1 PCs (5.4 ± 0.7 particles/μm2, 15 PVI dendrites and 5.3 ± 0.6 particles/μm2, 30 PC dendritic shafts, p = 0.9; Fig. 3F). In summary, our analysis confirms the presence of Kir3 channels on dendritic membranes of PVIs.
Figure 3.

Kir3 subunits are present on the plasma membrane of PV-immunoreactive interneurons. A–C, Electron micrographs of consecutive sections illustrating the localization of immunogold particles (arrows) for the Kir3.1 (A), Kir3.2 (B), and Kir3.3 (C) subunits on dendritic shafts of PV-expressing neurons (Den, peroxidase reaction end-product), which were contacted by many presynaptic boutons (b). D–F, Bar graphs of the mean surface density of immunogold particles for the three Kir3 subunits on CA1 PC and PV-positive dendrites.
Slow GABABR- and Kir3-channel-mediated inhibition in identified PVIs
To characterize GABABR- and Kir3-channel-mediated slow inhibitory postsynaptic effects, we next performed whole-cell patch-clamp recordings from acute hippocampal slices. GABABR-mediated IPSCs were elicited by extracellular stimuli applied at the border of str. lacunosum-moleculare and str. radiatum of the CA1 area in the presence of the fast ionotropic receptor blockers NBQX (10 μm), d-AP-5 (50 μm), and either bicuculline or gabazine (both 10 μm). To facilitate detection of synaptic responses, stimulus intensity was set to a high 50 V value and single pulses were interleaved with 200 Hz trains of three and five stimuli (Fig. 4).
Figure 4.

Slow GABABR-mediated synaptic responses in PVIs of the hippocampal CA1 area. A, Slow IPSCs in a PC evoked by a single stimulus (a) or trains of three (b) and five (c) stimuli elicited via an extracellular electrode placed at the border of str. radiatum and str. lacunosum-moleculare. IPSCs were blocked by application of the selective GABABR antagonist CGP (5 μm, d). Inset illustrates the recording arrangement for the experiments. B, The same stimulation protocol elicited slow IPSCs in PVIs. Inset shows confocal images of the PV immunolabeling (left, green pseudocolor) in the biocytin-filled cell body (right, blue pseudocolor). Scale bar, 20 μm.
This extracellular stimulation protocol consistently elicited slow IPSCs in CA1 PCs. IPSCs evoked by 1, 3, and 5 stimuli showed near linear summation with mean amplitudes of 5.8 ± 0.8 pA, 17.5 ± 2.2 pA, and 26.9 ± 3.1 pA, respectively (26 cells; Fig. 4A). IPSCs elicited by a single stimulus had a mean onset latency of 58.6 ± 4.6 ms and a rise time of 55.3 ± 5.3 ms (13 cells). The decay of the synaptic currents could be well fitted with a mono-exponential function (Sodickson and Bean, 1996) and had a time constant of 200.5 ± 37.7 ms. Slow IPSCs were unequivocally identified as GABABR-mediated currents due to sensitivity to the selective antagonist CGP (5 μm, 9 cells) and occlusion by the agonist baclofen (10 μm, 23 cells).
Interneurons were selected for recording on the basis of their localization within or near to str. pyramidale of the CA1 area and nonpyramidal somatic morphology observed in infrared differential interference contrast video microscopy. Neurochemical identity of the neurons was confirmed by post hoc immunofluorescent labeling for PV (Fig. 4B, inset); all 27 interneurons presented here showed clear immunoreactivity for this calcium-binding protein.
The extracellular stimulation protocol evoked slow IPSCs in most, but not all, PVIs recorded in the CA1 area. The mean amplitudes of IPSCs evoked by 1, 3, and 5 stimuli were 4.3 ± 1.3 pA, 13.3 ± 3.9 pA, and 19.6 ± 5.3 pA, respectively (27 cells; Fig. 4B). Kinetic parameters were derived from a subset of PVIs (7 cells), which showed larger IPSC amplitudes (>5 pA from single stimuli) and therefore improved signal-to-noise ratio. The onset latency and rise time of slow IPSCs elicited by single stimuli were 78.1 ± 10.7 ms and 80.7 ± 7.9 ms, respectively, both longer from those in PCs (p = 0.048 and p = 0.039). The decay of the synaptic current was well fitted with a mono-exponential function and had a time constant (152.9 ± 24.3 ms) similar to that observed in CA1 PCs (p = 0.8). The time course of responses elicited by trains of stimuli was also comparable (Fig. 4B), although with prolonged rise times (124.9 ± 17.0 ms and 129.2 ± 16.7 ms, for 3 and 5 stimuli, respectively), as expected for increasing length stimulus trains. In all interneurons tested, slow IPSCs were completely occluded by the agonist baclofen (20 cells; see below) and blocked by the selective GABABR antagonist CGP (13 cells; Fig. 4B).
It is known that single interneurons of the neurogliaform cell type can produce GABABR-mediated unitary slow IPSCs in principal cells (Price et al., 2005, 2008; Krook-Magnuson et al., 2011). However, there is also evidence that other, as yet unidentified, interneurons in str. radiatum and str. oriens can also produce slow IPSCs when activated by trains of action potentials in the presence of the GABA uptake inhibitor tiagabine (Scanziani, 2000). To determine possible presynaptic cellular sources of GABABR-mediated response under our experimental conditions, we performed simultaneous recordings from identified interneurons and CA1 PCs or PVIs in the presence of tiagabine (10 μm). Using either single stimuli or short trains of stimuli, we recorded 65 pairs. Of these pairs, the presynaptic axon was present and overlapped with postsynaptic dendrites in 43 pairs (33 postsynaptic CA1 PCs and 10 postsynaptic PVIs) and GABAAR-mediated unitary IPSCs were recorded in 22 pairs. However, in none of these pairs could a discernible GABABR-mediated response be observed (data not shown).
To further increase GABA release, we next tested long trains of stimuli (300 ms, 100 Hz), also in the presence of tiagabine (10 μm). Under these conditions, a further 33 pairs of neurons were recorded, of which 21 pairs (11 CA1 PCs and 10 PVIs) had overlapping presynaptic axon and postsynaptic dendrites. In 9 of the 21 postsynaptic cells (4 CA1 PCs and 5 PVIs), we observed a slow outward current that was blocked by CGP, consistent with GABABR activation (Fig. 5A,B). In the identified CA1 PCs, the average IPSC amplitude was 3.3 ± 2.5 pA, comparable to that observed in PVIs (3.9 ± 0.9 pA, p = 0.4; Fig. 5C). These responses were markedly smaller than the amplitude of IPSCs elicited by electrical stimuli to the str. lacunosum-moleculare/radiatum border (see above; p = 0.003). Interestingly, the presynaptic interneurons were diverse, and included three CCK basket cells, four CCK dendritic inhibitory cells, one NPY-immunopositive interneuron, and one neurogliaform cell.
Figure 5.

Single interneurons can evoke GABABR-mediated postsynaptic responses in PCs and PVIs. A, B, In simultaneous recordings (schematic in A), trains of action potentials in various types of interneurons (upper traces) produced small, but discernible GABABR-mediated slow IPSCs (lower black traces) in both CA1 PCs (A) and PVIs (B). Families of traces on the left illustrate the discharge pattern and voltage responses of the recorded neurons to depolarizing and hyperpolarizing current pulses (−250–250 pA, 500 ms). Inset in B shows confocal images of the PV-immunoreactivity (arrow, left, green pseudocolor) in a biocytin-filled dendrite of the cell (arrow, right, blue pseudocolor; scale bar, 5 μm). In all pairs, this IPSC was blocked by application of CGP (5 μm, lower gray traces). C, Summary plot of GABABR-mediated IPSC amplitudes in CA1 PCs (four cells) and PVIs (five cells). Identity of the presynaptic partner is indicated by abbreviation near the points. NGFC indicates neurogliaform cell.
Our results show that GABABR-mediated slow IPSCs can be elicited in PVIs by synaptic release of GABA with amplitudes and kinetics comparable to those observed in CA1 PCs. Furthermore, paired-recording data suggest that diverse interneuron types may contribute to GABABR-mediated postsynaptic inhibition onto hippocampal interneurons.
Large GABABR-mediated postsynaptic inhibition in PT but not DT PVIs of the CA1 area
The absence of slow IPSCs in response to extracellular stimulation in a subset of PV-expressing neurons (7 of 27 cells; 25.9%) raised the possibility that subtypes may respond differentially to GABABR activation. PVIs in the CA1 area comprise morphologically and physiologically distinct PT cells (∼75%) and DT cells (∼25%; Buhl et al., 1996; Baude et al., 2007). Indeed, PVIs showed divergent physiological properties, including a marked difference in discharge frequencies (137.6 ± 21.9 Hz in cells lacking an observable slow IPSC and 79.7 ± 10.1 Hz in those showing IPSCs evoked by current pulses of 250 pA, p = 0.016). Therefore, we next analyzed the intracellularly filled and visualized interneurons to identify them morphologically. On the basis of the axonal distribution, we identified 16 PT and 9 DT interneurons (Fig. 6A).
Figure 6.
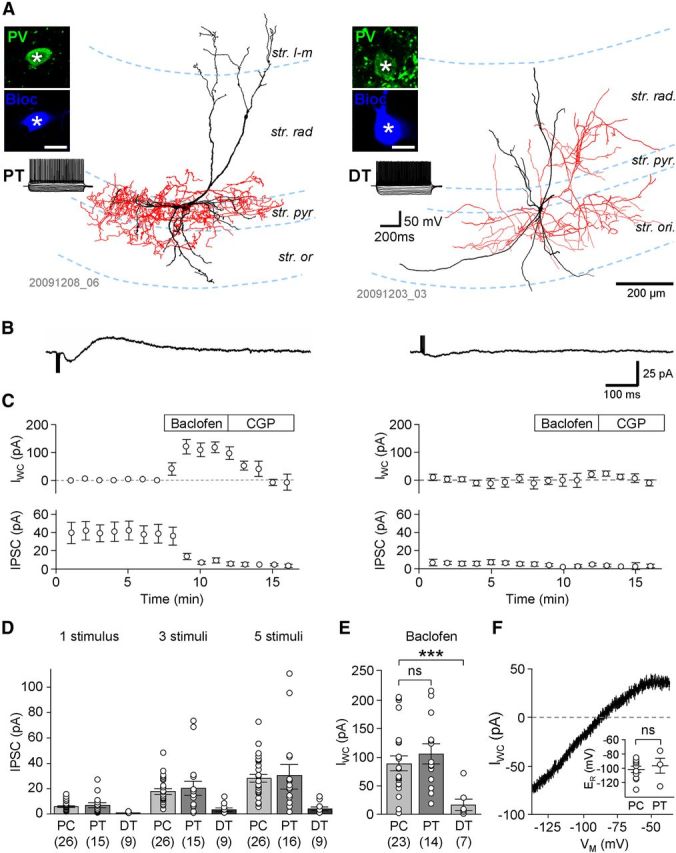
Differential expression of GABABR-mediated synaptic and whole-cell currents in PT and DT PVIs. A, Left: Reconstruction of a PT PVI, a putative basket cell, with dense axonal arbor (red) in the str. pyramidale (str. pyr.). Right: Reconstruction of a DT PVI, a putative bistratified cell, with axonal arbor (red) in the str. radiatum (str. rad.) and oriens (str. ori.). Insets show the immunoreactivity for PV (top, in green) in the visualized biocytin-filled cell bodies (bottom, blue pseudocolor; scale bar, 20 μm); traces show the responses of the two interneurons to a family of hyperpolarizing and depolarizing current pulses (−250 to 250 pA, 50 pA steps, 500 ms duration); note the FS discharge pattern of both cells. B, Pharmacologically isolated slow IPSCs evoked in the PT cell (left, average of 10 traces) and the DT interneuron (right) by trains of five extracellular stimuli delivered to the border of str. radiatum and str. lacunosum-moleculare (str. l-m). IPSCs had large amplitude in PT cells but were absent or had very small amplitudes in DT neurons. C, Time course plots of whole-cell current (IWC, top) and the IPSC amplitude (bottom) before and during sequential bath application of baclofen (10 μm) and CGP (5 μm) from a subset of PT cells (A, four cells) and DT cells (B, six cells) in which both drugs were applied. D, Summary bar graph of IPSC amplitudes in PCs and PT and DT PVIs elicited by single stimuli and trains of three and five stimuli. E, Summary bar graph of the baclofen-induced IWC measured in PCs and PT and DT interneurons. F, Representative plot of the voltage dependence of the baclofen-induced IWC in a PT interneuron. Voltage dependence was calculated by subtracting current responses to ramp commands after CGP and during application of baclofen. Inset, summary of reversal potentials (ER) of the baclofen-induced currents obtained from the calculated voltage dependence in PCs and PT neurons.
Correlation of morphological type and IPSC amplitudes revealed that the responses were generally large in PT neurons, whereas they were very small or absent in DT cells (Fig. 6B). The mean amplitudes of the IPSCs evoked by 1, 3, and 5 stimuli in PT cells were 6.9 ± 2.0 pA, 20.1 ± 6.0 pA, and 30.2 ± 8.1 pA (data from 15, 15, and 16 cells, respectively), comparable to those in PCs (see data above; p = 0.84, 0.64, and 0.75, respectively; Fig. 6D). In contrast, DT interneurons had IPSC amplitudes of 0.4 ± 0.2 pA, 3.2 ± 1.5 pA, and 4.0 ± 1.7 pA, respectively; markedly smaller than those in both PCs and PT neurons for all three stimulus patterns (p = 0.0001, 0.0012, and 0.0002, respectively, Kruskal–Wallis test with Dunn's post hoc test, p < 0.05 for the pairwise comparison of DT cells against both PT cells and PCs; Fig. 6D). In good agreement with these data, morphological analysis of the cells from the paired recording experiments (see above) revealed that of the 10 postsynaptic PVI cells, four were PT and four were DT interneurons; two cells could not be morphologically identified because of cut axons. Of these identified cells, discernible slow IPSCs were observed in three of four PT cells (75%) compared with zero of four DT cells (0%, p = 0.038, χ2 test), further reflecting a differential expression of postsynaptic effects in these two PVI subtypes. In summary, PT cells show large GABABR-mediated IPSCs comparable to those in PCs, whereas in DT cells, GABAB IPSCs are very small or absent.
Pharmacological activation of GABABR-induced large whole-cell currents in PT but not DT interneurons
In CA1 PCs and PT PVIs, the amplitude of IPSCs increased almost linearly with the number of pulses in the stimulus train, indicating that not all surface-localized GABABRs and Kir3 channels were recruited by synaptically released GABA. Therefore, to determine the maximal amplitude of postsynaptic currents, we measured whole-cell currents induced by pharmacological activation of GABABRs through bath application of the canonical agonist baclofen (10 μm). Baclofen invariably occluded the evoked slow ISPCs and resulted in an outward (positive) shift in the holding current in the voltage-clamped neurons (Fig. 6C). The mean amplitude of the baclofen-induced whole-cell current was 88.3 ± 13.3 pA in CA1 PCs (23 cells). In PV-expressing PT interneurons, the mean amplitude of the baclofen-induced current was 107.3 ± 17.0 pA (14 cells; Fig. 6C,E), slightly higher than in PCs but not significantly so (p = 0.3). In PT cells, subsequent application of CGP (5 μm) completely reversed the baclofen-induced change in the whole-cell current (0.2 ± 14.0 pA, measured relative to the baseline before baclofen application, 6 cells, p = 0.6; Fig. 6C), further confirming that this effect was mediated by GABABRs.
In DT interneurons, the baclofen induced whole-cell current was absent or very low. The mean amplitude of the current was 16.4 ± 10.5 pA (7 cells), significantly smaller than for either PT cells or CA1 PCs (p = 0.003, Kruskal–Wallis test with Dunn's posttest, p < 0.05 for the pairwise comparison of DT cells with PT cells and PCs; Fig. 6C,E), which is in good agreement with the results obtained from synaptic stimulation. Application of 5 μm CGP reversed this small current in cells where it was observed (3.6 ± 9.9 pA, 6 cells, measured from pre-baclofen baseline, p = 0.8). In conclusion, pharmacological activation of GABABRs induces large whole-cell currents in PT neurons, but no or only very small currents in DT neurons. These results could be explained by the differential expression of functional GABABRs and/or Kir3 channels or differential receptor-channel coupling efficiency in the two PVI types.
To determine the voltage dependence and reversal potential of the baclofen-induced current, ramp commands were applied to the voltage-clamped neurons during steady-state baclofen response and during CGP steady state. The currents evoked during CGP application were subtracted from those recorded in the presence of baclofen (Fig. 6F), which when compared with command voltage, revealed an inwardly rectifying current with a mean reversal potential of −100.8 ± 4.8 mV in PCs (10 cells) and −95.2 ± 12.0 mV in PT interneurons (4 cells; Fig. 6F), confirming the role of Kir channels, presumably of the Kir3 subtype, in the baclofen-induced current.
We next calculated estimates of the whole-cell conductance for each cell group by dividing the baclofen-induced current by the corresponding driving force. In PCs, the mean value of the estimated whole-cell conductance was 2.46 ± 0.37 nS. In PT neurons, it was slightly higher at 3.56 ± 0.61 nS, whereas in DT cells it was much smaller at 0.38 ± 0.24 nS. To compare surface density of the conductance in the different cell types, we further calculated a normalized conductance density by dividing the calculated whole-cell conductance by cell capacitance (mean whole-cell capacitance: 170.4 ± 16.9 pF for PCs, 100.5 ± 7.0 pF for PT, and 75.8 ± 12.3 pF for DT cells). The mean values of the normalized conductance obtained were 16.0 ± 2.4 pS/pF in PCs, 40.3 ± 8.1 pS/pF in PT cells, and 4.2 ± 3.4 pS/pF in DT cells. Therefore, the normalization suggests that the surface conductance density is twofold higher in PT PVIs than in PCs, but it is very low in DT PVIs (∼10% of the density value obtained in PCs; p = 0.0001, Kruskal–Wallis test with Dunn's posttest; p < 0.05 for the pairwise comparison of DT cells against both PT cells and PCs).
GABABRs inhibit GABA release from both PT and DT axon terminals
The presence of immunogold labeling for GABABRs on PVI axon terminals (Fig. 2D) suggests a role for these receptors in controlling the output of the interneurons. To determine the level of presynaptic inhibition mediated by GABABRs, we performed paired recordings from CA1 PVIs and synaptically coupled PCs and monitored GABAAR-mediated unitary IPSCs. Subsequent immunocytochemical and morphological analysis revealed 12 PVIs, of which 7 were identified as PT PVIs (Fig. 7A, left) and 5 as DT cells (Fig. 7A, right). Unitary IPSCs elicited by PT PVIs in PCs had a mean amplitude of 85.5 ± 31.5 pA (range: 5.0–238.7 pA). Bath application of baclofen (10 μm) reduced the IPSC amplitude to 57.1 ± 0.4% of control (p = 0.008, Wilcoxon signed-rank test, Fig. 7B,C,E), whereas subsequent bath application of the selective antagonist CGP (5 μm) reversed the IPSC amplitude to 99.6 ± 6.9% of the control level (5 pairs, p = 0.4). Interestingly, unitary IPSCs elicited by DT PVIs in PCs (mean amplitude: 64.8 ± 61.9 pA; range: 4.3–286.1 pA) were more strongly reduced to 33.5 ± 10.5% of control by baclofen application (p = 0.031; Fig. 7B,D,E). CGP application reversed this effect to 93.3 ± 32.5% of control IPSC amplitude (3 pairs, p = 0.4). Interestingly, comparison of the two types further revealed that presynaptic inhibition by baclofen at DT PVI- PC synapses was stronger than that at PT PVI-PC synapses (p = 0.018). The membrane potential of the presynaptic interneurons was not kept constant during current-clamp recordings, but allowed to fluctuate naturally, so baclofen application resulted in a 6.1 ± 1.1 mV hyperpolarizing shift (p = 0.016) in PT cells. In DT PVIs, the change was substantially smaller and not significantly different from the control level (2.0 ± 1.1 mV hyperpolarization, p = 0.0625), which is consistent with lower postsynaptic GABABR-mediated responses in this interneuron subtype (see above). The somatic hyperpolarization may have contributed to the reduced synaptic transmission at the output of the interneurons (Alle and Geiger, 2006); however, the inverse relationship of the degree of hyperpolarization and the reduction in IPSC amplitudes in the two types suggests that the baclofen effect was preferentially mediated by presynaptic receptors.
Figure 7.

Presynaptic GABABRs inhibit synaptic transmission at PVI interneuron to PC synapses. A, Left: Reconstruction of a PT PVI, a putative basket cell, with dense axonal arbor (in red) in str. pyramidale (str. pyr.) and a postsynaptic PC (in blue). Right: Reconstruction of a DT PVI with axonal arbor (red) mainly found in the str. radiatum (str. rad.) and oriens (str. ori.) and a postsynaptic PC (in blue). Insets illustrate the immunoreactivity for PV (left, green pseudocolor) in the biocytin-filled cell bodies (right, blue; scale bar, 20 μm); traces show the responses of the presynaptic PVIs (top) and the postsynaptic PCs (bottom) to a family of hyperpolarizing and depolarizing current pulses (−250 to 250 pA, 50 pA steps, 500 ms duration). B, Action potentials (red, top traces) in the presynaptic PT (left panel) and DT (right panel) PVIs were followed by fast IPSCs (blue, bottom traces, averages of 30 responses) in the synaptically coupled PCs. Note that IPSC amplitudes in both pairs were reduced during baclofen application but recovered in CGP. C, D, Amplitudes of unitary IPSCs plotted as a function of time for the two PVI-PC pairs illustrated in B. The time of bath application of baclofen and CGP is indicated by the boxes above. E, Summary bar charts of the normalized ISPC amplitudes during baclofen and CGP application from PT-PC (light gray bars) and DT-PC (dark gray bars) pairs (number of pairs shown underneath bars); mean data are overlain by individual pair data (open circles). ns, p > 0.05; *p < 0.05; **p < 0.01; ***p < 0.001.
GABABRs can modulate PVI network activity at theta frequencies
Activation of extrasynaptic GABABRs requires spillover of GABA, as occurs when larger assemblies of interneurons discharge synchronously during theta oscillations (Scanziani, 2000). Although PVIs preferentially fire at gamma frequencies, several types of PV-negative DT interneuron discharge at theta frequencies phase locked to the oscillations (Klausberger and Somogyi, 2008). We investigated the impact of GABABR-mediated inhibition on the activity of PT PVIs under these conditions by using a reductionist computational model consisting of a network of 200 FS cells representing PT PVIs and 20 theta-spiking cells (TCs) as the source of GABABR-mediated inhibition (Fig. 8). FS cells were interconnected by fast mutual inhibitory synapses with shunting effects (Vida et al., 2006), whereas TC connections onto FS cells elicited slow hyperpolarizing IPSCs.
Figure 8.
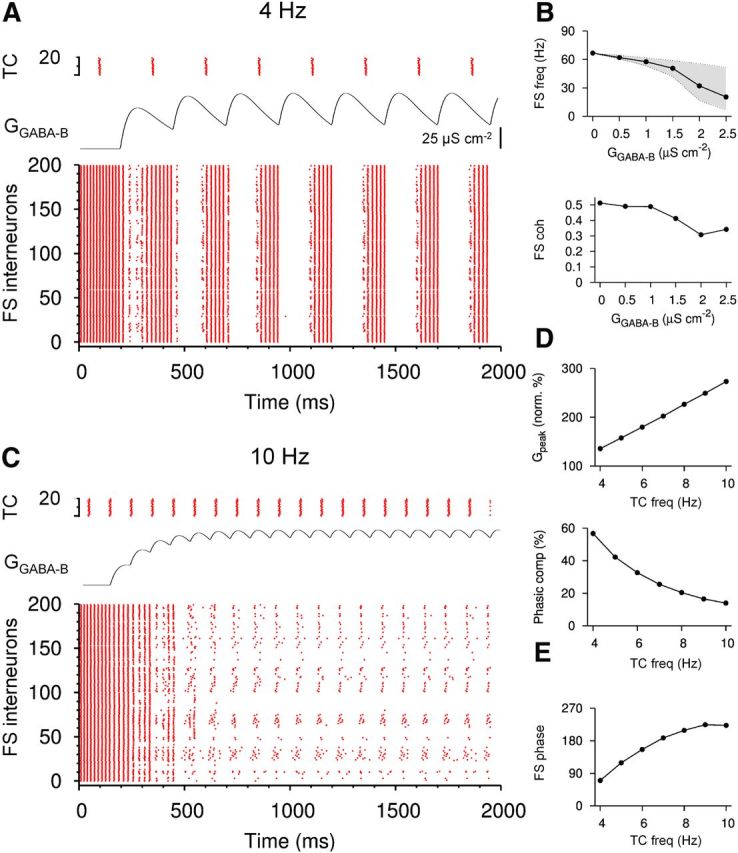
Slow GABABR-mediated conductances modulate the discharge at theta frequencies in a FS neuron network model. A, Raster plots of the activity in a mixed network model of 200 FS cells (bottom) and 20 TCs (top). Discharge frequency of TCs was 4 Hz. The compound GABAB conductance (GGABA-B) elicited in a single FS by TCs is illustrated between the raster plots. Peak amplitude of the unitary GABAB conductance was set to 25 μS cm−2. B, FS network frequency (top) and coherence (bottom) plotted against the unitary conductance amplitude (gGABA-B). Upper boundary of the shaded area in the frequency plot indicates the instantaneous frequencies measured at the trough of the compound conductance; lower values correspond to frequencies at the peak of the conductance. C, Raster plots of the activity in the mixed network with the TCs discharging at 10 Hz. GGABA-B was adjusted to match the steady-state peak amplitude of the compound conductance to that at 4 Hz TC discharge (A). Note the switch from gamma (66 Hz) to theta frequency activity (10 Hz) as the GABAB conductance summates progressively. D, Steady-state peak amplitude of the conductance normalized to the peak conductance elicited by first action potentials in TCs (top) and the proportion of the phasic component (bottom) during steady-state summation plotted against the discharge frequency of TCs. E, Phase of FS discharge relative to the TC cycle plotted against the discharge frequency of TCs.
In the absence of slow inhibition, FS cells generated coherent gamma oscillations when activated by a tonic excitatory drive (Bartos et al., 2001; Vida et al., 2006). With default parameter settings (see Materials and Methods), the mean frequency of the isolated FS network was 66.7 ± 0.4 Hz with a coherence of 0.51 ± 0.01. When TCs were activated to produce GABABR-mediated inhibition, the mean frequency in the FS subnetwork decreased monotonically with increasing conductance amplitude, as expected. With TCs discharging synchronously at 4 Hz, the mean network frequency was reduced to 57.6 ± 0.3 Hz at a unitary conductance amplitude of 1 μS cm−2 and to 20.4 ± 0.2 Hz at 25 μS cm−2 (Fig. 8A,B). Coherence in the FS network also declined with increasing conductance amplitude, but even at the highest amplitudes tested, a substantial level of coherence was maintained (0.34 ± 0.02; Fig. 8B).
FS network frequency was not constant over time, but changed rhythmically and was phase locked to the discharge of the TCs and fluctuations in the compound GABABR-mediated conductance (Fig. 8A). Network frequency modulation was strong at high conductance amplitudes. At a unitary conductance of 25 μS cm−2, FS cells fired at 51.5 ± 0.1 Hz at the trough of the compound conductance, but only at 6.5 ± 0.02 Hz at the peak (Fig. 8A,B). With a lower GABAB conductance amplitude of 1 μS cm−2, the observed modulation was weaker and the FS network frequency alternated between 61.2 ± 0.1 Hz at the troughs of the conductance and 53.1 ± 0.1 Hz at the peaks (Fig. 8B).
Frequency modulation of FS network was not only dependent on amplitude of GABAB conductance, but also on the discharge frequency of TCs. With increasing TC frequency, GABABR-mediated conductance showed progressive temporal summation in FS cells, resulting in a close to linear increase in the peak amplitude of the compound conductance (Fig. 8D). The larger amplitude of the compound conductance resulted in further reduction in the FS network frequency and, eventually, suppression of the neurons (data not shown). In contrast, the fluctuation between peaks and troughs of the compound conductance was reduced with increasing TC frequency, dropping from 56.7% of the peak amplitude at 4 Hz to 14.0% at 10 Hz (Fig. 8D). As a consequence, the frequency modulation of the FS network was weaker when TCs discharged at higher theta frequencies. Finally, when high theta discharge of TCs was combined with a larger GABAB conductance, the FS network pattern changed from a theta-modulated gamma activity to theta oscillation (10 Hz, 1 μS cm−2; Fig. 8C). Increasing discharge frequency of TCs also influenced the theta phase of FS cell activity relative to TCs. At 4 Hz, FS cells discharged preferentially at 70° after TCs, whereas at 10 Hz, the preferred firing phase shifted to 223° (Fig. 8E). In summary, our results suggest that postsynaptic GABABR-mediated conductance could modulate firing of PV-expressing PT cells and may contribute to the generation of nested theta-gamma oscillations in hippocampal circuits.
Discussion
The results of this study demonstrate that functional GABABRs and their postsynaptic effector, Kir3 channels, are expressed in hippocampal PVIs. Light and electron microscopic analysis revealed that receptor and channel subunits are present in PVIs and preferentially localize to extrasynaptic membrane of dendrites and, to a lesser degree, axon terminals. Whole-cell recordings provided evidence that GABA synaptically released by various interneuron types elicits slow IPSCs in PT, but not DT, interneurons. In contrast, the synaptic output of both PT and DT PVIs is modulated by GABABRs, albeit more strongly so in the latter. Finally, computational analysis suggested that GABABRs in PT PVIs can modulate their discharge dynamically and may contribute to the generation of complex network patterns.
High density of surface-localized GABABRs in PVIs
Consistent with previous immunofluorescent investigations (Sloviter et al., 1999), somatic immunoreactivity for GABAB1 in PV-positive cells was weak. Nevertheless, at the ultrastructural level, we found high densities of GABABRs on the somatodendritic membrane of PVIs. Although these results seem contradictory, previous autoradiographic data indicated that the somatic labeling for GABAB1 does not correspond to surface-localized binding sites (Sloviter et al., 1999). Rather, this signal is dominated by immunoreactivity associated to the ER and presumably reflects a reserve pool of receptor protein (Kulik et al., 2003). For surface localization and formation of functional receptors, the GABAB1 subunit needs to heterodimerize with GABAB2 (Bettler et al., 2004). Conceivably, in interneurons with strong somatic immunoreactivity, GABAB1 accumulates in the ER because it is produced at higher levels than GABAB2. In contrast, in PVIs, the two subunits are probably produced at similar rates and assemble and move rapidly to surface membranes. Accordingly, the heterogeneity observed in somatic immunoreactivity among interneuron types (Sloviter et al., 1999) plausibly reflects differences in production and trafficking of the two subunits. Because immunolabeling observed in PVIs and PCs through light and electron microscopic analysis was comparable in both qualitative and quantitative terms (Sloviter et al., 1999; Kulik et al., 2003), mechanisms of trafficking and surface expression of GABABRs in these interneurons are likely to be comparable to those in PCs but differ from other interneurons.
Surface-localized GABABRs were found mainly on the extrasynaptic membrane of PV-immunoreactive dendrites and, at lower levels, on axon terminals. This distribution corresponds well to that in hippocampal PCs (Kulik et al., 2003), as well as various neuron types in the neocortex (Gonchar et al., 2001), cerebellum and ventrobasal thalamus (Ige et al., 2000; Kulik et al., 2002). Extrasynaptic receptors require diffusion of the transmitter from synapses; therefore, our data provide further evidence for the spillover-dependent activation of GABABRs (Isaacson et al., 1993; Scanziani, 2000; Oláh et al., 2009). Although GABABRs on interneuron axons can act as autoreceptors, the cellular source of GABA for the activation of postsynaptic GABABRs remains controversial. Neurogliaform cells and “ivy” cells are likely sources (Tamás et al., 2003; Price et al., 2005, 2008; Krook-Magnuson et al., 2011); however, other dendrite-targeting interneurons could be involved (Newberry and Nicoll, 1984; Forti and Michelson, 1998; Lafourcade and Alger, 2008). Our data support the notion that diverse interneuron types contribute to GABABR-mediated effects (Fig. 5).
Kir3 channels in PVIs
Postsynaptic GABABRs colocalize and couple with Kir3 channels (Lüscher et al., 1997; Kaupmann et al., 1998; Kulik et al., 2006). In cortical neurons, Kir3 channels are heterotetramers predominantly composed of Kir3.1 and Kir3.2 subunits (Liao et al., 1996; Lüscher et al., 1997; Leaney, 2003). Both proteins are found consistently on PVI dendrites, albeit at lower levels than in PCs. The third major subunit, Kir3.3, has been reported to be highly expressed in a subset of interneurons localized to the axon (Grosse et al., 2003). Our results show that Kir3.3 channels are also present on dendrites of PVIs at densities comparable to that in PCs. Kir3.3 can associate with the Kir3.1 subunit and form functional channels in complexes with GABABRs (Ciruela et al., 2010). Consistent with the immunocytochemical data, electrophysiological recordings revealed large synaptic and baclofen-induced whole-cell currents in PT interneurons that were comparable to those in PCs. Surprisingly, normalization using whole-cell capacitance indicated a twofold higher conductance density in PT cells than in PCs, possibly reflecting a tighter coupling of GABABRs and Kir3 channels in PT PVIs.
Quantification of immunogold particles indicated high GABABR and Kir3 channel densities on the order of 10 particles/μm2 in PV-positive dendrites. Therefore, we estimate ∼120,000 channels on a single PVI (somatodendritic surface area: 12,000 μm−2; Bartos et al., 2001), which is likely to be an underestimate because not all protein molecules are detected by antibodies (Nusser et al., 1998). Interestingly, the number of channels activated pharmacologically in these cells appears to be much lower. Assuming a single-channel conductance between 5 and 31 pS, and an open probability of 0.119 (Takigawa and Alzheimer, 1999; Chen and Johnston, 2005), only ∼110–700 open channels, from a pool of ∼900–5900 activated channels, contribute to the baclofen-induced currents measured in PT cells. Therefore, only 1–5% of surface-localized dendritic Kir3 channels are recruited by GABABRs. This might be explained by the fact that Kir3 channels serve as common effector for a variety of metabotropic receptors (Lüscher et al., 1997) and only a subset of channels co-cluster with GABABRs (Kulik et al., 2006). However, this question remains open ended and requires further investigation.
Differential expression of GABABR-mediated effects in PT and DT cells
Whole-cell recordings demonstrated substantial GABABR-mediated currents in most, but not all, PVIs. Morphological identification revealed that slow IPSCs and baclofen-induced currents were large in PT PVIs, but were small or absent in DT cells. The differential expression of GABABR-mediated IPSCs adds to the list of differences in the morphology, intrinsic physiological and synaptic properties, and molecular composition (Buhl et al., 1996; Halasy et al., 1996; Pawelzik et al., 2002; Baude et al., 2007; Nissen et al., 2010; Lee et al., 2011), collectively indicating functional specialization of PVI subtypes. The absence of postsynaptic GABABR-mediated hyperpolarization may underlie differences in the activity patterns, in particular the higher discharge frequencies observed in bistratified cells in vitro and in vivo (Klausberger et al., 2003, 2004; Hájos et al., 2004; Gloveli et al., 2005). Furthermore, increasing postsynaptic GABABR activation could shift the balance from PVI-mediated perisomatic inhibition to dendritic inhibition in PCs, although activation of presynaptic receptors may partially counterbalance this effect. It remains to be established how the effects of GABABRs and extrasynaptic α1-containing GABAARs, which are highly expressed by these cell types (Baude et al., 2007), combine as a function of extracellular GABA levels.
Possible function of GABABRs in PVIs during network oscillations
GABABR-mediated inhibition onto inhibitory interneurons is expected to produce disinhibition. However, simultaneous inhibition onto PCs counterbalances this effect in the network and attenuates or terminates population activity (Scanziani, 2000; Brown et al., 2007; Mann et al., 2009). In view of the central role of FS PVIs in network oscillations (Klausberger et al., 2004; Sohal et al., 2009), GABABRs on PT cells are strategically located to modulate oscillatory power and frequency. Beyond tonic effects, however, GABABRs may also serve dynamic roles during oscillations (Molyneaux and Hasselmo, 2002). Accordingly, our simulations using a simplified network model indicated that, despite slow kinetics, rhythmic GABABR-mediated inhibition produced by a synchronized interneuron population could modulate the discharge of PVIs at theta frequencies.
During theta oscillations in vivo, PT PVIs discharge out of phase, preceding PCs by ∼195–73° in both anesthetized and freely moving animals (Klausberger et al., 2003; Lapray et al., 2012; Varga et al., 2012). In fact, PC activity is suppressed by strong perisomatic inhibition when excitatory input onto their distal dendrites from the entorhinal cortex is strong (Kamondi et al., 1998; Losonczy et al., 2010). However, the distribution of input synapses of PV basket cells and PCs are similar (Gulyás et al., 1999) and, therefore, they are likely to receive comparable spatiotemporal input patterns. If this is the case, why do interneurons discharge out of phase with PCs? First, the excitatory input from the entorhinal cortex onto the distal dendrites of basket cells in str. lacunosum-moleculare (Halasy et al., 1996, but see Varga et al., 2012) may efficiently propagate to the soma and drive these interneurons because, in contrast to PCs, their dendritic membranes have high resistance (Golding et al., 2005; Nörenberg et al., 2010). Second, perisomatic inhibition produces less suppression of interneurons due to the rapid kinetics of mutual inhibitory synapses (Bartos et al., 2001). Finally, shunting inhibition could promote gamma frequency synchronization in basket cells (Vida et al., 2006). In this context, GABABR-mediated inhibition recruited by entorhinal input (Dvorak-Carbone and Schuman, 1999; Kwag and Paulsen, 2009) may contribute to the silencing of PV basket cells and disinhibition of PC somata in the opposite phase of the cycle (Tóth et al., 1997). In contrast, the absence of distal dendrites in the str. lacunosum-moleculare (Halasy et al., 1996) and low expression of postsynaptic GABABRs could explain why DT bistratified cells do not discharge together with PT basket cells, but rather with PCs during theta activity (Klausberger et al., 2004). In conclusion, our results suggest that a divergence of hippocampal PVIs in postsynaptic GABABR-mediated signaling can contribute to their differential participation in hippocampal rhythmogenesis.
Footnotes
This work was supported by the Deutsche Forschungsgemeinschaft (Grant #SFB 780 to A.K. and M.F.; and Grant #SFB TR3 to I.V. and M.F.), Excellence Initiative of the German Research Foundation (Grant #EXC 257 to I.V. and Grant #GSC-4, Spemann Graduate School, to D.A.), BIOSS-2 (Grant #A6 to A.K), National Institutes of Health (Grant #MH061933 to K.W. and Grant #T32DA007097 to M.H), The McNaught Bequest (to S.A.B and I.V.), and Tenovus Scotland (to I.V.). M.F. is Hertie Senior Research Professor of the Hertie Foundation, Germany. VGAT-Venus transgenic rats were generated by Drs. Y. Yanagawa, M. Hirabayashi, and Y. Kawaguchi at the National Institute for Physiological Sciences, Okazaki, Japan, using pCS2-Venus provided by Dr. A. Miyawaki. We thank Natalie Callies, Sigrun Nestel, Anikó Schneider, Ina Wolter, and Ulrich Noeller for excellent technical support, Katarina Pankova and Jie Song for contributions to cell reconstructions, and Drs. Yugo Fukazawa and Tengis Gloveli for helpful comments on the manuscript.
References
- Alle H, Geiger JR. Combined analog and action potential coding in hippocampal mossy fibers. Science. 2006;311:1290–1293. doi: 10.1126/science.1119055. [DOI] [PubMed] [Google Scholar]
- Bartos M, Vida I, Frotscher M, Geiger JR, Jonas P. Rapid signaling at inhibitory synapses in a dentate gyrus interneuron network. J Neurosci. 2001;21:2687–2698. doi: 10.1523/JNEUROSCI.21-08-02687.2001. [DOI] [PMC free article] [PubMed] [Google Scholar]
- Baude A, Bleasdale C, Dalezios Y, Somogyi P, Klausberger T. Immunoreactivity for the GABAA receptor alpha1 subunit, somatostatin and Connexin36 distinguishes axo-axonic, basket, and bistratified interneurons of the rat hippocampus. Cereb Cortex. 2007;17:2094–2107. doi: 10.1093/cercor/bhl117. [DOI] [PubMed] [Google Scholar]
- Bettahi I, Marker CL, Roman MI, Wickman K. Contribution of the Kir3.1 subunit to the muscarinic-gated atrial potassium channel IKACh. J Biol Chem. 2002;277:48282–48288. doi: 10.1074/jbc.M209599200. [DOI] [PubMed] [Google Scholar]
- Bettler B, Kaupmann K, Mosbacher J, Gassmann M. Molecular structure and physiological functions of GABA(B) receptors. Phys Rev. 2004;84:835–867. doi: 10.1152/physrev.00036.2003. [DOI] [PubMed] [Google Scholar]
- Brown JT, Davies CH, Randall AD. Synaptic activation of GABA(B) receptors regulates neuronal network activity and entrainment. Eur J Neurosci. 2007;25:2982–2990. doi: 10.1111/j.1460-9568.2007.05544.x. [DOI] [PubMed] [Google Scholar]
- Buhl EH, Szilágyi T, Halasy K, Somogyi P. Physiological properties of anatomically identified basket and bistratified cells in the CA1 area of the rat hippocampus in vitro. Hippocampus. 1996;6:294–305. doi: 10.1002/(SICI)1098-1063(1996)6:3<294::AID-HIPO7>3.0.CO;2-N. [DOI] [PubMed] [Google Scholar]
- Chen X, Johnston D. Constitutively active G-protein-gated inwardly rectifying K+ channels in dendrites of hippocampal CA1 pyramidal neurons. J Neurosci. 2005;25:3787–3792. doi: 10.1523/JNEUROSCI.5312-04.2005. [DOI] [PMC free article] [PubMed] [Google Scholar]
- Ciruela F, Fernández-Dueñas V, Sahlholm K, Fernández-Alacid L, Nicolau JC, Watanabe M, Luján R. Evidence for oligomerization between GABAB receptors and GIRK channels containing the GIRK1 and GIRK3 subunits. Eur J Neurosci. 2010;32:1265–1277. doi: 10.1111/j.1460-9568.2010.07356.x. [DOI] [PubMed] [Google Scholar]
- Dvorak-Carbone H, Schuman EM. Patterned activity in stratum lacunosum moleculare inhibits CA1 pyramidal neuron firing. J Neurophysiol. 1999;82:3213–3222. doi: 10.1152/jn.1999.82.6.3213. [DOI] [PubMed] [Google Scholar]
- Forti M, Michelson HB. Synaptic connectivity of distinct hilar interneuron subpopulations. J Neurophysiol. 1998;79:3229–3237. doi: 10.1152/jn.1998.79.6.3229. [DOI] [PubMed] [Google Scholar]
- Freund TF, Katona I. Perisomatic inhibition. Neuron. 2007;56:33–42. doi: 10.1016/j.neuron.2007.09.012. [DOI] [PubMed] [Google Scholar]
- Fritschy JM, Meskenaite V, Weinmann O, Honer M, Benke D, Mohler H. GABAB-receptor splice variants GB1a and GB1b in rat brain: developmental regulation, cellular distribution and extrasynaptic localization. Eur J Neurosci. 1999;11:761–768. doi: 10.1046/j.1460-9568.1999.00481.x. [DOI] [PubMed] [Google Scholar]
- Galarreta M, Hestrin S. Electrical and chemical synapses among parvalbumin fast-spiking GABAergic interneurons in adult mouse neocortex. Proc Natl Acad Sci U S A. 2002;99:12438–12443. doi: 10.1073/pnas.192159599. [DOI] [PMC free article] [PubMed] [Google Scholar]
- Gloveli T, Dugladze T, Saha S, Monyer H, Heinemann U, Traub RD, Whittington MA, Buhl EH. Differential involvement of oriens/pyramidale interneurones in hippocampal network oscillations in vitro. J Physiol. 2005;562:131–147. doi: 10.1113/jphysiol.2004.073007. [DOI] [PMC free article] [PubMed] [Google Scholar]
- Golding NL, Mickus TJ, Katz Y, Kath WL, Spruston N. Factors mediating powerful voltage attenuation along CA1 pyramidal neuron dendrites. J Physiol. 2005;568:69–82. doi: 10.1113/jphysiol.2005.086793. [DOI] [PMC free article] [PubMed] [Google Scholar]
- Gonchar Y, Pang L, Malitschek B, Bettler B, Burkhalter A. Subcellular localization of GABA(B) receptor subunits in rat visual cortex. J Comp Neurol. 2001;431:182–197. doi: 10.1002/1096-9861(20010305)431:2<182::AID-CNE1064>3.0.CO%3B2-K. [DOI] [PubMed] [Google Scholar]
- Grosse G, Eulitz D, Thiele T, Pahner I, Schröter S, Takamori S, Grosse J, Wickman K, Tapp R, Veh RW, Ottersen OP, Ahnert-Hilger G. Axonal sorting of Kir3.3 defines a GABA-containing neuron in the CA3 region of rodent hippocampus. Mol Cell Neurosci. 2003;24:709–724. doi: 10.1016/S1044-7431(03)00234-3. [DOI] [PubMed] [Google Scholar]
- Gulyás AI, Megías M, Emri Z, Freund TF. Total number and ratio of excitatory and inhibitory synapses converging onto single interneurons of different types in the CA1 area of the rat hippocampus. J Neurosci. 1999;19:10082–10097. doi: 10.1523/JNEUROSCI.19-22-10082.1999. [DOI] [PMC free article] [PubMed] [Google Scholar]
- Hájos N, Pálhalmi J, Mann EO, Németh B, Paulsen O, Freund TF. Spike timing of distinct types of GABAergic interneuron during hippocampal gamma oscillations in vitro. J Neurosci. 2004;24:9127–9137. doi: 10.1523/JNEUROSCI.2113-04.2004. [DOI] [PMC free article] [PubMed] [Google Scholar]
- Halasy K, Buhl EH, Lörinczi Z, Tamás G, Somogyi P. Synaptic target selectivity and input of GABAergic basket and bistratified interneurons in the CA1 area of the rat hippocampus. Hippocampus. 1996;6:306–329. doi: 10.1002/(SICI)1098-1063(1996)6:3<306::AID-HIPO8>3.0.CO%3B2-K. [DOI] [PubMed] [Google Scholar]
- Hines ML, Carnevale NT. The NEURON simulation environment. Neural Comput. 1997;9:1179–1209. doi: 10.1162/neco.1997.9.6.1179. [DOI] [PubMed] [Google Scholar]
- Ige AO, Bolam JP, Billinton A, White JH, Marshall FH, Emson PC. Cellular and subcellular localisation of GABAB1 and GABAB2 receptor proteins in the rat cerebellum. Mol Brain Res. 2000;83:72–80. doi: 10.1016/S0169-328X(00)00199-6. [DOI] [PubMed] [Google Scholar]
- Isaacson JS, Solís JM, Nicoll RA. Local and diffuse synaptic actions of GABA in the hippocampus. Neuron. 1993;10:165–175. doi: 10.1016/0896-6273(93)90308-E. [DOI] [PubMed] [Google Scholar]
- Kamondi A, Acsády L, Wang XJ, Buzsáki G. Theta oscillations in somata and dendrites of hippocampal pyramidal cells in vivo: activity-dependent phase-precession of action potentials. Hippocampus. 1998;8:244–261. doi: 10.1002/(SICI)1098-1063(1998)8:3<244::AID-HIPO7>3.0.CO%3B2-J. [DOI] [PubMed] [Google Scholar]
- Kaupmann K, Schuler V, Mosbacher J, Bischoff S, Bittiger H, Heid J, Froestl W, Leonhard S, Pfaff T, Karschin A, Bettler B. Human gamma-aminobutyric acid type B receptors are differentially expressed and regulate inwardly rectifying K+ channels. Proc Natl Acad Sci U S A. 1998;95:14991–14996. doi: 10.1073/pnas.95.25.14991. [DOI] [PMC free article] [PubMed] [Google Scholar]
- Klausberger T, Somogyi P. Neuronal diversity and temporal dynamics: the unity of hippocampal circuit operations. Science. 2008;321:53–57. doi: 10.1126/science.1149381. [DOI] [PMC free article] [PubMed] [Google Scholar]
- Klausberger T, Magill PJ, Márton LF, Roberts JD, Cobden PM, Buzsáki G, Somogyi P. Brain-state- and cell-type-specific firing of hippocampal interneurons in vivo. Nature. 2003;421:844–848. doi: 10.1038/nature01374. [DOI] [PubMed] [Google Scholar]
- Klausberger T, Márton LF, Baude A, Roberts JD, Magill PJ, Somogyi P. Spike timing of dendrite-targeting bistratified cells during hippocampal network oscillations in vivo. Nat Neurosci. 2004;7:41–47. doi: 10.1038/nn1159. [DOI] [PubMed] [Google Scholar]
- Koyrakh L, Luján R, Colón J, Karschin C, Kurachi Y, Karschin A, Wickman K. Molecular and cellular diversity of neuronal G-protein-gated potassium channels. J Neurosci. 2005;25:11468–11478. doi: 10.1523/JNEUROSCI.3484-05.2005. [DOI] [PMC free article] [PubMed] [Google Scholar]
- Krook-Magnuson E, Luu L, Lee SH, Varga C, Soltesz I. Ivy and neurogliaform interneurons are a major target of μ-opioid receptor modulation. J Neurosci. 2011;31:14861–14870. doi: 10.1523/JNEUROSCI.2269-11.2011. [DOI] [PMC free article] [PubMed] [Google Scholar]
- Kulik A, Nakadate K, Nyíri G, Notomi T, Malitschek B, Bettler B, Shigemoto R. Distinct localization of GABAB receptors relative to synaptic sites in the rat cerebellum and ventrobasal thalamus. Eur J Neurosci. 2002;15:291–307. doi: 10.1046/j.0953-816x.2001.01855.x. [DOI] [PubMed] [Google Scholar]
- Kulik A, Vida I, Luján R, Haas CA, López-Bendito G, Shigemoto R, Frotscher M. Subcellular localization of metabotropic GABAB receptor subunits GABAB1a/b and GABAB2 in the rat hippocampus. J Neurosci. 2003;23:11026–11035. doi: 10.1523/JNEUROSCI.23-35-11026.2003. [DOI] [PMC free article] [PubMed] [Google Scholar]
- Kulik A, Vida I, Fukazawa Y, Guetg N, Kasugai Y, Marker CL, Rigato F, Bettler B, Wickman K, Frotscher M, Shigemoto R. Compartment-dependent colocalization of Kir3.2-containing K+ channels and GABAB receptors in hippocampal pyramidal cells. J Neurosci. 2006;26:4289–4297. doi: 10.1523/JNEUROSCI.4178-05.2006. [DOI] [PMC free article] [PubMed] [Google Scholar]
- Kwag J, Paulsen O. The timing of external input controls the sign of plasticity at local synapses. Nat Neurosci. 2009;12:1219–1221. doi: 10.1038/nn.2388. [DOI] [PubMed] [Google Scholar]
- Lafourcade CA, Alger BE. Distinctions among GABAA and GABAB responses revealed by calcium channel antagonists, cannabinoids, opioids, and synaptic plasticity in rat hippocampus. Psychopharmacology (Berl) 2008;198:539–549. doi: 10.1007/s00213-007-1040-4. [DOI] [PMC free article] [PubMed] [Google Scholar]
- Lapray D, Lasztoczi B, Lagler M, Viney TJ, Katona L, Valenti O, Hartwich K, Borhegyi Z, Somogyi P, Klausberger T. Behavior-dependent specialization of identified hippocampal interneurons. Nat Neurosci. 2012;15:1265–1271. doi: 10.1038/nn.3176. [DOI] [PMC free article] [PubMed] [Google Scholar]
- Leaney JL. Contribution of Kir3.1, Kir3.2A and Kir3.2C subunits to native G protein-gated inwardly rectifying potassium currents in cultured hippocampal neurons. Eur J Neurosci. 2003;18:2110–2118. doi: 10.1046/j.1460-9568.2003.02933.x. [DOI] [PubMed] [Google Scholar]
- Lee SY, Földy C, Szabadics J, Soltesz I. Cell-type-specific CCK2 receptor signaling underlies the cholecystokinin-mediated selective excitation of hippocampal parvalbumin-positive fast-spiking basket cells. J Neurosci. 2011;31:10993–11002. doi: 10.1523/JNEUROSCI.1970-11.2011. [DOI] [PMC free article] [PubMed] [Google Scholar]
- Li JL, Shigemoto R, Kulik A, Chen P, Nomura S, Kaneko T, Mizuno N. Immunocytochemical localization of GABAB receptors in mesencephalic trigeminal nucleus neurons in the rat. Neurosci Lett. 2001;315:93–97. doi: 10.1016/S0304-3940(01)02321-7. [DOI] [PubMed] [Google Scholar]
- Liao YJ, Jan YN, Jan LY. Heteromultimerization of G-protein-gated inwardly rectifying K+ channel proteins GIRK1 and GIRK2 and their altered expression in weaver brain. J Neurosci. 1996;16:7137–7150. doi: 10.1523/JNEUROSCI.16-22-07137.1996. [DOI] [PMC free article] [PubMed] [Google Scholar]
- Longair MH, Baker DA, Armstrong JD. Simple Neurite Tracer: Open Source software for reconstruction, visualization and analysis of neuronal processes. Bioinformatics. 2011;27:2453–2454. doi: 10.1093/bioinformatics/btr390. [DOI] [PubMed] [Google Scholar]
- Losonczy A, Zemelman BV, Vaziri A, Magee JC. Network mechanisms of theta related neuronal activity in hippocampal CA1 pyramidal neurons. Nat Neurosci. 2010;13:967–972. doi: 10.1038/nn.2597. [DOI] [PMC free article] [PubMed] [Google Scholar]
- Lüscher C, Jan LY, Stoffel M, Malenka RC, Nicoll RA. G protein-coupled inwardly rectifying K+ channels (GIRKs) mediate postsynaptic but not presynaptic transmitter actions in hippocampal neurons. Neuron. 1997;19:687–695. doi: 10.1016/S0896-6273(00)80381-5. [DOI] [PubMed] [Google Scholar]
- Mann EO, Kohl MM, Paulsen O. Distinct roles of GABA(A) and GABA(B) receptors in balancing and terminating persistent cortical activity. J Neurosci. 2009;29:7513–7518. doi: 10.1523/JNEUROSCI.6162-08.2009. [DOI] [PMC free article] [PubMed] [Google Scholar]
- Markram H, Toledo-Rodriguez M, Wang Y, Gupta A, Silberberg G, Wu C. Interneurons of the neocortical inhibitory system. Nat Rev Neurosci. 2004;5:793–807. doi: 10.1038/nrn1519. [DOI] [PubMed] [Google Scholar]
- Molyneaux BJ, Hasselmo ME. GABA(B) presynaptic inhibition has an in vivo time constant sufficiently rapid to allow modulation at theta frequency. J Neurophysiol. 2002;87:1196–1205. doi: 10.1152/jn.00077.2001. [DOI] [PubMed] [Google Scholar]
- Mott DD, Li Q, Okazaki MM, Turner DA, Lewis DV. GABAB-Receptor-mediated currents in interneurons of the dentate-hilus border. J Neurophysiol. 1999;82:1438–1450. doi: 10.1152/jn.1999.82.3.1438. [DOI] [PubMed] [Google Scholar]
- Newberry NR, Nicoll RA. A bicuculline-resistent inhibitory post-synaptic potential in rat hippocampal pyramidal cells in vitro. J Physiol. 1984;348:239–254. doi: 10.1113/jphysiol.1984.sp015107. [DOI] [PMC free article] [PubMed] [Google Scholar]
- Nissen W, Szabo A, Somogyi J, Somogyi P, Lamsa KP. Cell type-specific long-term plasticity at glutamatergic synapses onto hippocampal interneurons expressing either parvalbumin or CB1 cannabinoid receptor. J Neurosci. 2010;30:1337–1347. doi: 10.1523/JNEUROSCI.3481-09.2010. [DOI] [PMC free article] [PubMed] [Google Scholar]
- Nörenberg A, Hu H, Vida I, Bartos M, Jonas P. Distinct nonuniform cable properties optimize rapid and efficient activation of fast-spiking GABAergic interneurons. Proc Natl Acad Sci U S A. 2010;107:894–899. doi: 10.1073/pnas.0910716107. [DOI] [PMC free article] [PubMed] [Google Scholar]
- Nusser Z, Hájos N, Somogyi P, Mody I. Increased number of synaptic GABA(A) receptors underlies potentiation at hippocampal inhibitory synapses. Nature. 1998;39:172–177. doi: 10.1038/25999. [DOI] [PubMed] [Google Scholar]
- Oláh S, Füle M, Komlósi G, Varga C, Báldi R, Barzó P, Tamás G. Regulation of cortical microcircuits by unitary GABA-mediated volume transmission. Nature. 2009;461:1278–1281. doi: 10.1038/nature08503. [DOI] [PMC free article] [PubMed] [Google Scholar]
- Pawelzik H, Hughes DI, Thomson AM. Physiological and morphological diversity of immunocytochemically defined parvalbumin- and cholecystokinin-positive interneurones in CA1 of the adult rat hippocampus. J Comp Neurol. 2002;443:346–367. doi: 10.1002/cne.10118. [DOI] [PubMed] [Google Scholar]
- Price CJ, Cauli B, Kovacs ER, Kulik A, Lambolez B, Shigemoto R, Capogna M. Neurogliaform neurons form a novel inhibitory network in the hippocampal CA1 area. J Neurosci. 2005;25:6775–6786. doi: 10.1523/JNEUROSCI.1135-05.2005. [DOI] [PMC free article] [PubMed] [Google Scholar]
- Price CJ, Scott R, Rusakov DA, Capogna M. GABAB receptor modulation of feedforward inhibition through hippocampal neurogliaform cells. J Neurosci. 2008;28:6974–6982. doi: 10.1523/JNEUROSCI.4673-07.2008. [DOI] [PMC free article] [PubMed] [Google Scholar]
- Scanziani M. GABA spillover activates postsynaptic GABAB receptors to control rhythmic hippocampal activity. Neuron. 2000;25:673–681. doi: 10.1016/S0896-6273(00)81069-7. [DOI] [PubMed] [Google Scholar]
- Schuler V, Lüscher C, Blanchet C, Klix N, Sansig G, Klebs K, Schmutz M, Heid J, Gentry C, Urban L, Fox A, Spooren W, Jaton AL, Vigouret J, Pozza M, Kelly PH, Mosbacher J, Froestl W, Käslin E, Korn R, Bischoff S, Kaupmann K, van der Putten H, Bettler B. Epilepsy, hyperalgesia, impaired memory, and loss of pre- and postsynaptic GABA(B) responses in mice lacking GABA(B1) Neuron. 2001;31:47–58. doi: 10.1016/S0896-6273(01)00345-2. [DOI] [PubMed] [Google Scholar]
- Signorini S, Liao YJ, Duncan SA, Jan LY, Stoffel M. Normal cerebellar development but susceptibility to seizures in mice lacking G protein-coupled inwardly rectifying K+ channel GIRK2. Proc Natl Acad Sci U S A. 1997;94:923–927. doi: 10.1073/pnas.94.3.923. [DOI] [PMC free article] [PubMed] [Google Scholar]
- Sloviter RS, Ali-Akbarian L, Elliott RC, Bowery BJ, Bowery NG. Localization of GABA(B) (R1) receptors in the rat hippocampus by immunocytochemistry and high resolution autoradiography, with specific reference to its localization in identified hippocampal interneuron subpopulations. Neuropharmacology. 1999;38:1707–1721. doi: 10.1016/S0028-3908(99)00132-X. [DOI] [PubMed] [Google Scholar]
- Sodickson DL, Bean BP. GABAB receptor-activated inwardly rectifying potassium current in dissociated hippocampal CA3 neurons. J Neurosci. 1996;16:6374–6385. doi: 10.1523/JNEUROSCI.16-20-06374.1996. [DOI] [PMC free article] [PubMed] [Google Scholar]
- Sohal VS, Zhang F, Yizhar O, Deisseroth K. Parvalbumin neurons and gamma rhythms enhance cortical circuit performance. Nature. 2009;459:698–702. doi: 10.1038/nature07991. [DOI] [PMC free article] [PubMed] [Google Scholar]
- Takigawa T, Alzheimer C. Variance analysis of current fluctuations of adenosine- and baclofen-activated GIRK channels in dissociated neocortical pyramidal cells. J Neurophysiol. 1999;82:1647–1650. doi: 10.1152/jn.1999.82.3.1647. [DOI] [PubMed] [Google Scholar]
- Tamás G, Lorincz A, Simon A, Szabadics J. Identified sources and targets of slow inhibition in the neocortex. Science. 2003;299:1902–1905. doi: 10.1126/science.1082053. [DOI] [PubMed] [Google Scholar]
- Torrecilla M, Marker CL, Cintora SC, Stoffel M, Williams JT, Wickman K. G-protein-gated potassium channels containing Kir3.2 and Kir3.3 subunits mediate the acute inhibitory effects of opioids on locus ceruleus neurons. J Neurosci. 2002;22:4328–4334. doi: 10.1523/JNEUROSCI.22-11-04328.2002. [DOI] [PMC free article] [PubMed] [Google Scholar]
- Tóth K, Freund TF, Miles R. Disinhibition of rat hippocampal pyramidal cells by GABAergic afferents from the septum. J Physiol. 1997;500:463–474. doi: 10.1113/jphysiol.1997.sp022033. [DOI] [PMC free article] [PubMed] [Google Scholar]
- Uematsu M, Hirai Y, Karube F, Ebihara S, Kato M, Abe K, Obata K, Yoshida S, Hirabayashi M, Yanagawa Y, Kawaguchi Y. Quantitative chemical composition of cortical GABAergic neurons revealed in transgenic Venus-expressing rats. Cereb Cortex. 2008;18:315–330. doi: 10.1093/cercor/bhm056. [DOI] [PubMed] [Google Scholar]
- Varga C, Golshani P, Soltesz I. Frequency-invariant temporal ordering of interneuronal discharges during hippocampal oscillations in awake mice. Proc Natl Acad Sci U S A. 2012;109:2726–2734. doi: 10.1073/pnas.1210929109. [DOI] [PMC free article] [PubMed] [Google Scholar]
- Vida I, Bartos M, Jonas P. Shunting inhibition improves robustness of gamma oscillations in hippocampal interneuron networks by homogenizing firing rates. Neuron. 2006;49:107–117. doi: 10.1016/j.neuron.2005.11.036. [DOI] [PubMed] [Google Scholar]
- Wulff P, Ponomarenko AA, Bartos M, Korotkova TM, Fuchs EC, Bähner F, Both M, Tort AB, Kopell NJ, Wisden W, Monyer H. Hippocampal theta rhythm and its coupling with gamma oscillations require fast inhibition onto parvalbumin-positive interneurons. Proc Natl Acad Sci U S A. 2009;106:3561–3566. doi: 10.1073/pnas.0813176106. [DOI] [PMC free article] [PubMed] [Google Scholar]