

Background: X-ray structures indicate remarkable conformational changes are involved in trapping serpin-protease acyl-intermediate complexes.
Results: Rapid kinetics showed two kinetically resolvable complexes with distinct structural attributes involved in conformational trapping.
Conclusion: The intermediate complex properties support a role for helix F in the trapping mechanism.
Significance: New insights into the mechanism of conformational trapping of serpin-protease complexes are provided.
Keywords: Calcium, Fluorescence Resonance Energy Transfer (FRET), Protease Inhibitor, Serine Protease, Serpin, F Helix, α1-Protease Inhibitor, Trypsin
Abstract
Serpin protein protease inhibitors inactivate their target proteases through a unique mechanism in which a major serpin conformational change, resulting in a 70-Å translocation of the protease from its initial reactive center loop docking site to the opposite pole of the serpin, kinetically traps the acyl-intermediate complex. Although the initial Michaelis and final trapped acyl-intermediate complexes have been well characterized structurally, the intermediate stages involved in this remarkable transformation are not well understood. To better characterize such intermediate steps, we undertook rapid kinetic studies of the FRET and fluorescence perturbation changes of site-specific fluorophore-labeled derivatives of the serpin, α1-protease inhibitor (α1PI), which report the serpin and protease conformational changes involved in transforming the Michaelis complex to the trapped acyl-intermediate complex in reactions with trypsin. Two kinetically resolvable conformational changes were observed in the reactions, ascribable to (i) serpin reactive center loop insertion into sheet A with full protease translocation but incomplete protease distortion followed by, (ii) full conformational distortion and movement of the protease and coupled serpin conformational changes involving the F helix-sheet A interface. Kinetic studies of calcium effects on the labeled α1PI-trypsin reactions demonstrated both inactive and low activity states of the distorted protease in the final complex that were distinct from the intermediate distorted state. These studies provide new insights into the nature of the serpin and protease conformational changes involved in trapping the acyl-intermediate complex in serpin-protease reactions and support a previously proposed role for helix F in the trapping mechanism.
Introduction
The serpins are a large superfamily of proteins with early evolutionary origins that are found in all types of living organisms (1, 2). The human genome encodes 35 family members, the majority of which function as intracellular and extracellular inhibitors of serine and cysteine proteases in numerous physiologic processes. Unlike most other families of protein protease inhibitors, the serpins inhibit their target proteases through a unique branched pathway suicide substrate mechanism in which the acyl-intermediate is trapped by large scale conformational changes in both the serpin and protease (3). This mechanism was elucidated through extensive biochemical and structural studies over the past 20 years. FRET mapping, x-ray, and NMR studies have characterized the structure of the initial Michaelis docking complex and provided detailed understanding of the structural changes undergone by serpin and protease in forming the trapped acyl-intermediate complex (4–8). Together, such studies have revealed a mechanism wherein acylation and cleavage of the serpin reactive center loop (RCL)4 by the protease within the initial Michaelis complex trigger a major serpin conformational change that causes the cleaved RCL to insert as a new central strand of β-sheet A. This results in the translocation of the acyl-linked protease to the opposite end of sheet A and conformational deformation of the protease as a consequence of its tight juxtaposition against the serpin. Rapid kinetic studies of the serpin-protease reaction using serpins labeled in the RCL with reporter fluorophores have observed the Michaelis complex intermediate and identified rate-limiting steps in its transformation to the trapped acyl-intermediate complex (9, 10). However, such studies did not detect intermediate states in this transformation.
The existence of such intermediate states is suggested by structures of the trapped acyl-intermediate complex that show the protease to have moved 70 Å across the length of the serpin through insertion of the cleaved RCL into sheet A and to then have undergone conformational distortion (4, 5). The finding that the protease in the trapped acyl-intermediate complex exists in inactive and low activity states in an equilibrium that can be shifted by ligands such as calcium (11) supports the existence of an intermediate state in the translocation and conformational distortion of the protease. Kinetic evidence for intermediate states preceding protease distortion has been obtained, but the nature of such intermediates has been unclear (12–14). In one proposed intermediate, the serpin F helix that overlies sheet A and obstructs the path of the protease is perturbed to a higher energy state and uses the stored energy to directly participate in driving the protease into its distorted conformation (15). To determine whether such intermediates exist and are detectable, we exploited the FRET and fluorescence perturbation changes of fluorophore-labeled α1-protease inhibitors (α1PI) previously shown to accompany reactions with protease and to report the transformation of the Michaelis complex to the trapped acyl-intermediate complex (4, 16). Rapid kinetic studies of the labeled α1PI reactions with trypsin clearly revealed two kinetically resolvable conformational changes involved in this transformation, one ascribable to the initial arrival of the protease at the bottom of sheet A and the other to protease and serpin conformational changes that kinetically trap the acyl-intermediate complex. Notably, the protease conformational changes were found to be coupled to serpin conformational changes in the serpin helix F-sheet A interface. Calcium effects on these conformational changes demonstrated the multiple states the protease can adopt in the final complex.
EXPERIMENTAL PROCEDURES
Proteins
Single cysteine variants of α1-protease inhibitor (α1PI) were produced on a “wild-type” background in which P1 Met was changed to Arg and Cys-232 was changed to Ser. Mutagenesis of α1PI residues Ser-121, Asp-159, Asn-314, and Phe-352 to cysteine was done as described previously (4, 17). Variant α1PIs were expressed in Escherichia coli BL21 cells, refolded from inclusion bodies and purified by ion exchange chromatography as described (4) with modifications (17). Protein concentrations were determined from the absorbance at 280 nm based on an extinction coefficient of 27,000 m−1 cm−1 (18). Bovine β-trypsin was purified from commercial trypsin and the anhydrotrypsin derivative prepared as previously described (19). Concentrations of active trypsin were determined by a standard chromogenic substrate assay that was calibrated with active site-titrated protease as in past studies (10). Anhydrotrypsin concentrations were determined from the 280 nm absorbance based on an extinction coefficient of 36,800 m−1 cm−1 (19). Protein purity was confirmed by SDS-PAGE analysis. Arg-C protease was purchased from Calbiochem.
Fluorophore Labeling
Single cysteine α1PI variants were labeled with the iodoacetamide derivatives of NBD or DANS fluorophore (IANBD and IAEDANS from Molecular Probes) and purified as in past studies (4, 17, 20). The extent of labeling was determined from the absorbance spectrum based on the peak absorbance of NBD at 478 nm or DANS at 330 nm and the protein absorbance at 280 nm with correction of the latter for the absorbance contribution of the fluorophores (20). Stoichiometric labeling of the proteins similar to past studies was observed.
Experimental Conditions
All experiments except where otherwise noted were performed at 25 °C in 0.1 m Hepes buffer, pH 7.4, containing 0.1 m NaCl, 0.1% PEG 8000 in the presence of 0.1 mm EDTA or varying concentrations of CaCl2.
Measurement of kass and Stoichiometry of Inhibition (SI)
Apparent association rate constants (kapp) for reaction of α1PIs with trypsin were measured by continuous assays of the loss of protease activity under pseudo-first order conditions as in previous studies (10, 17). Reactions containing variable concentrations of inhibitor and 100 μm S2222 chromogenic substrate were initiated with protease and the exponential decrease in the rate of absorbance change to a final end point was monitored for 5–10 half-lives. Progress curves were computer fit by an exponential plus linear function to obtain observed pseudo-first order rate constants (kobs). kapp was determined from the slope of linear regression fits of the proportional dependence of kobs on inhibitor concentration after correcting for substrate (S) competition by multiplying by the factor, 1 + [S]o/Km. Km values were independently measured from the dependence of the initial velocity of substrate hydrolysis on substrate concentration. SIs were determined by reacting protease with increasing molar ratios of inhibitor/protease for a time sufficient to reach a reaction end point based on measured values of kapp. Residual enzyme activity was then measured by addition of 100 μm chromogenic substrate and monitoring the initial linear rate of substrate hydrolysis. The SI was obtained from the abscissa intercept of linear regression fits of plots of residual enzyme activity against the molar ratio of inhibitor to protease. Association rate constants reflecting reaction through the inhibition pathway (kass) were obtained by multiplying kapp and SI (10). Comparison of kass values for labeled α1PI-trypsin reactions with the unlabeled α1PI-trypsin reaction showed that labeling had minimal effects on the overall reactivity of the protein (Table 1).
TABLE 1.
Association rate constants and SIs for reactions of fluorescent-labeled α1PIs with trypsin
Apparent association rate constants (kapp) and SIs were measured as described under “Experimental Procedures.” kass was calculated by multiplying kapp by the SI.
| α1PI | kapp | SI | kass |
|---|---|---|---|
| m−1 s−1 | mol I/mol E | m−1 s−1 | |
| Wild-type | 4.1 ± 0.1 | 0.92±.03 | 3.8 ± 0.2 |
| 121 DANS | 4.2 ± 0.1 | 0.90±.08 | 3.8 ± 0.4 |
| 159 DANS | 3.7 ± 0.2 | 0.92±.14 | 3.4 ± 0.7 |
| 314 DANS | 3.7 ± 0.2 | 0.93±.04 | 3.4 ± 0.3 |
| 352 DANS | 2.4 ± 0.2 | 1.6 ± 0.2 | 3.8 ± 0.8 |
| 121 NBD | 3.9 ± 0.4 | 0.94±.01 | 3.7 ± 0.4 |
| 159 NBD | 1.7 ± 0.1 | 2.0 ± 0.1 | 3.4 ± 0.4 |
| 314 NBD | 1.4 ± 0.3 | 2.4 ± 0.4 | 3.4 ± 1.3 |
| 352 NBD | 1.1 ± 0.2 | 3.7 ± 0.3 | 4.2 ± 1.1 |
Fluorescence Spectra
Emission spectra of labeled α1PIs (100–200 nm) were measured with an SLM 8000 spectrofluorometer by exciting at 292 or 330 nm and scanning from 400 to 570 nm for DANS-labeled proteins or exciting at 480 nm and scanning from 500 to 630 nm for NBD-labeled proteins. Scans were done at 5-nm intervals with 5–10-s integrations at each wavelength, employing excitation slits of 4 nm and emission slits of 16 nm. At least two scans were obtained for each measurement and averaged. Spectra of complexes were obtained by adding a molar excess of trypsin (based on the SI) from a stock in 1 mm HCl, incubating 1 min and then inhibiting excess trypsin with 10 μm Phe-Phe-Arg-chloromethyl ketone (Sigma) (<5% dilution). Titrations of labeled α1PIs with trypsin were performed by monitoring fluorescence at the peak wavelengths as a function of added trypsin. Chloromethyl ketone was added following titrations as above to inhibit excess trypsin. The spectra of RCL-cleaved α1PIs were obtained by incubating 1–2 μm α1PI with catalytic Arg-C protease (∼5 μg/ml) in 50–100 μl for 1–2 h and then diluting samples 12–24-fold. Complete cleavage was verified by SDS-PAGE analysis and confirmed by the observation that trypsin addition (1 molar eq) produced no spectral changes indicative of any residual native protein. Control samples incubated with buffer were treated identically to obtain native α1PI spectra and then reacted with 1 eq of trypsin to confirm the fluorescence changes due to α1PI-trypsin complex formation.
Rapid Kinetics
Rapid kinetic studies were performed with an Applied Photophysics SX-17MV stopped-flow instrument. Reactions of DANS-labeled α1PIs were monitored by exciting at 290 or 330 nm and following emission changes with filters that cut-on at 400 or 500 nm. NBD-labeled α1PI reactions were monitored by exciting at 480 nm and following emission changes with a 500-nm cut-on filter. Reactions were done under pseudo-first order conditions with a molar excess of trypsin or anhydrotrypsin over α1PI that was at least 5:1 and for reactions with SI > 2, at least 2.5:1. Reactions were also done with a ≥5-fold molar excess of α1PI over trypsin. For trypsin reactions, α1PIs in a 2-fold concentrated reaction buffer were mixed with trypsin in 1 mm HCl. Typically, ∼10 reaction traces were obtained for each set of concentrations and averaged. Fluorescence progress curves of reactions were corrected for buffer voltage and computer fit by two and three exponential equations using Kaleidagraph software. FRET changes of DANS-labeled α1PIs additionally required correction for protein fluorescence when emission was monitored with the 400-nm cut-on filter. Fluorescence progress curves for reactions done with a series of concentrations were globally fit with Kintech Explorer version 3.0 software. Wild-type unlabeled α1PI reactions with trypsin were also studied by including a fluorogenic reporter substrate in the inhibitor solution (50 μm FPR-7-amido-4-methylcoumarin) and monitoring the exponential decrease in rate of substrate hydrolysis. Progress curves were fit by an exponential plus linear equation to obtain kobs.
Calcium Effects on 121 NBD α1PI-Trypsin Complex
The kinetics of calcium binding to the 121 NBD α1PI-trypsin complex were studied as a function of calcium concentration under pseudo-first order conditions by monitoring the enhancement in NBD fluorescence accompanying binding. Complex was formed by mixing 120 nm α1PI with 80 nm trypsin, reacting for 1 min, and then adding 10 μm FFR-chloromethyl ketone. Complex was then mixed with a large molar excess of calcium in the range from 0.1 to 15 mm. NBD fluorescence changes were well fit by single exponentials to yield ΔFobs/Fo and kobs. The dependence of kobs on calcium concentration was fit by the equations for the model of Scheme 2 (21),
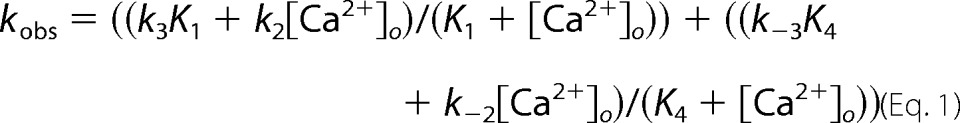 |
where KD is the observed equilibrium dissociation constant for calcium binding to the complex. KD was fixed at the measured value and the remaining kinetic parameters were fit.
SCHEME 2.
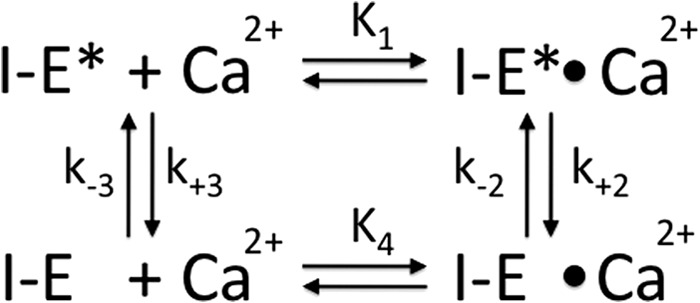
Scheme for calcium binding to inactive (I − E*) and low activity (I − E) states of the α1PI-trypsin complex.
Complex Dissociation Kinetics
Rate constants for the first order dissociation of α1PI-trypsin complexes in the absence and presence of 1.5 mm calcium were measured similar to past studies (11). Labeled α1PIs were reacted with 1 molar eq of trypsin (based on measured SIs) in the absence of calcium for 1–5 min and then calcium or buffer was added. Aliquots were removed after various times up to 2–4 h and diluted into 100 μm chromogenic substrate to measure residual trypsin activity. Progress curves of the increase in trypsin activity were fit by a single exponential function for all complexes in the presence of calcium and for P7-labeled α1PI-trypsin complexes also in the absence of calcium. For the remaining complexes in the absence of calcium, only the initial linear rate of trypsin dissociation was measured. End points obtained from faster reactions were used to calculate dissociation rate constants. Alternatively, complex was diluted several hundred-fold into 400 μm chromogenic substrate and the initial rate of complex dissociation continuously measured from the accelerating parabolic increase in rate of substrate hydrolysis as described (11). For reactions with kdiss >10−3 s−1, complete complex dissociation was monitored from the exponential increase in the velocity of substrate hydrolysis to an end point corresponding to the control protease velocity.
RESULTS
Fluorescence Changes Induced in Labeled α1PIs by Trypsin Complexation or RCL Cleavage
α1PI-Pittsburgh (P1 Met → Arg) variants with engineered single cysteines at position 352 in the reactive center loop (P7 residue), at positions 121 and 314 at the end of sheet A most distal from the reactive loop, and at position 159 on the outer face of helix F midway between the reactive loop and distal end of sheet A, were labeled with DANS and NBD fluorophores to provide site-specific probes of the large scale movement of protease that accompanies the inhibitory reaction of α1PI with trypsin to form a conformationally trapped acyl-intermediate complex (Fig. 1). The stoichiometric labeling and spectral properties of the variants, as well as the fluorescence perturbation and FRET changes resulting from the formation of an initial noncovalent Michaelis complex with anhydrotrypsin and a final covalent complex with trypsin were similar to what has previously been reported for a subset of these variants (4, 16) (Table 2, Figs. 2 and 3) and in accord with the structures of α1PI-trypsin noncovalent and covalent complexes previously determined by FRET mapping, NMR spectroscopy, and x-ray crystallography (4, 5, 7, 8, 22). These structures show the protease docked to the reactive loop of native α1PI in the initial Michaelis complex in proximity to the P7 residue, but translocated to the opposite pole of the serpin in close proximity to positions 121 and 314 in the final trapped acyl-intermediate complex as a result of the cleaved RCL inserting into sheet A and dragging the attached protease along (Fig. 1). The fluorescence spectral changes ascribable to the common serpin conformational change induced by trypsin complex formation and RCL cleavage, as determined by Arg-C protease cleavage at the P1 Arg reactive bond of the variants, were also similar to previously reported changes resulting from papain cleavage (4, 16), despite the different reactive loop sites of these cleavages (Table 2, Figs. 2 and 3). Notably, the DANS FRET and direct perturbation changes accompanying reaction with trypsin showed large blue spectra shifts and enhancements that differed markedly from the changes induced by Arg-C protease cleavage, consistent with previous studies showing that DANS fluorophores report the large scale movement of the protease to the distal end of sheet A following the major serpin conformational change in which the RCL inserts into sheet A (4). By contrast, the NBD fluorescence changes resembled the changes induced by Arg-C protease cleavage, suggesting that they were dominated by the serpin conformational change. Titrations of all labeled α1PIs with trypsin showed that the fluorescence perturbation and FRET enhancements increased linearly with increasing trypsin concentration to reach end points that agreed with the stoichiometries of inhibition measured by titrations of the loss in trypsin activity (not shown).
FIGURE 1.
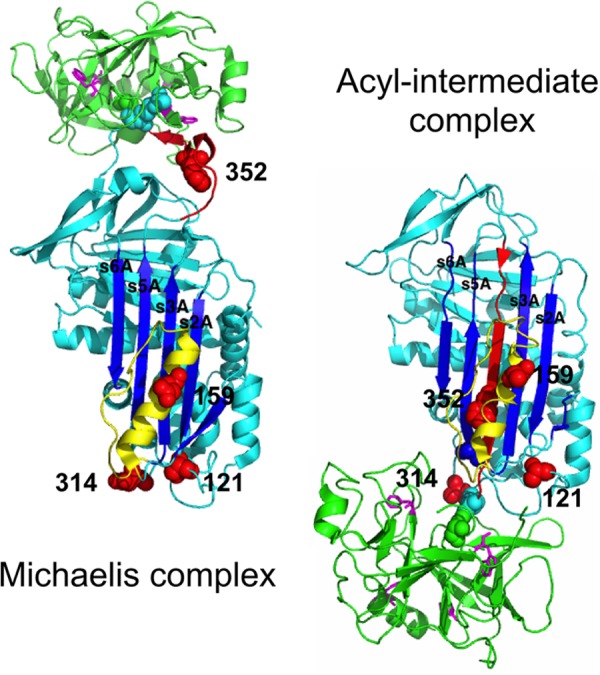
Structures of noncovalent and covalent α1PI-protease complexes depicting sites of fluorophore labeling. α1PI-S195A trypsin noncovalent complex (PDB 1OPH) and α1PI-elastase covalent complex (PDB 2D26) structures are shown in ribbon with the serpin in cyan and protease in green. The α1PI-elastase complex is shown because one of the protease domains is not visible in the otherwise identical structure of the α1PI-trypsin covalent complex (PDB 1EZX). The RCL and four sites of fluorophore labeling on α1PI are colored red with the latter depicted in space filling. Helix F and its C-terminal loop are in yellow. The catalytic Ser-195 of trypsin and α1PI P1 residue are shown in space filling. The homologs of the four Trp residues of trypsin in elastase are shown in magenta stick. Strands 2A to 6A of β-sheet A are labeled.
TABLE 2.
Fluorescence properties of site-specific fluorescent-labeled α1PI variants in native, trypsin complexed and cleaved states
Fluorescence spectra of native α1PIs and their trypsin-complexed and cleaved forms are shown in Figs. 2 and 3. Wavelength maxima were determined by taking the derivative of the spectrum and interpolating by linear regression the intersection of the derivative with the x axis. Errors represent the range of values from at least two independent experiments. The fluorescence of trypsin-complexed and cleaved forms at λmax is expressed relative to that of native α1PI at λmax.
| α1PI | λex | λmax.native | λmax,complex | Fcomplex/Fnative | λmax,cleaved | Fcleaved/Fnative |
|---|---|---|---|---|---|---|
| 121 DANS | 292 | 489 ± 3 | 478 ± 1 | 6.4 ± 0.2 | 492 ± 2 | 0.86 ± 0.12 |
| 159 DANS | 292 | 487 ± 2 | 490 ± 2 | 1.49 ± 0.04 | 488 ± 1 | 1.26 ± 0.05 |
| 314 DANS | 292 | 488 ± 3 | 465 ± 1 | 17 ± 1 | 495 ± 5 | 0.80 ± 0.03 |
| 352 DANSa | 292 | 485 ± 1 | 484 ± 1 | 1.17 ± 0.05 | 488 ± 1 | 0.36 ± 0.01 |
| 121 DANS | 330 | 490 ± 1 | 482 ± 1 | 1.21 ± 0.04 | 491 ± 1 | 0.98 ± 0.01 |
| 159 DANS | 330 | 490 ± 1 | 494 ± 1 | 0.88 ± 0.02 | 493 ± 1 | 0.89 ± 0.03 |
| 314 DANS | 330 | 492 ± 2 | 470 ± 1 | 1.76 ± 0.20 | 497 ± 1 | 0.84 ± 0.01 |
| 352 DANS | 330 | 487 ± 1 | 486 ± 1 | 1.20 ± 0.07 | 488 ± 1 | 1.22 ± 0.01 |
| 121 NBD | 480 | 540 ± 1 | 538 ± 1 | 1.59 ± 0.03 | 541 ± 1 | 1.48 ± 0.01 |
| 159 NBD | 480 | 542 ± 2 | 544 ± 1 | 0.96 ± 0.02 | 544 ± 1 | 1.09 ± 0.03 |
| 314 NBD | 480 | 554 ± 1 | 545 ± 2 | 0.38 ± 0.02 | 547 ± 2 | 0.44 ± 0.01 |
| 352 NBD | 480 | 544 ± 1 | 530 ± 1 | 3.57 ± 0.16 | 530 ± 1 | 3.6 ± 0.2 |
a The relative fluorescence of the covalent complex reflects a correction of the observed fluorescence for the contribution of ∼1/3 cleaved inhibitor based on the measured SI.
FIGURE 2.

FRET changes of DANS-labeled α1PIs upon complexation with trypsin or RCL cleavage. Shown are emission spectra obtained by excitation of tryptophan at 292 nm of native α1PIs labeled with DANS at the indicated positions before (solid line) and after stoichiometric reaction with trypsin (dashed line) or catalytic reaction with the Arg-C protease (dotted-dashed line). FRET between trypsin tryptophan residues and α1PI DANS labels is evident from the difference between trypsin complexed and cleaved inhibitor spectra. Additional details are provided under “Experimental Procedures”.
FIGURE 3.

Fluorescence changes of NBD-labeled α1PIs upon complexation with trypsin or RCL cleavage. Fluorescence changes of NBD at the indicated positions of α1PI were assessed by excitation at 480 nm and recording emission spectra before (solid line) and after stoichiometric reaction with trypsin (dashed line) or catalytic reaction with the Arg-C protease (dotted-dashed line). The fluorescence enhancement produced by adding 5 mm CaCl2 to the α1PI-trypsin covalent complex is shown for the 121 NBD-labeled α1PI (dotted line). See “Experimental Procedures” for additional details.
Equilibrium and Kinetic Characterization of Michaelis Complex Interactions
The responsiveness of P7 NBD- and P7 DANS-labeled α1PIs to Michaelis complex formation with anhydrotrypsin allowed characterization of the binding and kinetics of this interaction (Fig. 4). Titrations of the FRET and fluorescence perturbation enhancements of the P7-labeled α1PIs with anhydrotrypsin showed saturable changes, consistent with equilibrium formation of the Michaelis complex. Fitting of these titrations by the equilibrium binding equation indicated similar high affinity KD values of ∼1 nm for complex formation, in agreement with previous findings (23). The kinetics of the fluorescence enhancements accompanying the binding of anhydrotrypsin to P7-labeled α1PIs were monophasic exponentials with observed pseudo-first order rate constants that increased linearly with anhydrotrypsin concentration, consistent with a simple bimolecular docking interaction. The slope of plots of kobs versus anhydrotrypsin concentration for formation of the Michaelis complexes provided kon values of 1.3–2.0 μm−1 s−1. The intercepts of these plots were indistinguishable from 0, in accordance with predicted koff values of <0.01 s−1 based on the measured equilibium KD.
FIGURE 4.
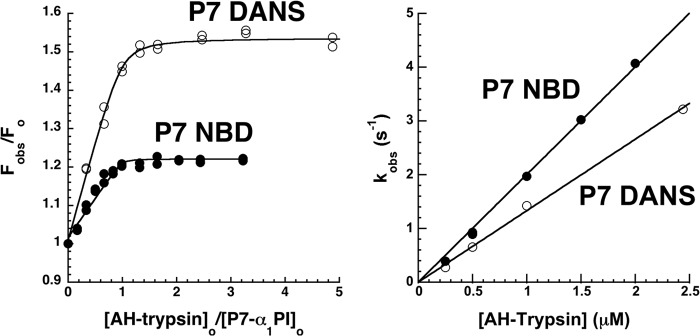
Equilibrium and kinetics of α1PI-anhydrotrypsin Michaelis complex formation. Left panel, equilibrium binding titrations of P7-labeled α1PIs with anhydrotrypsin monitored by FRET and proximity perturbation enhancements of DANS and NBD fluorescence as described under “Experimental Procedures.” Solid lines are computer fits of data by the quadratic equilibrium binding equation. Right panel, dependence of kobs for anhydrotrypsin binding to P7-labeled α1PIs on anhydrotrypsin concentration. kobs was measured by monitoring the time-dependent FRET and proximity perturbation enhancements of DANS and NBD fluorescence by stopped-flow fluorimetry and fitting progress curves with an exponential function as described under “Experimental Procedures.” Solid lines are linear regression fits assuming a zero intercept.
Kinetics of the Unlabeled α1PI-Trypsin Reaction
To relate the kinetics of the fluorescence changes accompanying the labeled α1PI-trypsin reactions to the kinetics of trypsin inhibition, the kinetics of the unlabeled α1PI-Pittsburgh-trypsin reaction was studied. The loss of trypsin activity was monitored by stopped-flow fluorescence with a reporter fluorogenic substrate under pseudo-first order conditions as a function of the inhibitor concentration. Progress curves were simple exponentials in all cases, consistent with the signal reporting the disappearance of active protease as it forms a covalent complex with α1PI. The dependence of kobs on the “effective” α1PI concentration, i.e. corrected for competition by the substrate, was hyperbolic consistent with a two-step reaction involving the steady-state formation of an initial docking complex followed by acylation and conformational change steps leading to the final trapped complex (Fig. 5). Values for Km of 13 ± 1 μm, klim of 54 ± 4 s−1, and kass = klim/Km of 4.1 ± 0.6 μm−1 s−1 were determined from this dependence. The observation of a Km several orders of magnitude greater than the equilibrium KD for Michaels complex formation (∼1 nm) and klim much greater than the koff for dissociation of the Michaelis complex (<0.01 s−1) indicated that the Michaelis complex is transformed to the acyl-intermediate complex much faster than it can dissociate. As a result, Km = (koff + klim)/kon ≈ klim/kon and klim/Km ≈ kon. kass is thus limited by the rate of diffusional encounter of serpin and protease to form the Michaelis complex (9).
FIGURE 5.
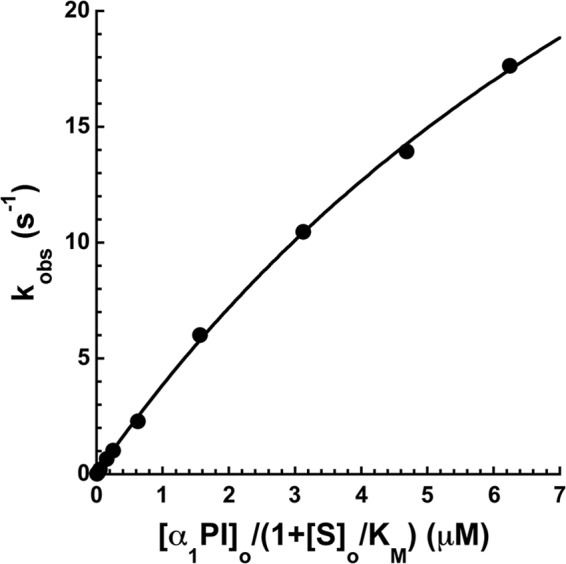
Kinetics of unlabeled α1PI-Pittsburgh reactions with trypsin. Graph of the dependence of kobs for reaction of α1PI-Pittsburgh with trypsin as a function of the effective α1PI concentration, i.e. corrected for the competitive effect of the trypsin substrate. kobs was measured by monitoring the exponential decrease in the rate of trypsin cleavage of a fluorescent substrate by stopped-flow fluorimetry as described under “Experimental Procedures.” Solid lines are fits of data by the hyperbolic equation for saturation kinetics.
Kinetics of DANS α1PI-Trypsin Reactions
To characterize the intermediate steps involved in transforming the initial Michaelis docking complex to the final trapped acyl-intermediate complex, we first investigated the kinetics of the FRET and proximity perturbation fluorescence changes accompanying DANS-labeled α1PI-trypsin reactions that report protease movements in this transformation (Fig. 6). The kinetics of FRET changes accompanying the reaction of P7 DANS-α1PI (residue 352 labeled) with trypsin were first examined because they report formation of the Michaelis complex as well as its subsequent transformation to the covalent complex. The kinetics were multiphasic. An initial rapid increase in FRET within the first 50 ms was followed by a decrease over the next 1 s and then a slower increase that was complete in about 10 s. Progress curves measured as a function of the trypsin concentration were well fit by two exponentials following the first 50 ms. kobs for the fast phase FRET decrease increased linearly with trypsin concentration, whereas the slow phase FRET increase was independent of trypsin concentration. The <5% rapid FRET enhancement in the initial 50 ms was significantly smaller than the ∼50% FRET increase induced by anhydrotrypsin (Fig. 6), consistent with this change reporting the transient formation of a Michaelis complex that did not accumulate significantly because of its rapid transformation to the trapped acyl-intermediate complex. The subsequent FRET quenching and enhancement phases reporting covalent complex formation suggested that reactive loop insertion and protease translocation first changed the separation of the P7 DANS fluorophore and the protease from that in the Michaelis complex and then protease conformational changes that trap the acyl-intermediate complex caused the protease to move closer to the P7 residue.
FIGURE 6.

Rapid kinetics of DANS-labeled α1PI-trypsin reactions. Kinetics of FRET changes in DANS-labeled α1PIs accompanying reactions of 50–100 nm α1PI with 0. 25, 0.5, 1, and 2 μm trypsin (progress curves depicted by circles in the order of increasing rate, not every data point shown) were measured by exciting at 290 nm and observing changes in relative DANS fluorescence emission (Fobs/Fo > 400 nm) over split time frames (left and middle panels). Solid lines are global Kintech fits of data by the reaction model of Scheme 1. The middle panel also shows the absence of FRET changes accompanying the reaction of 50 nm 121 and 314 DANS-α1PIs with 0.5 μm anhydrotrypsin but single exponential FRET enhancement accompanying the reaction of 100 nm 352 DANS-α1PI with 1 μm anhydrotrypsin. The rightmost panel shows the dependence of kobs on trypsin concentration for fast (solid circles) and slow (open circles) kinetic phases derived from fits of progress curves from these and other experiments by a two exponential function. Solid lines are linear or hyperbolic regression fits assuming a zero intercept. Dashed lines represent the average of slow phase kobs values.
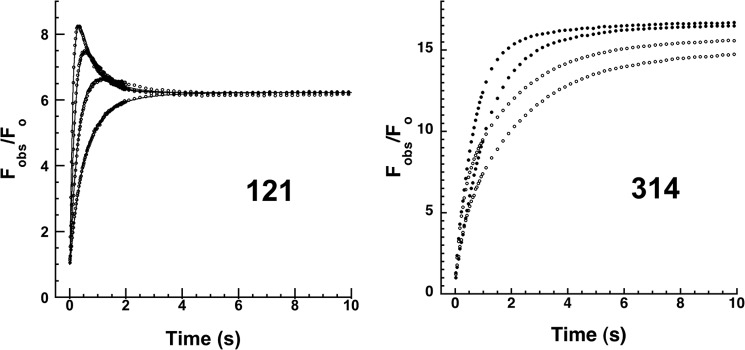
We next examined the kinetics of the FRET changes accompanying the reactions of 121 DANS and 314 DANS α1PIs with trypsin that report the arrival of the protease at the distal end of sheet A in forming the covalent complex. The kinetics showed similar multiphasic reactions that paralleled those of P7 DANS α1PI (Fig. 6). Notably, the large increases in FRET for both labeled α1PIs reactions occurred in two phases. For 121 DANS α1PI, an initial exponential increase in FRET of ∼13-fold with a kobs that increased in proportion to the trypsin concentration was followed by a slower decrease of the initial FRET enhancement to ∼9-fold in an exponential phase that was independent of trypsin concentration. Close examination of the initial 50 ms of the reaction revealed brief lags prior to the initial FRET increase. For 314 DANS α1PI, increases in FRET were clearly biphasic at trypsin concentrations ≥1 μm. Fitting of the kinetic data by two exponentials resolved an initial fast trypsin concentration-dependent FRET increase of ∼11-fold from a slower additional FRET increase to yield an overall ∼17-fold increase that was independent of trypsin concentration. Again, a brief lag was apparent in the first 50 ms of the reaction. Similar multiphasic kinetics were observed when DANS fluorescence changes reflecting proximity perturbation by trypsin were monitored by direct DANS excitation at 330 nm (not shown). 121 DANS α1PI thus showed a rapid phase fluorescence increase followed by a slow phase fluorescence decrease, whereas 314 DANS α1PI exhibited fast and slow phase increases in fluorescence. For both reactions kobs for the fast phase was proportional to the trypsin concentration, whereas kobs for the slow phase was independent of trypsin concentration.
Such findings suggested that the Michaelis complex was formed and underwent acylation in the initial 50-ms lag phase of 121 and 314 DANS α1PI reactions prior to the FRET enhancements that signaled the arrival of the protease at the distal end of sheet A. As observed in the P7 DANS reaction, the biphasic FRET changes indicated that protease translocation and trapping of the acyl-intermediate involved two conformational changes wherein the protease was first translocated to a position that was closer to residue 121 than residue 314 and then moved away from residue 121 and closer to residue 314. Comparison of the fluorescence of intermediate and final complexes relative to the initial α1PI fluorescence with emission filters that allowed the full DANS emission spectrum (>400 nm) versus only the red end of the spectrum to be observed (>500 nm) showed that the intermediate complex fluoresced in the red region significantly less than the final complex for the 121 DANS fluorophore (56 ± 5% versus 66 ± 6%), i.e. the intermediate was bluer emitting than the final complex. In contrast, the intermediate complex fluoresced much more than the final complex in the red region for the 314 DANS fluorophore (96 ± 4 versus 67 ± 2%), i.e. the intermediate was redder emitting than the final complex. This confirmed a greater proximity perturbation of the 121 fluorophore by protease in the intermediate complex than in the final complex but lesser proximity perturbation of the 314 fluorophore in the intermediate complex than in the final complex.
FRET changes in helix F residue 159 were also apparent in the reaction with trypsin. A 30% increase in FRET was observed in a monophasic reaction with an exponential rate constant that increased in proportion to the trypsin concentration (Fig. 7). Residue 159 thus approaches closer to the protease following its translocation to the bottom of sheet A but does not sense the subsequent slow protease conformational transition.
FIGURE 7.

Rapid kinetics of residue 159-labeled α1PI-trypsin reactions. Left panels, kinetics of relative FRET changes in 159 DANS-α1PI and relative fluorescence changes in 159 NBD-α1PI (Fobs/Fo) accompanying reactions of 50–100 nm α1PI with 0. 25, 0.5, 1, and 2 μm trypsin (progress curves depicted by circles or jagged lines in the order of increasing rate). Solid smooth lines are fits by a single exponential function with a linear decreasing end point for the 159 NBD-α1PI reactions. Right panels show the dependence of kobs on trypsin concentration for the observable exponential phase of progress curves. Solid lines are linear regression fits assuming a zero intercept.
Importantly, the multiphasic fluorescence changes observed in the reactions of the DANS-labeled α1PIs with trypsin occurred whether trypsin or α1PI components were in molar excess over the other component, indicating that trypsin proteolysis of the complex by excess free trypsin was not responsible for the changes (5). For all α1PIs, the initial lags and trypsin concentration-dependent fast phase fluorescence changes were consistent with a rate-limiting formation of the Michaelis complex followed by more rapid acylation and conformational change steps leading to an intermediate complex in which protease translocation has occurred. The fluorophore sensors at positions P7, 121, and 314 all suggested that the final steps in trapping the acyl-intermediate complex involved a slow conformational change following the arrival of the protease at the distal end of sheet A (Scheme 1). Computer fits of the time-dependent fluorescence changes for the different labeled α1PI-trypsin reactions were satisfactorily fit by such a reaction model (Fig. 6 and Table 3). Such fits confirmed a rate-limiting formation and rapid acylation of the Michaelis complex in the first 50 ms, with rate constants in agreement with measured values of kass, Km, and klim for the unlabeled α1PI-trypsin reaction (Table 1 and Fig. 5). These steps together limited a much more rapid reactive loop insertion and protease translocation in the first stage of trapping the acyl-intermediate. The fits indicated rate constants for the slow protease conformational changes in the second stage of trapping of 0.4–2 s−1, the variation in these rates presumably reflecting effects of the labels.
SCHEME 1.
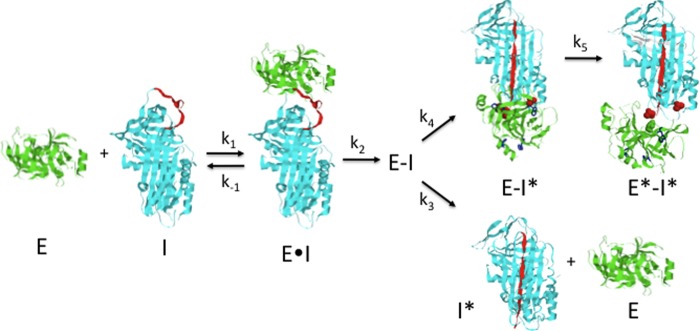
Scheme depicting the branched pathway mechanism used to fit kinetic data for labeled α1PI-trypsin reactions. The serpin (I, cyan) and protease (E, green) first combine to form the Michaelis complex (E·I). This complex undergoes acylation (E−I), causing the cleaved RCL (red) to insert into sheet A and translocate the protease to a position close to residue 121 at the s2A terminus with incomplete distortion (E − I*). This is followed by movement of the protease toward residue 314 in the s5A-s6A loop and full distortion of the protease (E* − I*). A fraction of the acyl-enzyme complex deacylates before translocation is complete, releasing cleaved serpin and free protease. α1PI residues 121 and 314 are in red space-filling, trypsin Ser-195 in green space filling, and the 4 trypsin Trp residues are in blue sticks.
TABLE 3.
Kinetic parameters for fluorescent-labeled α1PI reactions with trypsin
Kinetic constants and relative fluorescence of intermediate (FAI/Fo) and final trapped acyl-enzyme (FA2/Fo) complexes were obtained by global fitting of progress curves of Figs. 6 and 8 to the reaction model of Scheme 1 using Kintech software. Average values ± S.E. or the range from fits of two to five experiments, each of which represent progress curves with 2–6 trypsin concentrations are provided. The kinetic constants, k−1 and k4 were fixed at values of 0.005 s−1 and 1000 s−1, respectively, based on the equilibrium KD measured for the Michaelis complex interaction and the assumption that acylation (k2) was rate-limiting for the serpin conformational change step (k4). The k3 step reflecting the substrate pathway was not included in the model for reactions with SI of 1, but was fixed at values of 500 s−1 for 352 DANS, 1000 s−1 for 314, and 3000 s−1 for 352 NBD reactions to account for measured SIs.
| α1PI | k1 | k2 | k5 | FAI/Fo | FA2/Fo |
|---|---|---|---|---|---|
| 121 DANS | 4.5 ± 0.1 | 44 ± 6 | 0.51 ± 0.02 | 16 ± 1 | 9.2 ± 1 |
| 121 DANSa + Ca2+ | 4.5 ± 0.1 | 52 ± 2 | 2.0 ± 0.1 | 10.1 ± 0.1 | 6.2 ± 0.1 |
| 159 DANSb | 3.7 ± 0.1 | 1.30 ± 0.01 | 1.30 ± 0.01 | ||
| 314 DANS | 4.1 ± 0.1 | 90 ± 30 | 1.8 ± 0.1 | 11 ± 1 | 17 ± 1 |
| 352 DANSc | 3.6 ± 0.2 | 35 ± 3 | 0.31 ± 0.03 | 1.02 ± 0.02 | 1.24 ± 0.02 |
| 121 NBDd | 3.5 ± 0.3 | 30 ± 6 | 1.1 ± 0.2 | 1.41 ± 0.02 | 1.68 ± 0.17 |
| 159 NBDb | 3.8 ± 0.1 | 1.07 ± 0.01 | 1.07 | ||
| 314 NBD | 4.7 ± 0.3 | 54 ± 11 | 0.07 ± 0.02 | 0.44 ± 0.02 | 0.33 ± 0.02 |
| 352 NBDe | 5.8 ± 0.4 | 50 ± 14 | 0.14 ± 0.02 | 6.3 ± 1.1 | 2.5 ± 0.4 |
a Global fit of the experiment of Fig. 11.
b Kinetic parameters obtained from fitting the fast phase of progress curves. The absence of a slow phase implied similar relative fluorescence for intermediate and final complexes.
c The relative fluorescence of intermediate and final complexes reflects a correction for the 1/3 cleaved serpin product based on the observed SI. Because of the reduced fluorescence of cleaved compared to native serpin (Table 2), the corrected fluorescence values represent FRET enhancements of 2.6- and 3.1-fold, respectively.
d Fitting of the rapid kinetic phase assumed that the acylation step prior to the first serpin conformational change was associated with a fluorescence change. Indistinguishable fits were obtained by allowing an additional step in the fast phase.
e Small amounts of inactive latent serpin contributed to smaller overall fluorescence enhancements in some preparations.
Kinetics of NBD α1PI-trypsin Reactions
The kinetics of the fluorescence changes accompanying the reactions of NBD-labeled α1PIs with trypsin that report conformational changes in the serpin bore similarities to the reactions of the DANS-labeled α1PIs (Fig. 8). Reactions of P7 NBD-α1PI with trypsin thus resembled P7 DANS- α1PI-trypsin reactions in showing multiphasic kinetics. An initial lag in the first 50 ms was followed by a large exponential rise in fluorescence with a rate constant that increased in proportion to the trypsin concentration. Subsequently, a slower quenching of ∼⅓ of the fast phase fluorescence enhancement was observed that was independent of trypsin concentration. The reaction of P7 DANS α1PI with trypsin monitored by direct excitation of DANS similarly showed fast and slow phase fluorescence changes (both enhancements) that reflected changes in the serpin in the vicinity of the P7 flurophore (not shown). These observations suggested that following Michaelis complex formation and acylation in the lag phase, the fast phase fluorescence enhancement reports the burial of the P7 fluorophore beneath helix F as the cleaved reactive loop is inserted into sheet A and the slow phase reports alterations in the P7 fluorophore environment in the second protease conformational change step.
FIGURE 8.

Rapid kinetics of NBD-labeled α1PI-trypsin reactions. Kinetics of relative fluorescence changes in NBD-labeled α1PIs (Fobs/Fo) accompanying reactions of 50–100 nm α1PI with 0. 25, 0.5, 1, and 2 μm trypsin (progress curves depicted by circles in the order of increasing rate, not every data point shown) over split time frames (left and middle panels). Only 0.5, 1, and 2 μm trypsin concentrations are shown for the 314 NBD-α1PI reaction. Solid lines are global Kintech fits of data by the reaction model of Scheme 1. The rightmost panel shows the dependence of kobs on trypsin concentration for fast (solid circles) and slow (open circles) kinetic phases derived from fits of the left panel and other progress curves by a two-exponential function. Solid lines are linear regression fits assuming a zero intercept. Dashed lines represent the average of slow phase kobs values.
The kinetics of fluorescence changes accompanying the reaction of 121 NBD α1PI with trypsin were similarly multiphasic with a rapid increase in fluorescence that depended on trypsin concentration followed by a slow additional fluorescence increase that was independent of trypsin concentration (Fig. 8). However, the fast phase was complete within the initial 100-ms time frame where lags were typically observed and the fast and slow phases were not well fit by two successive exponential processes. Progress curves could be fit by the reaction model only if acylation and reactive loop insertion events were assumed to be reported by two successive fluorescence changes in an initial rapid phase and that a third fluorescence change in a subsequent slow phase reported additional serpin and protease conformational changes. By contrast, 314 NBD α1PI behaved similarly to other labeled α1PIs in showing biexponential fluorescence changes after a brief lag phase. This consisted of a major rapid quenching phase that was trypsin concentration dependent, followed by a slow minor additional quenching phase that was independent of trypsin concentration. These findings suggested that both 121 and 314 NBD fluorophores underwent large fluorescence perturbations as a result of the serpin RCL conformational change, and that both additionally sensed the subsequent slow conformational transition of the complex.
159 NBD α1PI showed biphasic changes in fluorescence upon reaction with trypsin (Fig. 7). However, a rapid exponential fluorescence increase of ∼7% with kobs that increased in proportion to the trypsin concentration was followed by a slow linear fluorescence decrease whose slope also increased in proportion to the trypsin concentration. The trypsin concentration dependence of the decreasing fluorescence phase together with the disappearance of this phase when reactions were performed with α1PI in molar excess over trypsin suggested that it reflected proteolysis of complexed trypsin by excess free trypsin rather than a slow conformational transition (5). This was in keeping with the observation that the 159 DANS fluorophore sensed only the rapid serpin conformational change and was insensitive to the slow phase protease conformational transition. The rapid phase fluorescence enhancement corresponded closely to the enhancement induced by Arg-C protease cleavage (Table 2 and Fig. 2), consistent with this change arising from the serpin conformational change. The subsequent slow fluorescence quenching accounted for the inability to detect this change in the emission spectrum.
Again, the multiphasic fluorescence changes observed in the reactions of P7, 121, and 314 NBD α1PIs with trypsin were observed whether trypsin or α1PI components were in molar excess over the other component, indicating that trypsin proteolysis of the complex was not responsible for these changes. Slow trypsin concentration-dependent decreases in fluorescence ascribable to proteolysis with estimated kcat/Km values from 0.003 to 0.01 μm−1 s−1 was observed in the 159 NBD α1PI-trypsin reaction as well as in 159 DANS, 121 NBD, 314 NBD, and 314 DANS α1PI reactions monitored over 100 s. However, such decreases minimally affected the fast and slow kinetic phases over the times required to complete reactions as judged from the independence of the total fluorescence changes on trypsin concentration over the 0.25–2 μm range studied and the excellent fits of kinetic data by the model of Scheme 1. The fits confirmed a rate-limiting formation and rapid acylation of the Michaelis complex in the 50-ms lag phase in agreement with inhibition kinetics (Table 1 and Fig. 5) that together limited a much faster reactive loop insertion and protease translocation in the fast phase. Subsequent serpin and protease conformational changes occurred in the slow phase with rate constants ranging from ∼0.1 to 1 s−1, the variation again presumably reflecting effects of the label or possibly distinct serpin and protease conformational change steps.
Calcium Effects on α1PI-trypsin Reactions
Calcium ions were previously shown to destabilize the trapped acyl-intermediate complex and accelerate its deacylation by inducing conformational changes in the α1PI-trypsin complex that partially restored trypsin catalytic function (11). All labeled α1PI complexes with trypsin were found to have their dissociation rate enhanced 10–40-fold by calcium ions (Table 4). Unexpectedly, P7-labeled α1PI-trypsin complexes showed enhanced dissociation kinetics even in the absence of calcium, with calcium further augmenting the rate of complex dissociation (Fig. 9). The P7 labels thus indirectly perturb complex stability.
TABLE 4.
Dissociation rate constants for α1PI-trypsin complexes
Dissociation rate constants (kdiss) were measured by monitoring the recovery of trypsin activity in continuous or discontinuous assays as described under “Experimental Procedures.”
| α1PI |
kdiss |
|
|---|---|---|
| −Ca2+ | +Ca2+ | |
| s−1 | ||
| Wild-type | 1.4 ± 0.1 × 10⁻⁵ | 3.9 ± 0.1 × 10⁻⁴ |
| 121 DANS | 1.0 ± 0.1 × 10⁻⁵ | 4.0 ± 0.1 × 10⁻⁴ |
| 159 DANS | 0.9 ± 0.3 × 10⁻⁵ | 4.0 ± 0.2 × 10⁻⁴ |
| 314 DANS | 2.1 ± 0.2 × 10⁻⁵ | 6.2 ± 1.0 × 10⁻⁴ |
| 352 DANS | 2.7 ± 0.5 × 10⁻⁴ | 6.7 ± 0.1 × 10⁻³ |
| 121 NBD | 0.6 ± 0.1 × 10⁻⁵ | 4.5 ± 0.1 × 10⁻⁵ |
| 159 NBD | 0.4 ± 0.1 × 10⁻⁵ | 4.5 ± 0.5 × 10⁻⁴ |
| 314 NBD | 1.4 ± 0.1 × 10⁻⁵ | 2.2 ± 0.1 × 10⁻⁴ |
| 352 NBD | 8.8 ± 1.0 × 10⁻⁴ | 1.3 ± 0.2 × 10⁻² |
FIGURE 9.
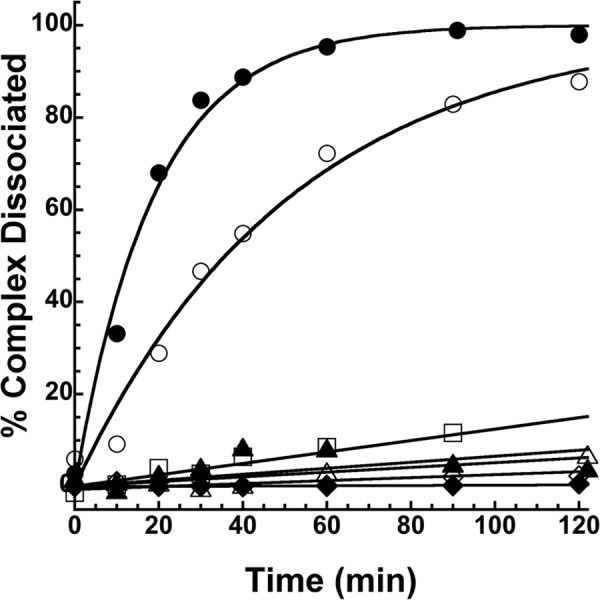
Kinetics of dissociation of labeled α1PI-trypsin complexes. Progress curves of the α1PI-trypsin complex dissociation monitored from the recovery of trypsin activity for complexes of DANS-labeled α1PIs (open symbols) and NBD-labeled α1PIs (closed symbols) labeled at residues 121 (triangles), 159 (diamonds), 314 (squares), and 352 (circles). Solid lines are computer fits of data by linear (121-, 159-, and 314-labeled α1PIs) or single exponential functions (352-labeled α1PIs).
Interestingly, the 121 NBD-labeled α1PI-trypsin complex underwent a significant fluorescence enhancement of ∼30% and 2-nm blue shift upon addition of calcium (Fig. 3), in contrast to the 314 NBD α1PI-trypsin complex whose fluorescence was unaffected by calcium (not shown). Calcium had no effect on Arg-C protease cleaved 121 NBD α1PI (not shown), indicating that the change induced in the trypsin complex resulted from proximity perturbation by the complexed protease. That the NBD fluorescence enhancement induced in the 121 NBD α1PI-trypsin complex in the absence of calcium also reflected in part proximity perturbation by the protease was suggested by the blue-shift of the emission spectrum upon protease complexation but red-shift upon Arg-C protease cleavage (Table 2 and Fig. 3). Addition of the calcium chelator, EDTA, reversed the calcium-induced fluorescence enhancement. Titration of the fluorescence enhancement showed a saturable change reflecting a KD of 380 ± 90 μm (Fig. 10) that was similar to the KD previously measured based on the calcium concentration dependence of the increase in rate of complex dissociation, shown to report calcium binding to a high-affinity site in trypsin (11). The change thus appeared to report proximity perturbation of the environment of the 121 NBD fluorophore as a result of conformational changes in trypsin induced by calcium binding.
FIGURE 10.

Equilibrium and kinetics of calcium binding to 121 NBD-α1PI-trypsin complex. A, progress curves of NBD fluorescence changes (dots) accompanying reactions of the 121 NBD-α1PI-trypsin complex with the indicated calcium concentrations monitored in the stopped-flow fluorometer. Solid lines are fits of data by a single exponential function; B, dependence of relative fluorescence changes (ΔFobs/ΔFmax) observed in kinetic (closed circles) and equilibrium (open circles) titrations of 121 NBD-α1PI-trypsin complex interactions with calcium on calcium concentration. Fluorescence changes in kinetic titrations were obtained from fits of panel A and other progress curves and those in equilibrium titrations were obtained by monitoring fluorescence in the SLM fluorometer. The solid line is a fit of kinetic data by the quadratic equilibrium binding equation; C, dependence of kobs for reactions of 121 NBD-α1PI-trypsin complex with calcium on calcium concentration (closed circles). kobs values were measured from exponential fits of panel A and other progress curves. The solid line and open circles represent a computer fit of data by the reaction model of Scheme 2.
The kinetics of the calcium-induced fluorescence enhancement of the 121 NBD α1PI-trypsin complex corresponded to monophasic exponentials with amplitudes and rate constants that increased in a saturable manner with increasing calcium concentration (Fig. 10). The amplitude dependence indicated a KD for calcium binding of 330 ± 70 μm that agreed with the KD measured by equilibrium binding. The rate constant dependence suggested a two-step mechanism of calcium binding in which binding to an inactive conformational state of the complex induced a conformational change to a low activity state (11). However, the overall KD predicted from the kinetic parameters for such a model did not agree with the equilibrium KD. This necessitated consideration of the general model for a ligand-induced conformational change in which a pre-existing equilibrium between an inactive and low activity conformation of the complex was shifted in favor of the low activity state by calcium binding to either of the two conformational states (21) (Scheme 2). Assuming binding steps were in rapid equilibrium and fixing the overall equilibrium KD at the measured value of 0.3 mm, values of 6.4 ± 2.3 mm for K1, 6.3 ± 0.7 s−1 for k2, 0.2 ± 0.2 s−1 for k−2, 1.0 ± 0.6 s−1 for k3, 1.4 ± 5.6 s−1 for k−3, and 0.12 ± 0.36 mm for K4 were fit. Although the fit predicted an initial hyperbolic decrease in kobs at low calcium concentrations, the low fluorescence amplitude at these concentrations precluded the ability to detect such a decrease. Simulations confirmed a good correspondence between the fitted parameters of the model and observed kinetic and equilibrium data. According to the fit, inactive and low activity states of the complex are nearly equally populated in the absence of calcium (k−3/k3 = 1.4) but this pre-equilibrium is shifted ∼50-fold in favor of the low activity state in the presence of saturating calcium (k−2/k2 = 0.03). This shift results from calcium preferentially binding to and stabilizing the low activity state with a ∼50-fold higher affinity than the inactive state.
To assess whether calcium affected the large scale movement and conformational distortion of trypsin in forming the α1PI-trypsin complex, we examined calcium effects on the kinetics of the FRET enhancements of 121 and 314 DANS labels upon α1PI reaction with trypsin (Fig. 11). Calcium reduced the FRET changes for both fast and slow phases of the 121 DANS α1PI reaction by ∼30% and enhanced the slow phase rate. In contrast, calcium marginally affected the FRET enhancements of fast and slow phases but reduced the slow phase rate of the 314 DANS α1PI reaction. The rate of the slow phase protease conformational change thus appeared to be differentially affected by the labels.
FIGURE 11.
Calcium effects on 121 and 314 DANS-labeled α1PI-trypsin reactions. Left panel, progress curves for reactions of 50 nm 121 DANS-α1PI with 0.25, 0.5, 1, and 2 μm trypsin in the presence of 5 mm Ca2+ monitored by FRET changes (circles with curves presented in the order of increasing rate) as in Fig. 6. Solid lines are global Kintech fits of data by the reaction model of Scheme 1; right panel, kinetics of FRET changes in reactions of 50 nm trypsin with 0.25 μm 314 DANS-α1PI and 100 nm trypsin with 0.5 μm 314 DANS-α1PI (progress curves depicted by circles in order of increasing rate) in the absence (closed circles) and presence (open circles) of 5 mm Ca2+. Fobs is expressed relative to the calculated Fo for the fraction of reacted α1PI. The reaction phases are not well separated in the absence of calcium, but are in the presence.
DISCUSSION
Whereas structural studies have revealed the remarkable conformational changes involved in transforming the initial Michaelis encounter complex to the final trapped acyl-intermediate complex in serpin-protease reactions, molecular insights into the intervening stages of this transformation have been lacking. By exploiting serpins site-specifically labeled with fluorophores that were previously shown to report the progression of the initial Michaelis docking complex to the final trapped acyl-intermediate complex, we have been able to resolve events between the initial and final steps of the reaction in unprecedented detail. An important finding is that an intermediate stage in the trapping of the acyl-intermediate complex is detectable in which RCL insertion into sheet A and concomitant protease translocation to the distal end of sheet A has occurred but the protease is in a different position from that in the final complex and has not completed the conformational changes that distort and trap the protease. The greater FRET and proximity perturbation enhancement of residue 121 than 314 in the intermediate complex thus indicates that the protease arrives at the end of sheet A at a position that lies closer to residue 121 at the strand 2A terminus than residue 314 in the loop connecting strands 5A and 6A. Conversion of the intermediate complex to the final complex causes the FRET and proximity perturbation of residue 121 to decrease and that of residue 314 to increase, indicating that the protease moves away from residue 121 on the s2A side of sheet A and closer to residue 314 on the s5A/s6A side. Fluorescence changes of NBD fluorophores as well as the direct fluorescence perturbations of P7 and 159 DANS fluorophores, which report the serpin conformational changes in the reaction were consistent with the cleaved RCL having inserted into sheet A in the intermediate complex, but indicated that additional changes in the serpin sensed by resides 121 and 314 at the sheet A terminus as well as the P7 residue in the helix F-sheet A interface accompany the subsequent transformation to the final complex.
Average effective distances of the four trypsin Trp residues from α1PI DANS labels in the final complex (Reff) of 24 Å for residue 121, <14 Å for residue 314, and 35 Å for helix F residue 159 were previously calculated from observed FRET enhancements, in reasonable agreement with our present findings and the x-ray structure (Table 5). The FRET enhancements observed for the intermediate complex in the present study indicate values for Reff of 14 Å for residue 121 and 21 Å for residue 314 with Reff remaining at the value of 42 Å calculated for residue 159 in the covalent complex (Table 5). The protease thus moves ∼10 Å from the s2A side of the sheet A terminus to the s5A/s6A side in going from the intermediate to the final complex while maintaining its distance from helix F residue 159. FRET changes observed for the P7 residue in intermediate and final complexes indicate an Reff for the protease of 30 Å from this residue following its translocation to the distal end of sheet A in the intermediate complex that decreases ∼2 Å upon conversion to the final complex, consistent with the P7 residue lying closer to s5A than s2A in the x-ray structure of the final complex (Fig. 1).
TABLE 5.
FRET distances between trypsin Trp residues and α1PI DANS labels
Effective distances of the four Trp residues of trypsin from DANS groups in labeled α1PIs (Reff) were calculated from FRET enhancements in Table 3 for the intermediate acyl-enzyme complex (FA1/Fo) and the final acyl-enzyme complex (FA2/Fo), corrected for FRET changes of the cleaved inhibitor (Table 2) and quantum yield changes of DANS in the covalent complex based on fluorescence changes observed with 330 nm excitation (Table 2) as described in Ref. 4. An Ro of 22.6 Å was used for the DANS-Trp pair as determined in Ref. 4. Also shown are Reff values calculated from the x-ray structure of the α1PI-elastase complex in which the residues corresponding to the four homologous Trp are all visible.
| α1PI | Reff, A1 | Reff, A2 | Reff, A2, X-ray |
|---|---|---|---|
| 121 DANS | 14 ± 3 | 21 ± 2 | 21 |
| 159 DANSa | 42 ± 1 | 42 ± 1 | 36 |
| 314 DANS | 21 ± 1 | 17 ± 2 | 15 |
| 352 DANS | 30 ± 1 | 28 ± 1 | 28 |
a The FRET distances differ from the value of 35 Å reported previously (4) most likely because of the small difference in FRET changes between the covalent complex and cleaved inhibitor control.
A key question is whether the protease conformational changes observed in intermediate and final complexes both contribute to the conformational deformation of the protease that is evident from x-ray structures, NMR, and biochemical studies (5, 8, 11, 24, 25). This distortion involves pulling the active site Ser-195 out of its alignment with His-57 and Asp-102 of the catalytic triad, removal of the P1 residue side chain from the S1 binding pocket, and induction of a molten globule-like state of one of the protease domains. That catalytic function is significantly disabled already in the intermediate complex is suggested by our finding that the intermediate complex is stabilized sufficiently to allow it to convert to the final complex at relatively slow rates (<2 s−1) without undergoing deacylation. Deacylation rates are thus expected to greatly exceed observed rates of acylation (50 s−1) that limit the rate of formation of the intermediate complex. Evidence for two stages of protease distortion comes from previous studies in which a PAI-1 variant made fluorescently silent by mutating all Trp residues to a nonfluorescent Trp analog was observed to undergo fast and slow phase protease conformational changes in the trapping of the acyl-intermediate complex with bimolecular and unimolecular kinetics similar to what we have observed (13). The initial translocation of the protease near the s2A terminus of sheet A could partly disable protease catalytic function by displacing the P1 side chain from the S1 pocket as a result of the insertion of the backbone of proximal residues into sheet A. Such displacement would be consistent with the marked changes in protease Trp fluorescence accompanying formation of the intermediate complex, especially Trp-215 that lines this pocket. Moreover, a P1 Trp variant of α1PI was found to undergo change in fluorescence upon covalent complex formation with chymotrypsin with bimolecular kinetics, consistent with perturbation of the P1 residue in the intermediate complex (25). The subsequent movement of protease toward the s5A/s6A end of sheet A could then compress the protease against the serpin, forcing the catalytic Ser out of its active site alignment and inducing the disordered state of the protease observed in the structure of the final complex.
Of particular interest was whether we could detect changes in helix F accompanying the reaction with protease because it appears to obstruct the pathway of the protease in its translocation from one end of sheet A to the other. It has been proposed that this helix plays a critical role in the serpin conformational trapping mechanism (15). Because the energy that drives the serpin conformational change is provided by the favorable energy of folding of the metastable serpin to a more stable form through the insertion of the cleaved reactive loop into sheet A, the F helix has been proposed to be important for coupling this energy to the conformational deformation of the protease after it has arrived at the distal end of sheet A. This is thought to occur by the protease forcing the F helix out of its normal position or perturbing its structure as the protease is dragged to the opposite end of sheet A, so that part of the energy released by RCL insertion is used to move or distort the helix. Once the protease has reached the end of sheet A, the energy stored in the stressed helix is released as it returns to its resting state in a process that is coupled to deforming the protease.
Of key relevance to this proposed role for the F helix is our observation that the protease is initially translocated to the s2A side of sheet A in forming the intermediate complex. Examination of the structure of the final complex shows that for the protease to arrive on the s2A side of sheet A following RCL insertion into sheet A, helix F and its C-terminal loop that are connected to s3A must be displaced (Fig. 1). Notably, FRET and fluorescence perturbation changes of P7 NBD and DANS fluorophores sense the movement of the protease from the s2A side toward the s5A/s6A side of sheet A and indicate that alterations in the P7 residue environment beneath helix F and the C-terminal loop accompany this movement in forming the final complex. This would be consistent with movement of helix F and the C-terminal loop accompanying movement of the protease in transforming the intermediate to the final complex. The coupling of the protease conformational changes in forming the final complex with changes in the serpin helix F-sheet A interface is corroborated by the observation that the P7 fluorophore perturbs the stability of the complex as evidenced by an enhanced rate of complex dissociation. Together, these findings are thus consistent with the proposed role of helix F in driving the conformational changes that transform the intermediate to the final complex (15). A scenario can thus be envisioned in which translocation of the protease to the s2A side of sheet A in the intermediate displaces helix F and the C-terminal loop from its position overlying s2A. The return of the helix F/C-terminal loop to its resting position then forces the protease to be compressed beneath the s5A/s6A side of sheet A. Such a model is consistent with helix F residue 159 maintaining its distance from the protease during this transformation but the P7 residue in the helix F-sheet A interface sensing the movement of the helix.
Our studies additionally provide insights into the nature of the protease conformational changes in the serpin-protease complex that were previously shown to be induced by calcium ion binding. These changes involve a transformation of the protease from a catalytically inactive state to a low activity state as evidenced by an accelerated deacylation of the trapped acyl-intermediate complex with a pH dependence indicative of a restoration of catalytic triad function (11). All labeled α1PI-trypsin complexes showed enhanced rates of deacylation in the presence of calcium consistent with our prior studies. The 121 NBD fluorophore in particular showed significant proximity perturbation by calcium ions through a fluorescence enhancement that reflected a calcium-induced change in the protease conformation. The kinetics of calcium binding to the 121 NBD α1PI-trypsin complex are in keeping with our previous conclusions that the protease exists in inactive and low activity states in the serpin-protease complex that are in equilibrium. The high-affinity calcium binding site in trypsin lies within the 70 loop region whose structure is disrupted in the serpin-protease complex (5, 8). The 70 loop lies on the face of trypsin that is farthest from residue 314 and closest to residue 121 in the complex, consistent with the calcium-induced refolding of the 70 loop and possibly also the protease domain containing this loop being sensed more by residue 121 than residue 314. Calcium effects on the kinetics of 121 DANS and 314 DANS FRET changes in the α1PI-trypsin reaction indicated that similar biphasic FRET changes are involved in forming the complex in the absence and presence of calcium. The low activity state favored in the presence of calcium is thus formed by the same two-stage trapping mechanism as the fully distorted state and thus is distinct from the intermediate complex formed on the pathway to the final complex. The FRET changes indicated that whereas the protease approaches residue 121 in the intermediate less closely in the presence than in the absence of calcium, the final position of the protease near residue 314 is not affected by calcium.
In summary, our studies have provided important new insights into the serpin-protease inhibition mechanism by establishing the structural attributes of an intermediate complex involved in transforming the Michaelis encounter complex to a final trapped acyl-intermediate complex. In this intermediate, insertion of the cleaved RCL into sheet A and translocation of the acyl-linked protease have occurred, resulting in partial disabling of protease catalytic function by pulling the P1 and flanking RCL residues out of the active site. The kinetics of FRET and fluorescence perturbation changes indicate a structure for the intermediate in which the protease has arrived at the distal end of sheet A on the strand 2A side of the sheet where helix F and its C-terminal loop reside. The final complex is then formed by the protease moving toward and beneath the strand 5A/6A side of sheet A, possibly driven by a displaced F helix/C-terminal loop, which results in full disabling of protease catalytic function by pulling the catalytic serine out of its alignment and disordering one of the domains. The coupling of the latter protease conformational changes to changes in the helix F-sheet A interface reported by P7 FRET and fluorescence perturbation changes is consistent with the hypothesized role for the F helix in driving protease distortion.
This work was supported, in whole or in part, by National Institutes of Health Grants R01 HL-78827 and R37 HL39888 (to S. T. O.).
- RCL
- reactive center loop
- α1PI
- α1-protease inhibitor
- NBD
- 7-nitrobenz-2-oxa-1,3-diazole
- DANS
- 5-ethylaminonaphthalene-1-sulfonic acid
- SI
- stoichiometry of inhibition.
REFERENCES
- 1. Silverman G. A., Whisstock J. C., Bottomley S. P., Huntington J. A., Kaiserman D., Luke C. J., Pak S. C., Reichhart J.-M., Bird P. I. (2010) Serpins flex their muscle. I. Putting the clamps on proteolysis in diverse biological systems. J. Biol. Chem. 285, 24299–24305 [DOI] [PMC free article] [PubMed] [Google Scholar]
- 2. Olson S. T., Gettins P. G. W. (2011) in Progress in Molecular Biology and Translational Science (Di Cera E., ed) pp. 185–240, Elsevier, Burlington, MA: [DOI] [PubMed] [Google Scholar]
- 3. Gettins P. (2002) Serpin structure, mechanism, and function. Chem. Rev. 102, 4751–4804 [DOI] [PubMed] [Google Scholar]
- 4. Stratikos E., Gettins P. G. (1999) Formation of the covalent serpin-proteinase complex involves translocation of the proteinase by more than 70 Å and full insertion of the reactive center loop into β-sheet A. Proc. Natl. Acad. Sci. U.S.A. 96, 4808–4813 [DOI] [PMC free article] [PubMed] [Google Scholar]
- 5. Huntington J. A., Read R. J., Carrell R. W. (2000) Structure of a serpin-protease complex shows inhibition by deformation. Nature 407, 923–926 [DOI] [PubMed] [Google Scholar]
- 6. Ye S., Cech A. L., Belmares R., Bergstrom R. C., Tong Y., Corey D. R., Kanost M. R., Goldsmith E. J. (2001) The structure of a Michaelis serpin-protease complex. Nat. Struct. Biol. 8, 979–983 [DOI] [PubMed] [Google Scholar]
- 7. Peterson F. C., Gordon N. C., Gettins P. G. (2000) Formation of a noncovalent serpin-proteinase complex involves no conformational change in the serpin. Use of1H-15N HSQC NMR as a sensitive nonperturbing monitor of conformation. Biochemistry 39, 11884–11892 [DOI] [PubMed] [Google Scholar]
- 8. Peterson F. C., Gettins P. G. (2001) Insight into the mechanism of serpin-proteinase inhibition from 2D (1H-15N) NMR studies of the 69-kDa α1-proteinase inhibitor Pittsburgh-trypsin covalent complex. Biochemistry 40, 6284–6892 [DOI] [PubMed] [Google Scholar]
- 9. Olson S. T., Swanson R., Day D., Verhamme I., Kvassman J., Shore J. D. (2001) Resolution of Michaelis complex, acylation and conformational change steps in the reactions of the serpin PAI-1 with trypsin and tissue plasminogen activator. Biochemistry 40, 11742–11756 [DOI] [PubMed] [Google Scholar]
- 10. Izaguirre G., Swanson R., Raja S. M., Rezaie A. R., Olson S. T. (2007) Mechanism by which exosites promote the inhibition of blood coagulation proteases by heparin-activated antithrombin. J. Biol. Chem. 282, 33609–33622 [DOI] [PubMed] [Google Scholar]
- 11. Calugaru S. V., Swanson R., Olson S. T. (2001) The pH dependence of serpin-proteinase complex dissociation reveals a mechanism of complex stabilization involving inactive and active conformational states of the proteinase which are perturbable by calcium. J. Biol. Chem. 276, 32446–32455 [DOI] [PubMed] [Google Scholar]
- 12. Tew D. J., Bottomley S. P. (2001) Intrinsic fluorescence changes and rapid kinetics of proteinase deformation during serpin inhibition. FEBS Lett. 494, 30–33 [DOI] [PubMed] [Google Scholar]
- 13. Perron M. J., Blouse G. E., Shore J. D. (2003) Distortion of the catalytic domain of tissue-type plasminogen activator by plasminogen activator inhibitor-1 coincides with the formation of stable serpin-proteinase complexes. J. Biol. Chem. 278, 48197–48203 [DOI] [PubMed] [Google Scholar]
- 14. Gooptu B., Hazes B., Chang W. S., Dafforn T. R., Carrell R. W., Read R. J., Lomas D. A. (2000) Inactive conformation of the serpin α1-antichymotrypsin indicates two-stage insertion of the reactive loop. Implications for inhibitory function and conformational disease. Proc. Natl. Acad. Sci. U.S.A. 97, 67–72 [DOI] [PMC free article] [PubMed] [Google Scholar]
- 15. Gettins P. G. (2002) The F-helix of serpins plays an essential, active role in the proteinase inhibition mechanism. FEBS Lett. 523, 2–6 [DOI] [PubMed] [Google Scholar]
- 16. Stratikos E., Gettins P. G. (1998) Mapping the serpin-proteinase complex using single cysteine variants of α1-proteinase inhibitor Pittsburgh. J. Biol. Chem. 273, 15582–15589 [DOI] [PubMed] [Google Scholar]
- 17. Izaguirre G., Rezaie A. R., Olson S. T. (2009) Engineering functional antithrombin exosites in α1-proteinase inhibitor that specifically enhance the inhibiiton of factor Xa and factor IXa. J. Biol. Chem. 284, 1550–1558 [DOI] [PMC free article] [PubMed] [Google Scholar]
- 18. Pannell R., Johnson D., Travis J. (1974) Isolation and properties of human plasma α1-proteinase inhibitor. Biochemistry 13, 5439–5445 [DOI] [PubMed] [Google Scholar]
- 19. Olson S. T., Bock P. E., Kvassman J., Shore J. D., Lawrence D. A., Ginsburg D., Björk I. (1995) Role of the catalytic serine in the interactions of serine proteinases with protein inhibitors of the serpin family. Contribution of a covalent interaction to the binding energy of serpin-proteinase complexes. J. Biol. Chem. 270, 30007–30017 [DOI] [PubMed] [Google Scholar]
- 20. Swanson R., Raghavendra M. P., Zhang W., Froelich C., Gettins P. G., Olson S. T. (2007) Serine and cysteine proteases are translocated to similar extents upon formation of covalent complexes with serpins. J. Biol. Chem. 282, 2305–2313 [DOI] [PubMed] [Google Scholar]
- 21. Lindahl P., Raub-Segall E., Olson S. T., Björk I. (1991) Papain labelled with fluorescent thiol-specific reagents as a probe for characterization of interactions between cysteine proteinases and their protein inhibitors by competitive titrations. Biochem. J. 276, 387–394 [DOI] [PMC free article] [PubMed] [Google Scholar]
- 22. Dementiev A., Simonovic M., Volz K., Gettins P. G. (2003) Canonical inhibitor-like interactions explain reactivity of α1-proteinase inhibitor Pittsburgh and antithrombin with proteinases. J. Biol. Chem. 278, 37881–37887 [DOI] [PubMed] [Google Scholar]
- 23. Stratikos E., Gettins P. (1997) Major proteinase movement upon stable serpin-proteinase complex formation. Proc. Natl. Acad. Sci. U.S.A. 94, 453–458 [DOI] [PMC free article] [PubMed] [Google Scholar]
- 24. Dementiev A., Dobó J., Gettins P. G. (2006) Active-site distortion is sufficient for proteinase inhibition by serpins. J. Biol. Chem. 281, 3452–3457 [DOI] [PubMed] [Google Scholar]
- 25. Futamura A., Stratikos E., Olson S. T., Gettins P. G.(1998) Change in environment of the P1 side chain upon progression from the Michaelis complex to the covalent serpin-proteinase complex. Biochemistry 37, 13110–13119 [DOI] [PubMed] [Google Scholar]