

Abstract
RNA transcripts are generally identical to the underlying DNA sequences. Nevertheless, RNA–DNA differences (RDDs) were found in the nuclear human genome and in plants and animals but not in human mitochondria. Here, by deep sequencing of human mitochondrial DNA (mtDNA) and RNA, we identified three RDD sites at mtDNA positions 295 (C-to-U), 13710 (A-to-U, A-to-G), and 2617 (A-to-U, A-to-G). Position 2617, within the 16S rRNA, harbored the most prevalent RDDs (>30% A-to-U and ∼15% A-to-G of the reads in all tested samples). The 2617 RDDs appeared already at the precursor polycistrone mitochondrial transcript. By using traditional Sanger sequencing, we identified the A-to-U RDD in six different cell lines and representative primates (Gorilla gorilla, Pongo pigmaeus, and Macaca mulatta), suggesting conservation of the mechanism generating such RDD. Phylogenetic analysis of more than 1700 vertebrate mtDNA sequences supported a thymine as the primate ancestral allele at position 2617, suggesting that the 2617 RDD recapitulates the ancestral 16S rRNA. Modeling U or G (the RDDs) at position 2617 stabilized the large ribosomal subunit structure in contrast to destabilization by an A (the pre-RDDs). Hence, these mitochondrial RDDs are likely functional.
Mitochondrial DNA (mtDNA) is one of the most variable coding sequences in humans, and many of the genetic sequence variants alter mitochondrial function and disease susceptibility (Wallace 2011). In addition, mtDNA exhibits intracellular variability (heteroplasmy), the extent of which differs across individuals (Goto et al. 2011; Avital et al. 2012). Moreover, in many organisms (vertebrates and invertebrates), RNA editing contributes a third layer of sequence diversity in the mitochondria (Reichert et al. 1998). Advances in sequencing technology have enabled comparison of DNA and RNA sequences, which revealed extensive RNA–DNA sequence differences (RDDs) in the human nuclear genome (Ju et al. 2011; Li et al. 2011; Pachter 2012; Peng et al. 2012), although the identification of noncanonical RDDs (i.e., non A-to-G or C-to-U) was subjected to ongoing discussion (Kleinman and Majewski 2012; Lin et al. 2012; Peng et al. 2012; Pickrell et al. 2012; Piskol et al. 2013). Even though RNA editing is common in the mitochondria of many organisms (Knoop 2011), it has not been explored in humans. Here, by using stringent parameters to analyze mtDNA and matching RNA from different individuals and tissues, we uncovered sites in the human mitochondria where the RNA sequences do not match the underlying DNA sequences.
Results
High-throughput sequence analysis detects RDDs in human mitochondrial DNA
DNA and mRNA samples from cultured B cells of five Caucasians were sequenced using Illumina technology (Bentley et al. 2008). We analyzed uniquely mapped mtDNA sequence reads that aligned to the revised Cambridge Reference Sequence (rCRS) but not to the nuclear genome sequences (hg19). We excluded sites that mapped to low complexity regions (filter A), which are frequently misaligned among the reads due to sequencing errors. We required that all nucleotide positions in our analyses have at least 1000 sequence reads coverage (filter B) (Avital et al. 2012). Out of the 16,569 mtDNA bases, on average 16,435 and 14,752 nucleotide (nt) positions in our DNA and RNA samples, respectively, met these criteria (Supplemental Fig 1; Supplemental Table 1). We also excluded sites corresponding to heteroplasmic changes (i.e., either present in corresponding RNA and DNA reads or present only in DNA reads, but not in RNA) and excluded samples having in their secondary reads a combination of mutations forming known haplotypes. By comparing RNA sequences to their corresponding DNA sequences, we found RDD sites. To be considered an RDD site, the RNA sequence that differs from the corresponding DNA sequence must be covered by reads in both directions. At least 1.6% of the reads (i.e., 0.8% from the reads of each of the strands, filter C) (He et al. 2010) and a minimum of five reads per strand at a given site (filter D) must have the RDD base. These stringent filters were imposed to minimize our false-discovery rate; however, most likely they led us to exclude some true RDD sites (Avital et al. 2012). By these criteria, we uncovered three mitochondrial RDD sites; two of these sites were present in all five individuals (positions 2617, A-to-U and A-to-G; 13710, A-to-U and A-to-G), and the third was found in two of the five individuals (position 295, C-to-U). Manual inspection of the C295U site revealed that it is found in all individuals but was filtered out in three of the five individuals (Table 1).
Table 1.
RDDs and their levels in B cells from five individuals
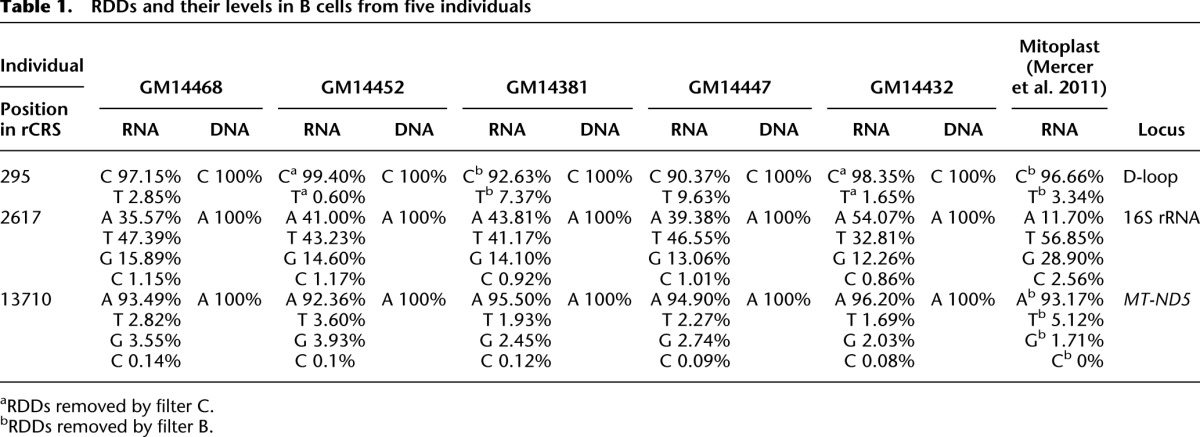
At position 2617, within the 16S rRNA of the large ribosomal subunit, we identified both A-to-U and A-to-G RDDs. In each of the tested samples, the A-to-G levels were ∼15%, which is lower than the A-to-U levels (>30%). First, Sanger sequencing of PCR products confirmed the A-to-U RDD in all five tested individuals (Fig. 1; Supplemental Fig. 2). Since we suspected that the A-to-G RDD was not detected due to the low sensitivity of direct Sanger sequencing of the PCR fragment, we cloned the PCR product encompassing position 2617 from a representative sample (GM14447) and Sanger sequenced 24 independent plasmid clones. This analysis revealed nine clones with an adenine (A; no RDD), 13 with a thymine (T; A-to-U), and two with a guanine (G; A-to-G), thus validating both the A-to-U and A-to-G RDDs at this site.
Figure 1.
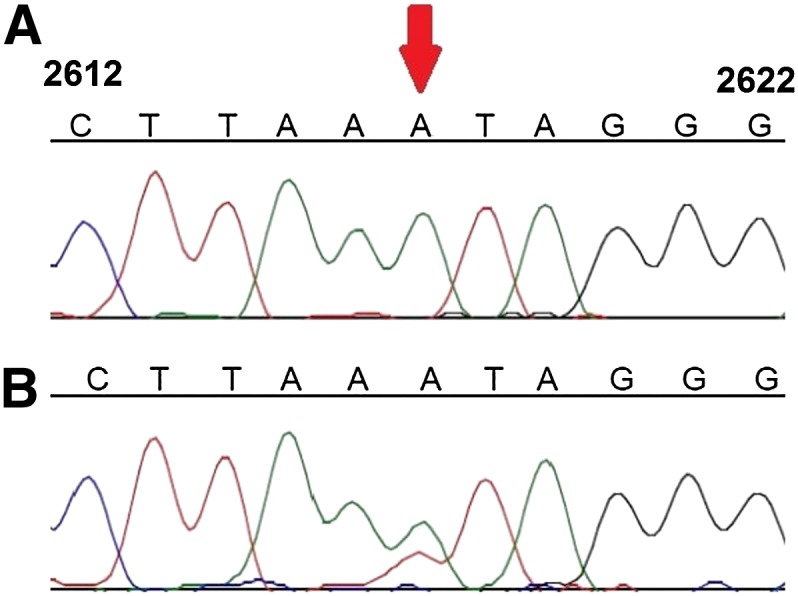
Validation of the RDD at position 2617 by Sanger sequencing. The numbers from each side of the sequences correspond to mtDNA positions. Red arrow points at position 2617. Presented is a representative sample: cultured B cells from GM14468.
The mtDNA RDDs do not stem from mapping errors
To exclude the possibility that the RDD site represents erroneous pseudogene sequences encoded in the nuclear genome (NUMTs), we examined RNA sequences of isolated mitochondria (mitoplasts) from the Mattick laboratory (Mercer et al. 2011). The results confirmed the A-to-U and A-to-G RDD at position 2617 as well as the RDDs identified at positions 295 and 13710 (Table 1). Since the A-to-U RDD at position 2617 was found at high levels (>30%) in all subjects, we focused on this site for further analyses. Examination of 9868 publicly available whole-human mtDNA sequences (www.phylotree.org) revealed only an A at that position.
When we used mtDNA fragment positions 2567–2666 in a BLAT screen (Kent 2002) against the entire human genome (hg19), we identified 30 hits, of which all had mutations in additional positions that were not identified in our entire data set (both RNA and DNA reads), thus excluding contamination of our data by NUMTs (Supplemental Fig. 3). Moreover, 26 of the BLAT hits harbored an A at the mtDNA homologous position 2617, suggesting that if some of the reads did represent NUMT leakage, then these reads would not influence the presence of our identified RDDs. Finally, we obtained paired DNA and RNA samples corresponding to six different human cell types, including normal brain cortices, colon, skeletal muscle, and liver, preadipocyte (Chub-S7) as well as a neuroblastoma cell line (SH-SY5Y). Sanger sequencing showed the A-to-U RDD in all the samples (Supplemental Fig. 2); thus, the results confirmed the findings from our deep sequencing data and showed that this RDD is found in mtDNA transcripts from different human cell types.
The 2617 RDD appeared at the precursor polycistrone mitochondrial transcript
We aimed to assess when during transcription do the RDDs form by analyzing polycistronic transcripts. MtDNA is transcribed first as precursor polycistronic transcripts and then cleaved into mature transcripts following the tRNA punctuation model (Ojala et al. 1981; Bestwick and Shadel 2013). We amplified four fragments of these precursor transcripts that encompassed the 3′ and 5′ junctions of the 16S rRNA gene (Supplemental Fig. 4) using cDNA from two double DNase I–treated purified RNA samples (GM14447 and GM14381). We also included a “no-reverse transcriptase” control to exclude DNA contamination. Deep sequencing (more than 100,000 reads per base per sample, no strand bias) showed that the precursor polycistronic transcripts had significantly a lower RDD level (GM14447: 5.3% A-to-U, 0.4% A-to-G; GM14381: 3.2% A-to-U, 0.2% A-to-G) compared with the deep sequencing data, which encompass both mature and polycistronic mtDNA transcripts (χ2, P < 10−12). This shows that the A-to-U and A-to-G RDDs at position 2617 likely start as early as the emergence of the polycistronic transcript. Although the sequence reads stem from our purely amplified polycistronic fragments, we cannot disregard the possibility that the RDDs reflect remains of the mature transcript. However notably, we did not detect any sequence reads corresponding to mature transcripts from any mtDNA regions outside of our polycistronic fragment (Supplemental Table 2).
The 2617 RDD is present in other primates and restores ancestral form of the 16S rRNA
We next assessed the evolutionary conservation of position 2617. Alignment of DNA sequences from 1755 vertebrates revealed that the homologous positions to human mtDNA position 2617 have either an A or a T in 1752 species (Supplemental Figs. 5, 6). Within primates, most simians have an A except prosimians (slow loris, tarsier, and various lemur species), who have a T and one lemur subspecies with a cytosine (C) (Figs. 2, 3; Supplemental Fig. 6). Nonprimate mammals that are phylogenetically closest to primates have a T at the corresponding position (Supplemental Fig. 6). Together, these data show that T is the primate ancestral allele at this position. We then asked if RDD is found at this site in other species besides human. Sanger sequencing of regions homologous to human mtDNA position 2617 in representative nonhuman primates revealed an A-to-U RDD in organisms where their mtDNA harbors an A (Pongo pigmaeus, Gorilla gorilla, and Macaca mulatta) but no RDD in Lemur katta and Nycticebus coucang, where their genomic sequence is a T at this site (Fig. 4; Supplemental Fig. 7). Thus, RDD at position 2617 occurred in organisms where the genomic DNA sequence is A but not in those with a T in their DNA; this suggests that the RDD event converts the A to recapitulate the ancestral T state.
Figure 2.

Phylogenetic analysis of mitochondrial DNA sequences of 62 primates and one Dermoptera (Galeopterus variegatus). The primate portion of the phylogenetic analysis of mtDNA eutherian sequences from 334 organisms; the full vertebrate tree is shown in Supplemental Figure 6. Numbers on the branches are scores from 1000 bootstrap replicates. Ancestral state of position 2617 is indicated for each branch.
Figure 3.

Multiple sequence alignment of mitochondrial DNA sequences of 62 primates and one Dermoptera (G. variegatus). Shown are primate orthologs of human mtDNA positions 2608–2624 (framed is the nucleotide at position 2617). Stem, Loop, Stem columns indicate the mtDNA sequence corresponding to the stem-and-loop structure of 16S rRNA around position 2617. The full vertebrate sequence alignment is in Supplemental Figure 5.
Figure 4.
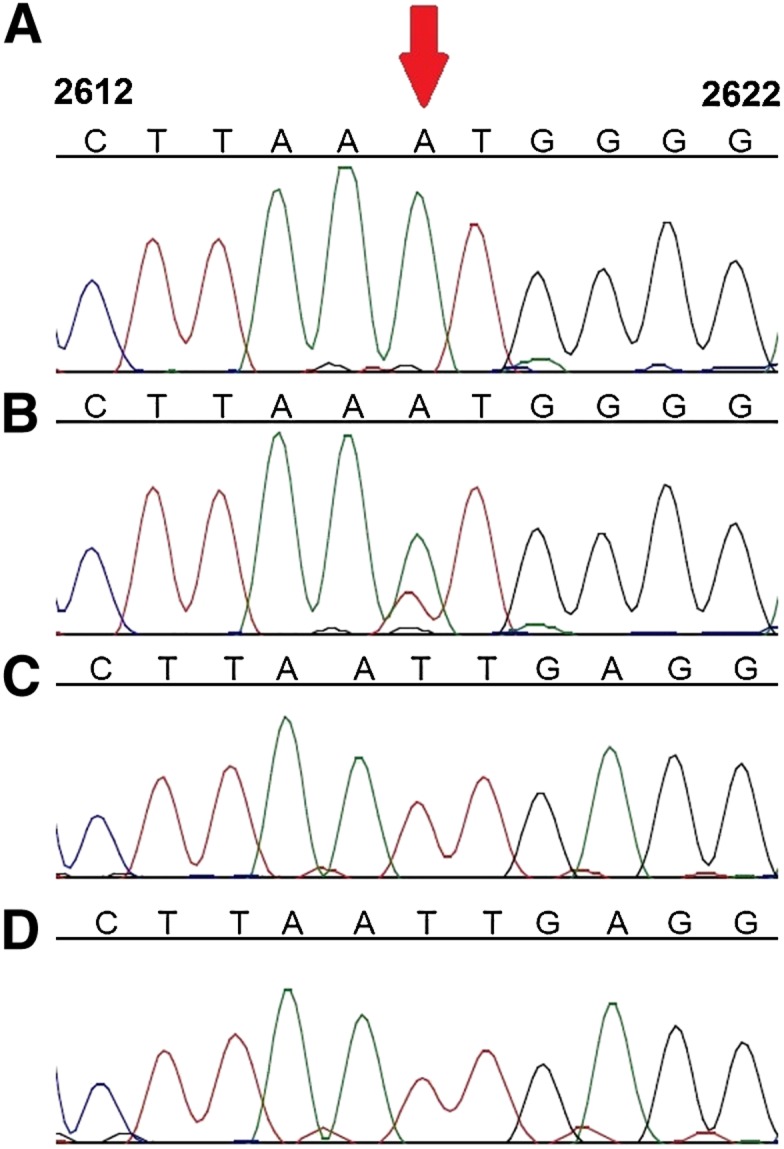
Sanger sequence analysis of position 2617 from DNA and RNA samples of mtDNA from various primates. Pongo pigmaeus (A) DNA and (B) RNA; Nycticebus coucang (C) DNA and (D) RNA. Red arrow indicates nucleotide position corresponding to position 2617 in human mtDNA. Numbers on top of each base indicate positions according to the rCRS.
Modeling the 2617 RDDs reveals stabilization of the ribosome structure in contrast to destabilization by the DNA original base
Finally, we tested whether the RDD at position 2617 affects the structure of 16S rRNA. In the absence of the human mitochondrial ribosomal high-resolution structure, we analyzed the closely related bacterial and yeast 23S rRNA (Mears et al. 2006). We found striking structural conservation of a stem and loop structure (H71) of the large ribosomal subunit lying within the interaction interface with the small ribosomal subunit and at the tRNA entrance channel (Fig. 5). In Escherichia coli, position 1954, which is the homologous position to human mtDNA position 2617, harbors a G, and in the determined structures of the nuclear Homo sapiens (Anger et al. 2013) and Saccharomyces cerevisiae (Ben-Shem et al. 2011) rRNA, it is a uracil (U). We modeled a C, a G, or a U in this position and found that all could be accommodated without changing the local rRNA fold. This accommodation could be explained either by direct formation of a hydrogen bond between the G and the rRNA backbone or by indirect hydrogen bonds that are mediated by water or ion molecules between a pyrimidine and the rRNA backbone at this position (Fig. 5). However, the model suggests that an A at this position will abolish the potential hydrogen bond to H64 backbone. Thus, the A-to-U and A-to-G RDDs at this position recapitulate the secondary structure of the bacterial rRNA loop and therefore likely stabilize the ribosome structure. Interestingly, although the human nuclear DNA encoded rRNA harbors a structurally conserved stem and loop to H71 (Fig. 5), the homologous position to mtDNA 2617 harbors a U, as in the mtDNA RDD. Moreover, the RNA reads of this position in our five human analyzed individuals were identical to the DNA template, i.e., harboring a T (100,000 sequence reads coverage, 99.95% T; 0.05% of the reads could be regarded as sequencing errors). These results further support the need for A replacement in the 16S rRNA at position 2617.
Figure 5.

Structure of the ribosome section corresponding to region orthologous to that of position 2617. (Left) The large ribosomal subunit from a bacterium, Deinococcus radiodurans, represented as ribbon. The A-, P-, and E-binding sites of tRNA on the ribosomal large subunit are shown. (Right) Sticks-and-ribbon representation of H71 and H64 interaction in the bacterial (blue) or human (yellow) orthologous ribosomes. The hydrogen bond that is disrupted by an adenine in position 2617 is represented as a dashed line. Numbers represent positions of E. coli ribosomal RNA.
Discussion
This is the first report of RDDs in human mitochondria. We showed that the RDDs in position 2617 were present already in the polycistronic RNA molecule, though in lower levels (an order of magnitude) compared with the total mtDNA transcript analysis. Hence, we suggest that the RDDs start either cotranscriptionally or immediately after the synthesis of the RNA molecule. We interpret the increase in RDD levels in the total RNA sample as the result of either increased stability of the RDD-containing transcript or continuation of RDD generation during the maturation process of the 16S rRNA molecule. Sequence analysis of over 1700 organisms revealed that while the human mtDNA sequence at position 2617 is an A, the primate ancestral base is a T. Thus, mtDNA RDD formation in humans recapitulates the primate ancestral 16S rRNA. In other primates where the DNA base at this position is an A, an RDD changed the RNA bases to U, but no RDD was found in organisms where the DNA base was T. Functionally, position 2617 is embedded within a very important region in the ribosome, harboring the position where the small and large subunits of ribosomal RNA interface with the tRNA. Thus our observed importance of the RDD for the 16S rRNA secondary structure is likely functional. Recently we learned that a noncanonical A-to-U RDD is essential for intron processing of the tRNA-Tyr gene in the nuclear genome of Trypanosoma brucei, for the translation process and for cell life (MAT Rubio, P Zdeněk, IMC Fleming, PJ Sample, CR Trotta, and JD Alfonzo, pers. comm.). Thus, similar to our results, the A-to-U RDD is functionally important. Moreover, this finding corroborates our identification of a noncanonical A-to-U RDD in a phylogenetically distant species, thus supporting the existence of previously unidentified RNA processing machinery.
Heated discussion about the false-discovery rate of RDDs mainly stem from mapping errors (i.e., false interpretation of sequence alterations in pseudogenes and gene paralogs as RDDs), false RDD identification at the end of sequence reads, misalignment of exon–intron boundaries, and misinterpretation of rare polymorphisms as RDDs (Kleinman and Majewski 2012; Lin et al. 2012; Peng et al. 2012; Pickrell et al. 2012; Piskol et al. 2013). First, unlike the nuclear genome, human mtDNA-encoded genes have no active paralogs in other loci. Second, we used only uniquely mapped reads to exclude mapping errors. Furthermore, although the region harboring our identified 2617 RDDs had sequence similarity to 30 nuclear DNA loci (which likely are NUMTs), all of these loci had mutations in additional positions that were not identified in our entire data set (both RNA and DNA reads), thus excluding NUMT contamination and mapping errors. Third, strand bias was addressed by the usage of our filters C and D (also see Supplemental Fig. 8; Supplemental Table 3). Fourth, since the human mtDNA genes do not undergo splicing, exon intron boundaries cannot explain false discovery in our study. Finally, we show that neither of our identified mtDNA RDDs occur at the end of the reads (Supplemental Fig. 8). We thus conclude that our approach identified true human mtDNA RDDs.
How were the 2617 RDDs formed? Since this position harbors both A-to-U and A-to-G RDDs, three major possibilities come to mind: (1) First, it is possible that two separate enzymes modify the adenosine at this position, one replacing it for a U and the other (possibly an ADAR-like enzyme) (for review, see Knoop 2011) for an inosine (or a G); and (2) for replacing the A for a U in two steps, an ADAR-like enzyme replaces the A for an inosine, which in turn is replaced for a U by another enzyme; and (3) a single enzyme replaces the 2617 A at the 16S rRNA for an unknown modified nucleotide, which is read by the resultant sequence mainly as a U but also as a G. With this in mind, although our sequence analysis detected A-to-U and A-to-G RDDs, it is possible that these RDDs constitute unknown base alterations that are read ultimately as T and G, respectively. These alternatives also apply to position 13710, which harbored the same RDDs.
Although three mtDNA positions harbored RDDs (positions 295, 13710, and 2617), the functional potential of the RDDs within positions 295 and 13710 is not easy to interpret, i.e., since the first position (295) lies within the noncoding D-loop and the latter (13710) alters a third codon position of a relatively prevalent amino acid (alanine) in the MT-ND5 (also known as ND5) gene. In contrast, as mentioned above, the high sequence and structural conservation of position 2617 within the 16S rRNA, its high RDD level in all tested samples, and its occurrence in all tested species underlined the functional potential of RDDs at this position. We speculate that the functional importance of the 2617 RDDs could be further investigated in conditions when the RDD occurrence is perturbed, possibly in patients exhibiting mitochondrial translation defects (Rotig 2011).
If a U but not an A at position 2617 is important for mitochondrial ribosome function, why did an A become fixed at the mtDNA of so many vertebrate nodes? This question raises the possibility that the fixation of 2617A was due to a ribosome independent negative selection, i.e., selective pressure acting on the DNA sequence at this position, independent of the selection which acts on that position at the RNA level. This further suggests another dimension for the functional importance of this position.
Methods
Cell culture and tissue samples
Lymphoblastoid cell lines derived from five female Caucasian individuals from an apparently healthy collection (GM14432/452/468/447/381) were grown in suspension in RPMI 1640. Chub S7 preadipocytes (Darimont et al. 2003) were grown in DMEM/F12 culture media 1:1 (v/v); human neuroblastoma cell line T-Rex SH-SY5Y (Lee et al. 2007) was grown in DMEM (high glucose). All growth media were supplemented with 10% fetal calf serum (FCS), 2 mM L-glutamine, 100 U/mL penicillin, and 100 μg/mL streptomycin and were grown in 5% CO2 at 37°C. Seven normal colon RNA and DNA sample pairs were purchased from Asterand (samples catalog nos. 107807B1, 110476B1, 1112467F, 1118987F, 112964A1, 113003A1, 126828A1). Human brain cortex, skeletal muscle, and liver tissue samples were obtained from the National Disease Research Interchange from six individuals (64998, 65080, 65288, 65699, 65777, and 65914). Tissues were collected 7–12 h post-mortem during routine autopsies of donors that suffered from respiratory or cardiac failure. All individuals were Caucasians between ages 62 and 79 yr, including both males and females. Samples were snap-frozen and kept at −80°C until DNA/RNA extraction.
DNA and RNA extraction from cell lines and tissues
DNA was extracted using the Genomics DNA Extraction Mini Kit (RBC Bioscience), and RNA was extracted using the PerfectPure RNA Cell and Tissue Kit (5 PRIME), following the manufacturer's protocol.
DNA from brain cortex, skeletal muscle, and liver tissue was extracted using the Gentra Puregene Tissue Kit (Qiagen). RNA was extracted from brain cortex using the MaXtract High Density Kit (Qiagen), from skeletal muscle using the RNeasy Maxi Kit (Qiagen), and from liver using the RNeasy Lipid Tissue Mini kit (Qiagen). All extractions followed the manufacturer's protocol.
cDNA synthesis
One microgram of total RNA was subjected to cDNA synthesis using the iScript cDNA Synthesis Kit (Bio-Rad), following the manufacturer's protocol.
Total RNA from brain cortex, skeletal muscle, and liver tissues was converted into cDNA using Taqman reverse transcription reagents with random hexamer priming following the manufacturer's protocol (Applied Biosystems).
Massive parallel deep sequencing
DNA was extracted from the five lymphoblastoid cell lines (see Cell Culture and Tissue Samples section), and libraries were prepared using the TruSeq Paired End Kit (Illumina). RNA was collected from the same cell lines, and libraries were prepared according to the manufacturer's protocol of the TruSeq RNA Kit (Illumina). Both DNA and RNA were sequenced using a HiSeq 2000 instrument (Illumina). DNA libraries were sequenced using 100-nt, paired-end reads. RNA libraries were sequenced with 100-nt, single-end reads.
Analysis of Illumina data
Illumina sequencing reads were aligned against the hg19 (GenBank, GCA_000001405.1). In order to identify mtDNA sequences, we utilized the rCRS (GenBank NC_012920). The BWA sequence alignment tool was used (Li and Durbin 2009) following the default protocol of the 1000 Genome Sequence Analysis (ftp.1000genomes.ebi.ac.uk/vol1/ftp/README.alignment_data). Only reads that were uniquely aligned to the rCRS were used for further analyses. SAMtools (Li et al. 2009) was used to convert the SAM to the BAM sequence format. Reads alignments to the rCRS were visualized using the Integrative Genomics Viewer (Robinson et al. 2011). MitoBamAnnotator (Zhidkov et al. 2011) was used to identify secondary read changes either in DNA or in both corresponding RNA and DNA samples; these changes were considered heteroplasmic and were excluded from further analyses; RNA-specific secondary reads were considered RDDs. Secondary read changes were considered high quality only if they occurred outside of low-complexity regions (filter A), if they were identified by at least a 1000 high-quality sequence reads (filter B), if their minimal read fraction was at least 1.6% (i.e., 0.8% from the reads of each of the strands, filter C) (He et al. 2010), and if their minimal sequence read count per strand was more than five (filter D).
PCR amplification and direct sequencing of mtDNA and corresponding RNA fragments encompassing positions 2617
The PCR reaction contained primers 1 and 2 for human samples or primers 3 and 4 for primate samples (Supplemental Table 4), 0.5 unit Phusion Taq polymerase, and 1× reaction buffer (Finnzymes), 2.5 mM dNTPs mix, and either 30 ng DNA or 1 μL of cDNA used as templates. Reaction conditions were as follows: 5 min at 98°C; 30 cycles including denaturation (98°C, 15 sec), annealing (30 sec at 70°C [humans] or 67°C [primates]), and elongation (30 sec [human] or 10 sec [primates at 72°C); and a final extension step (7 min at 72°C). The reaction was stored at −20°C until usage. PCR products were visualized on an EtBr-stained 1% agarose gel, purified using Wizard SV Gel and PCR Clean-up system (Promega), following manufacturer's protocol, and sequenced (ABI 3100) using the amplification primers (BGU sequencing facility). The brain cortex, skeletal muscle, and liver samples were PCR amplified using primers 5 and 6 (Supplemental Table 4), and Phusion HotStart DNA Polymerase (Thermo Scientific). Reaction conditions were as follows: 30 sec at 98°C; followed by 35 cycles including denaturation (10 sec at 98°C), annealing (30 sec at 58°C), and elongation (90 sec at 72°C); and a final extension step (10 min at 72°C.). PCR products were sequenced using 3730 DNA analyzer (Applied Biosystems) with the amplification primers. All sequences were aligned against the rCRS (Sequencher 4.10.1, GeneCodes).
Cloning and sequencing
The purified PCR product from sample GM14447 was ligated into pGEM-T Easy Vector (Promega). The ligation reaction was performed using T4 ligase (Promega) with vector/insert ratio of 1:3 for 1 h at room temperature according to the instructions of the DNA Ligation Kit (Promega). Then, 5 μL of the ligation reaction was mixed with 50 μL of competent E. coli cells (DH5α) and subjected to electric shock using Gene Pulser Xcell (Bio-Rad). Following electroporation, 500 μL of LB was added, and cells were shaken gently for 1 h at 37°C. The bacteria were plated onto LB Petri dishes containing 50 μg/mL ampicillin, 40 μL of 0.1 M IPTG, and 40 μL of 2%-X-gal and grown overnight at 37°C. Following “blue/white” colony selection, white insert-containing colonies were isolated and grown in 5 mL liquid LB with 100 mg/mL ampicillin for 12 h at 37°C, with shaking. Plasmid DNA was purified using Wizard Plus SV Minipreps DNA Purification System (Promega), according to the manufacturer's protocol. Each plasmid was sequenced in the ABI 3100 sequencing machine using SP6 standard primer (BGU sequencing facility). Sequences generated from each plasmid were aligned against the rCRS using Sequencher 4.10.1 (GeneCodes).
Phylogenetic analysis
Whole mtDNA sequences from 1755 vertebrates were downloaded from NCBI organelle resources (www.ncbi.nlm.nih.gov/genomes/GenomesHome.cgi), and the 16S rRNA gene sequences were extracted and aligned using MAFFT (mafft.cbrc.jp/alignment/server/). The same approach was used to align whole mtDNA sequences from 334 Eutheria (placental mammals). A maximum likelihood phylogenetic tree was constructed, with 1000 bootstrap replicates; this enabled us to predict the ancestral nucleotide of all major phylogenetic clades.
Second DNase treatment and RNA purification
In order to exclude DNA contamination from our RNA samples, we subjected RNA to a second round of DNase I treatment according to manufacturer's instructions (5 PRIME no. FP-2500120), in addition to the treatment performed during the RNA purification protocol. RNA was then isolated by isopropanol precipitation: 3 M sodium acetate was added up to 10% of the RNA solution (5 μg RNA) volume. Then room-temperature isopropanol (0.7 reaction volume) was added to the solution, followed by 30 min of centrifugation at 4°C and 14,000g. The supernatant was carefully removed, and 180 μL of 70% ethanol was added, followed by another round of centrifugation for 15 min at 4°C at 14,000g. The supernatant was removed carefully, and 25 μL of RNA elution buffer (5 PRIME no. FP-2500120) was added.
Inspection of position 2617 in the polycistronic RNA molecule
We PCR amplified four fragments encompassing the 16S rRNA gene and flanking coding sequences, representing the precleavage polycistronic mtDNA molecule (Supplemental Fig. 4). A template for the fragments' amplification was cDNA generated from GM14447 and GM14381 RNA samples (double DNase I treatment to avoid residual DNA contamination; see above) in which we already identified the 2617 A-to-U and A-to-G RDDs. A “no-reverse transcriptase” control of the above-mentioned RNA samples was included. PCR reactions were as described above using the following primer couples (Supplemental Table 4): fragment 1, primers 7 and 8; fragment 2, primers 7 and 9; fragment 3, primers 10 and 11; and fragment 4, primers 11 and 12. Reaction conditions were as follows: 5 min at 98°C followed by 30 cycles, each including denaturation (15 sec at 98°C), 20 sec annealing (fragments 1 and 2, 68°C; fragments 3 and 4, 63°C), and elongation (30 sec at 72°C), and a final extension step (7 min at 72°C). The reactions were concluded at 10°C and stored in −20°C until usage. We directly used RNA (not cDNA) extracted from sample GM14447 as a negative control for these amplification reactions. PCR products were visualized on an agarose gel and purified. Phosphate was added to the 5′ ends of all fragments using T4 Polynucleotide Kinase (Fermentas no. EK0031) according to manufacturer's instructions to allow adaptors ligation for sequencing in the Illumina MiSeq platform without shearing (Technion Genome Center). A total of 404,509 and 242,395 reads were generated for individual GM14447 and GM14381, respectively. The reads were mapped to the rCRS and analyzed using the MitoBamAnnotator according to the method described above.
Ribosome structure visualization
Six available unique large ribosomal subunit structures (3R8S, 1JJ2, 2ZJR, 2J01, 3J3F, and 3U5D) were overlapped by coot (Emsley et al. 2010) using the least squares quadratic (LSQ) method with the sequence range of (1900-2000ec) onto the Dianoccocus radiodurance 50S ribosomal subunit structure 1NKW (Harms et al. 2001). Structural visualization and figure preparation were performed using PyMOL (DeLano 2002).
Data access
The deep sequencing raw data from this study have been submitted to the European Nucleotide Archive (ENA; http://www.ebi.ac.uk/ena/) under study accession nos. ERP001523 (DNA) and ERP002075 (RNA).
Acknowledgments
This work was funded by the Israeli Science Foundation grant to D.M. (ISF 387/08). We thank Professor Vivian G. Cheung for providing samples and data, critical reading, editing, and discussion of the manuscript. We thank Dr. Andrey Krasilnikov and Dr. Craig Cameron for their advice on rRNA chemistry and mitochondrial transcription. We also thank Professor Ada Yonath (Weizmman Institute) and Professor Batsheva Kerem (Hebrew University, Jerusalem) for critical reading of the manuscript.
Author contributions: D.M. and D.B.Y. conceived the study; D.B.Y. and G.A. analyzed the samples, data, and participated in study design; L.L. analyzed the data; N.H., A.R., B.R.J., and A.N. analyzed the samples; R.Z. analyzed the structural data; D.M. wrote the manuscript.
Footnotes
[Supplemental material is available for this article.]
Article published online before print. Article, supplemental material, and publication date are at http://www.genome.org/cgi/doi/10.1101/gr.161265.113.
References
- Anger AM, Armache JP, Berninghausen O, Habeck M, Subklewe M, Wilson DN, Beckmann R 2013. Structures of the human and Drosophila 80S ribosome. Nature 497: 80–85 [DOI] [PubMed] [Google Scholar]
- Avital G, Buchshtav M, Zhidkov I, Tuval Feder J, Dadon S, Rubin E, Glass D, Spector TD, Mishmar D 2012. Mitochondrial DNA heteroplasmy in diabetes and normal adults: Role of acquired and inherited mutational patterns in twins. Hum Mol Genet 21: 4214–4224 [DOI] [PMC free article] [PubMed] [Google Scholar]
- Ben-Shem A, Garreau de Loubresse N, Melnikov S, Jenner L, Yusupova G, Yusupov M 2011. The structure of the eukaryotic ribosome at 3.0 A resolution. Science 334: 1524–1529 [DOI] [PubMed] [Google Scholar]
- Bentley DR, Balasubramanian S, Swerdlow HP, Smith GP, Milton J, Brown CG, Hall KP, Evers DJ, Barnes CL, Bignell HR, et al. 2008. Accurate whole human genome sequencing using reversible terminator chemistry. Nature 456: 53–59 [DOI] [PMC free article] [PubMed] [Google Scholar]
- Bestwick ML, Shadel GS 2013. Accessorizing the human mitochondrial transcription machinery. Trends Biochem Sci 38: 283–291 [DOI] [PMC free article] [PubMed] [Google Scholar]
- Darimont C, Zbinden I, Avanti O, Leone-Vautravers P, Giusti V, Burckhardt P, Pfeifer AM, Mace K 2003. Reconstitution of telomerase activity combined with HPV-E7 expression allow human preadipocytes to preserve their differentiation capacity after immortalization. Cell Death Differ 10: 1025–1031 [DOI] [PubMed] [Google Scholar]
- DeLano WL. 2002. The PyMOL molecular graphics system. DeLano Scientific, San Carlos. [Google Scholar]
- Emsley P, Lohkamp B, Scott WG, Cowtan K 2010. Features and development of Coot. Acta Crystallogr D Biol Crystallogr 66: 486–501 [DOI] [PMC free article] [PubMed] [Google Scholar]
- Goto H, Dickins B, Afgan E, Paul IM, Taylor J, Makova KD, Nekrutenko A 2011. Dynamics of mitochondrial heteroplasmy in three families investigated via a repeatable re-sequencing study. Genome Biol 12: R59. [DOI] [PMC free article] [PubMed] [Google Scholar]
- Harms J, Schluenzen F, Zarivach R, Bashan A, Gat S, Agmon I, Bartels H, Franceschi F, Yonath A 2001. High resolution structure of the large ribosomal subunit from a mesophilic eubacterium. Cell 107: 679–688 [DOI] [PubMed] [Google Scholar]
- He Y, Wu J, Dressman DC, Iacobuzio-Donahue C, Markowitz SD, Velculescu VE, Diaz LA Jr, Kinzler KW, Vogelstein B, Papadopoulos N 2010. Heteroplasmic mitochondrial DNA mutations in normal and tumour cells. Nature 464: 610–614 [DOI] [PMC free article] [PubMed] [Google Scholar]
- Ju YS, Kim JI, Kim S, Hong D, Park H, Shin JY, Lee S, Lee WC, Kim S, Yu SB, et al. 2011. Extensive genomic and transcriptional diversity identified through massively parallel DNA and RNA sequencing of 18 Korean individuals. Nat Genet 43: 745–752 [DOI] [PubMed] [Google Scholar]
- Kent WJ 2002. BLAT—the BLAT-like alignment tool. Genome Res 12: 656–664 [DOI] [PMC free article] [PubMed] [Google Scholar]
- Kleinman CL, Majewski J 2012. Comment on “Widespread RNA and DNA sequence differences in the human transcriptome.” Science 335: 1302. [DOI] [PubMed] [Google Scholar]
- Knoop V 2011. When you can't trust the DNA: RNA editing changes transcript sequences. Cell Mol Life Sci 68: 567–586 [DOI] [PMC free article] [PubMed] [Google Scholar]
- Lee YJ, Miyake S, Wakita H, McMullen DC, Azuma Y, Auh S, Hallenbeck JM 2007. Protein SUMOylation is massively increased in hibernation torpor and is critical for the cytoprotection provided by ischemic preconditioning and hypothermia in SHSY5Y cells. J Cereb Blood Flow Metab 27: 950–962 [DOI] [PMC free article] [PubMed] [Google Scholar]
- Li H, Durbin R 2009. Fast and accurate short read alignment with Burrows-Wheeler transform. Bioinformatics 25: 1754–1760 [DOI] [PMC free article] [PubMed] [Google Scholar]
- Li H, Handsaker B, Wysoker A, Fennell T, Ruan J, Homer N, Marth G, Abecasis G, Durbin R 2009. The Sequence Alignment/Map format and SAMtools. Bioinformatics 25: 2078–2079 [DOI] [PMC free article] [PubMed] [Google Scholar]
- Li M, Wang IX, Li Y, Bruzel A, Richards AL, Toung JM, Cheung VG 2011. Widespread RNA and DNA sequence differences in the human transcriptome. Science 333: 53–58 [DOI] [PMC free article] [PubMed] [Google Scholar]
- Lin W, Piskol R, Tan MH, Li JB 2012. Comment on “Widespread RNA and DNA sequence differences in the human transcriptome.” Science 335: 1302. [DOI] [PubMed] [Google Scholar]
- Mears JA, Sharma MR, Gutell RR, McCook AS, Richardson PE, Caulfield TR, Agrawal RK, Harvey SC 2006. A structural model for the large subunit of the mammalian mitochondrial ribosome. J Mol Biol 358: 193–212 [DOI] [PMC free article] [PubMed] [Google Scholar]
- Mercer TR, Neph S, Dinger ME, Crawford J, Smith MA, Shearwood AM, Haugen E, Bracken CP, Rackham O, Stamatoyannopoulos JA, et al. 2011. The human mitochondrial transcriptome. Cell 146: 645–658 [DOI] [PMC free article] [PubMed] [Google Scholar]
- Ojala D, Montoya J, Attardi G 1981. tRNA punctuation model of RNA processing in human mitochondria. Nature 290: 470–474 [DOI] [PubMed] [Google Scholar]
- Pachter L 2012. A closer look at RNA editing. Nat Biotechnol 30: 246–247 [DOI] [PubMed] [Google Scholar]
- Peng Z, Cheng Y, Tan BC, Kang L, Tian Z, Zhu Y, Zhang W, Liang Y, Hu X, Tan X, et al. 2012. Comprehensive analysis of RNA-Seq data reveals extensive RNA editing in a human transcriptome. Nat Biotechnol 30: 253–260 [DOI] [PubMed] [Google Scholar]
- Pickrell JK, Gilad Y, Pritchard JK 2012. Comment on “Widespread RNA and DNA sequence differences in the human transcriptome.” Science 335: 1302. [DOI] [PMC free article] [PubMed] [Google Scholar]
- Piskol R, Peng Z, Wang J, Li JB 2013. Lack of evidence for existence of noncanonical RNA editing. Nat Biotechnol 31: 19–20 [DOI] [PubMed] [Google Scholar]
- Reichert A, Rothbauer U, Morl M 1998. Processing and editing of overlapping tRNAs in human mitochondria. J Biol Chem 273: 31977–31984 [DOI] [PubMed] [Google Scholar]
- Robinson JT, Thorvaldsdottir H, Winckler W, Guttman M, Lander ES, Getz G, Mesirov JP 2011. Integrative genomics viewer. Nat Biotechnol 29: 24–26 [DOI] [PMC free article] [PubMed] [Google Scholar]
- Rotig A 2011 Human diseases with impaired mitochondrial protein synthesis. Biochim Biophys Acta 1807: 1198–1205 [DOI] [PubMed] [Google Scholar]
- Wallace DC 2011. Bioenergetic origins of complexity and disease. Cold Spring Harb Symp Quant Biol 76: 1–16 [DOI] [PMC free article] [PubMed] [Google Scholar]
- Zhidkov I, Nagar T, Mishmar D, Rubin E 2011. MitoBamAnnotator: A web-based tool for detecting and annotating heteroplasmy in human mitochondrial DNA sequences. Mitochondrion 11: 924–928 [DOI] [PubMed] [Google Scholar]