

Abstract
Deregulated E2F transcription factor activity occurs in the vast majority of human tumors and has been solidly implicated in disturbances of cell cycle control, proliferation, and apoptosis. Aberrant E2F regulatory activity is often caused by impairment of control through pRB function, but little is known about the interplay of other oncoproteins with E2F. Here we show that ETS transcription factor fusions resulting from disease driving rearrangements in Ewing sarcoma (ES) and prostate cancer (PC) are one such class of oncoproteins. We performed an integrative study of genome-wide DNA-binding and transcription data in EWSR1/FLI1 expressing ES and TMPRSS2/ERG containing PC cells. Supported by promoter activity and mutation analyses, we demonstrate that a large fraction of E2F3 target genes are synergistically coregulated by these aberrant ETS proteins. We propose that the oncogenic effect of ETS fusion oncoproteins is in part mediated by the disruptive effect of the E2F–ETS interaction on cell cycle control. Additionally, a detailed analysis of the regulatory targets of the characteristic EWSR1/FLI1 fusion in ES identifies two functionally distinct gene sets. While synergistic regulation in concert with E2F in the promoter of target genes has a generally activating effect, EWSR1/FLI1 binding independent of E2F3 is predominantly associated with repressed differentiation genes. Thus, EWSR1/FLI1 appears to promote oncogenesis by simultaneously promoting cell proliferation and perturbing differentiation.
E2F transcription factors are known to play a pivotal role in cancer by orchestrating tumor cell proliferation downstream from the retinoblastoma tumor suppressor. Different E2F family members promote or suppress oncogenesis in a tissue- and tumor-dependent manner (Chen et al. 2009). Little is known about the interplay of tumor-specific oncoproteins with E2F transcription factors and their impact on the biology of cancer. We have previously observed selective enrichment of E2F binding motifs in genes activated by the chimeric oncoprotein EWSR1/FLI1 in ES (Kauer et al. 2009). The present study was designed to investigate the EWSR1/FLI1 interaction with E2F using ChIP-seq and to define its functional implications.
Ewing sarcomas (ES) are bone and soft-tissue sarcomas characterized by EWSR1 gene (also known as EWS) rearrangements with an ETS family oncogene, predominantly FLI1 (Delattre et al. 1992), as the major drivers of ES pathogenesis (for review see Kovar 2010). The EWSR1/FLI1 fusion protein binds to a canonical ETS binding motif with the 5′-GGAA/T-3′ core (Mao et al. 1994), even at a distance of several megabases from the closest gene, and in (GGAA)n microsatellites (Gangwal and Lessnick 2008; Guillon et al. 2009).
While EWSR1/FLI1 was demonstrated to be co-expressed with other ETS proteins in ES (Kovar et al. 1996), there is a high degree of sequence specificity among individual ETS family members. The molecular basis for EWSR1/FLI1 target specificity is unknown but is suspected to result from cooperative DNA binding (Li et al. 2000). ETS family proteins bind to DNA as monomers or as homo- or heterodimers with other transcription factors. Proteins previously demonstrated to participate in cooperative DNA binding complexes with FLI1 on specific genes include SRF, GATA1, SP1, and PAX5 (Watson et al. 1997; Shirasaki et al. 1999; Holmes and Antti 2002; Maier et al. 2003).
In our earlier study (Kauer et al. 2009), shRNA-induced knockdown of EWSR1/FLI1 was used to define an EWSR1/FLI1 transcriptional signature in ES compared with mesenchymal stem cells (MSC), the most closely related normal tissue cell type (Tirode et al. 2007). Consistent with other reports (Prieur et al. 2004; Hancock and Lessnick 2008), we found that EWSR1/FLI1 activates and represses similar numbers of genes in ES. A striking finding of our study was a significant enrichment of E2F binding motifs upstream of EWSR1/FLI1-activated genes, suggesting that members of the E2F family of transcription factors may generally contribute to aberrant gene activation by EWSR1/FLI1 (Kauer et al. 2009).
Here, we focused on E2F3 among activating E2F family members for proof of principle. While several E2F family members are present in ES cell lines, E2F3 is differentially expressed in primary ES versus mesenchymal stem cells, the most closely ES-related normal tissue (Kauer et al. 2009), where it represents the most consistently EWSR1/FLI1-induced E2F (Supplemental Table S1; Riggi et al. 2010). We report that proximal promoters of EWSR1/FLI1-activated genes, mainly involved in proliferation control, DNA repair, and RNA metabolism, synergistically recruit EWSR1/FLI1 and E2F3. In contrast, E2F3 binding was very low in distant EWSR1/FLI1 binding regions, which mapped predominantly to EWSR1/FLI1-repressed genes, mainly involved in cell differentiation. A broad relevance of the ETS/E2F3 interaction is demonstrated by observing a significant colocalization of E2F3 with the TMPRSS2/ERG fusion in prostate cancer. Our study establishes the critical role of E2F3 in the regulation of genes activated by EWSR1/FLI1 and TMPRSS2/ERG.
Results
Colocalization implicates E2F3 and EWSR1/FLI1 as transcriptional coregulators
Chromatin immunoprecipitation followed by DNA sequence analysis (ChIP-seq) was performed with antibodies specific for EWSR1/FLI1 and E2F3 in A673 ES cell lines. It should be noted that the EWSR1/FLI1 antibody also recognizes wild-type FLI1, which is, however, not expressed in ES cell lines (Kovar et al. 1996). Short read sequencing generated 27 million EWSR1/FLI1 high-quality sequence tags, which uniquely aligned to the human genome, and 12.5 million E2F3 tags (for detailed read statistics, see Supplemental Table S2). In addition, non-selected input DNA (13.5 million aligned tags) was sequenced in order to compensate (Landt et al. 2012) for potential local bias in tag density (Supplemental Fig. S1A). Individual ChIP-seq results are described in detail in the Supplemental Material.
An analysis of tag densities identified 16,386 EWSR1/FLI1 and 4303 E2F3 discrete binding regions with significantly (up to 100-fold) increased read densities (Fig. 1A,B; Supplemental Fig. S1B; Supplemental Table S3). Both EWSR1/FLI1 and E2F3 binding regions demonstrated a very high level of conservation in a 44-way vertebrate comparison (Fig. 1C). Based on a “closest gene” heuristic associating each binding region to the closest gene regardless of distance, 3825 and 8398 unique gene identifiers were associated with E2F3 and EWSR1/FLI1 binding, respectively. Adjacent to specific genes, EWSR1/FLI1 showed a tendency for clustering (Supplemental Fig. S1C). As an example, 15 binding sites of EWSR1/FLI1 are found in a 910-kb region surrounding the gene DLGAP1 (Supplemental Fig. S1D). In a region of that size, only 0.5 binding events are expected assuming a flat distribution.
Figure 1.

Characterization of DNA binding regions. (A) ChIP-seq tag density plot for EWSR1/FLI1 and E2F3: Regions of significantly increased tag densities typically occur as clusters in relatively small, focal regions, with little or no signal between clusters. In an ∼130-kb genomic region (upper plot), increased densities are almost exclusively observed in the immediate vicinity (lower plot) of ID2, a known regulatory target of ETS factors. Both E2F3 as well as EWSR1/FLI1 demonstrate partially overlapping regions of increased tag densities. (B) Increased binding close to transcription start sites: relative number of reads covering regions centered at transcription start sites. Shown is the tag density averaged over all RefSeq annotated transcription start sites normalized to one at a large distance for EWSR1/FLI1 and E2F3 chromatin immunoprecipitations. (C) High conservation of binding regions: fraction of binding regions (abscissa) with a maximal conservation smaller or equal to the value on the ordinate. More than 90% of the E2F3 binding regions had a maximum conservation score >0.5, and in 75% conservation reached the maximum value of one. EWSR1/FLI1 binding regions, too, show a high degree of conservation, regardless of whether they are located within proximal promoter regions or in distal regions. As a reference, the random curve estimates the behavior of unselected regions in the genome. (D,E) Gene compartments. (D) Distribution of binding events with respect to RefSeq gene annotations: In comparison to E2F3, a significantly larger proportion of EWSR1/FLI1 binding occurs in intergenic (>4k from closest gene) and intronic regions. (E) Enrichment of binding events in gene compartments estimated by comparison to randomized binding demonstrates a very strong promoter bias for E2F3 binding, and to a somewhat lesser extent, EWSR1/FLI1. The latter is in part explained by colocalization of both factors. EWSR1/FLI1 binding regions not overlapping with E2F3 demonstrate only weak promoter bias.
Strikingly, >50% (2188) of the E2F3 binding regions overlapped with those of EWSR1/FLI1, ∼50× more frequent than expected by chance in a theoretical flat genomic background. This high proportion of transcription factor colocalization is maintained when focusing on the subset of E2F3 binding genes that change in expression more than twofold (logFC > 1) in response to shRNA-mediated E2F3 knockdown (20% of all E2F3 knockdown-responsive genes) (data not shown). Individually, E2F3 as well as EWSR1/FLI1 had a substantial bias toward binding within promoter regions (Fig. 1D,E): E2F3 and EWSR1/FLI1 binding regions were 50-fold (1419 of 4304) and 18-fold (2775 of 16,383 regions) more likely to be located within 1 kb upstream of transcription start sites compared with randomly selected 1-kb regions. However, independent selectivity of EWSR1/FLI1 and E2F3 for promoter binding is not sufficient to explain the observed high frequency of colocalization, which remained sixfold increased (P < 0.0001) over randomized “average” promoter regions.
The preferential binding of E2F3 and EWSR1/FLI1 close to transcription start sites suggests that both factors act as proximal gene regulators. Yet, 82% (13,499) of the EWSR1/FLI1 binding events occurred in distal regions, defined here as being outside of a −4 kb to +300 bp domain around transcription start sites. The high level of evolutionary conservation in these distant binding regions (Fig. 1C) suggests that they, too, are subject to selective pressure and therefore most likely function as distal regulatory elements (DREs). In contrast to proximal EWSR1/FLI1 bound regions (colocalization of 942 out of 2877 proximal regions, 33%), colocalization with E2F3 in distal EWSR1/FLI1-targeted sites was substantially reduced to only 9% (1250) of the 13,499 distal EWSR1/FLI1 binding regions, indicating that the presumed EWSR1/FLI1 DRE activity is mostly independent of E2F3.
Patterns of gene regulation associated with distinct patterns of EWSR1/FLI1 and E2F3 genomic binding
To determine the functional consequences of isolated EWSR1/FLI1 enhancer binding and combined EWSR1/FLI1-E2F3 promoter binding patterns, we measured temporal changes in gene expression after inducible EWSR1/FLI1 knockdown in A673 cells. The resulting gene expression changes were correlated with EWSR1/FLI1 and/or E2F3 bound sites. It is reasonable to assume that the initial response pattern of the vast majority of direct gene targets to changes in EWSR1/FLI1 protein levels is rapid and follows dominant patterns. Principal component analysis (PCA) was used to identify such patterns in expression changes. Three dominant kinetic patterns (PCA-1, PCA-2, PCA-3) (Fig. 2A) were identified where expression changes of a gene may be either correlated or anti-correlated with each of the patterns (Fig. 2B). The dominant pattern, PCA1, involves an immediate down-regulation (PCA1+) or up-regulation (PCA1−). The second component, PCA2, exhibited a minimum (PCA2+) or maximum (PCA2−) at 36 h after EWSR1/FLI1 knockdown, while the third, non-zero pattern (PCA3+,−) essentially oscillated around the zero line.
Figure 2.

Transcription factor binding and gene expression changes in response to shRNA-induced knockdown of EWSR1/FLI1. (A) The first four principal components of the knockdown-induced expression changes. Each component represents one coherent, dominant pattern of expression changes. Only the first three components show a significant nonzero signal; thus, only these three components were used in the subsequent analysis. (B) Heatmap of expression level changes of genes significantly (r > 0.8) correlated (+) and anti-correlated (−) with principal components 1 and 2. Due to their relatively low number, genes correlated with PCA3 are not visible in this diagram. (C) Compared with a flat background model, E2F3 and EWSR1/FLI1 binding regions are enriched adjacent to genes with expression changes correlated to the two largest principal components. Both factors overlap, and this association is generally stronger, with the notable exception of PCA1−: Colocalization of both factors is underrepresented among genes rapidly up-regulated in response to EWSR1/FLI1 knockdown. Also, EWSR1/FLI1 binding in distal regions is underrepresented in the group of responders following PCA1+.
EWSR1/FLI1 binding correlated best with PCA1 (3198 genes) and PCA2 (548 genes), while only 37 genes associated with PCA3 (|r| > 0.8) (for a list of associated genes and Gene Ontology terms, respectively, see Supplemental Tables S4 and S5). Strikingly, significant co-enrichment for E2F3 binding was observed in the vicinity of genes following PCA1/PCA2 kinetic patterns (Fig. 2C). Although EWSR1/FLI1 bound regions were enriched in the three dominant principal components, the strongest signal for E2F3 occurred in PCA1+, representing early EWSR1/FLI1-activated genes. No enrichment of E2F3, and even a slight underrepresentation of colocalized EWSR1/FLI1-E2F3 binding, was seen in the group of genes responding with early repression (PCA1−), supporting the interpretation that EWSR1/FLI1-E2F3 colocalization defines a subset of genes positively regulated by these proteins.
In our earlier gene expression study (Kauer et al. 2009), the EWSR1/FLI1 knockdown response at 96 h after shRNA transfection in a panel of five ES cell lines was compared with the differences in gene expression between ES tumors and MSC, the cell type thought to be the most likely progenitor of ES (Tirado et al. 2006; Kauer et al. 2009; Riggi et al. 2010). Comparison of the EWSR1/FLI1 signature gene sets identified in that study with the transcription factor/DNA interaction map developed here identified a strong correlation (P < 10−4) between binding and gene expression. Approximately 60% (843) and 30% (459) of 1417 knockdown responsive genes were associated with EWSR1/FLI1 and/or E2F3 binding, respectively. Similarly, 58% (1145) and 28% (561) of 1986 genes differentially expressed between ES and MSC were associated with EWSR1/FLI1 and E2F3 binding, respectively.
When focusing on up- and down-regulated genes separately, a more nuanced picture emerged. As predicted by our previous study (Kauer et al. 2009), the 819 genes up-regulated by EWSR1/FLI1 were significantly associated with both E2F3 binding (P < 10−4; n = 328) and EWSR1/FLI1 binding (P < 10−4; n = 469). E2F3 binding remained predictive for up-regulation even in the absence of EWSR1/FLI1 colocalization (P < 10−4; n = 150), while isolated, non-colocalized EWSR1/FLI1 binding was not predictive (P > 0.6; n = 287) in this group. However, that pattern was reversed for the 509 genes down-regulated by EWSR1/FLI1: E2F3 binding was not (P > 0.3; n = 131) associated, but EWSR1/FLI1 binding was highly significant (P < 10−4; n = 374). Importantly, in that down-regulated group, most of the association was mediated by distal binding. When exclusive distal binding was considered (i.e., genes without proximal E2F3 and/or EWSR1/FLI1 binding within −4 kb to +300 bp of the transcription start site), EWSR1/FLI1 binding remained highly significantly associated with gene repression (P < 10−4; n = 257).
Spatial occupation frequencies of transcription factor recognition motifs suggest synergistic binding of EWSR1/FLI1 and E2F3
In accord with the observed colocalization in the ChIP-seq data, an in silico analysis of transcription factor site recognition matrices (Quandt et al. 1995) revealed a very strong cross-enrichment of E2F and ETS motifs (Fig. 3; Supplemental Fig. S2a; Supplemental Table S6). As expected, recognition matrices for ETS (V$CETSP54_03 and V$ELK1_02: 2851 and 2234 occurrences) and E2F (V$E2F_Q2: 3352 occurrences) motifs predominated in EWSR1/FLI1 and E2F binding regions. In addition, E2F motifs (V$E2F_Q3) were 36-fold overrepresented within EWSR1/FLI1 binding regions (Fig. 3A), and ETS motifs (e.g., V$ELK1_02) were 60-fold overrepresented within E2F3 binding regions (Fig. 3B). This cross-enrichment of recognition motifs could either be indicative for synergistic binding or it might reflect independent regulation of a common set of target genes. In the latter case, the effective binding affinity of either factor (E2F3 or FLI1) in promoters should be independent from the presence of the other factor's recognition motif. To determine which of the two models applies, we counted the number of detectable binding events to promoters with either none, both, or individual recognition motifs. Remarkably, the simultaneous presence of both motifs almost doubled the probability of observing E2F3 binding compared with promoters containing an E2F recognition motif alone (Fig. 3C), clearly favoring synergistic binding.
Figure 3.

In silico analysis of binding regions. (A,B) Overrepresented transcription factor recognition sequences within binding regions of EWSR1/FLI1 and E2F3, respectively. The set of motifs shown in B has been selected in order to reduce redundancies between similar motifs. A complete list can be found in the Supplemental Material (Supplemental Table S3). (C) Binding frequency is correlated with the presence of ETS and E2F binding motifs in the promoter DNA sequence: Shown is the frequency of binding events of E2F3, EWSR1/FLI1, or both factors simultaneously (i.e., the average number of binding events per promoter). In this analysis promoters were subdivided into four groups, containing either E2F or ETS, neither, or both motifs. The group containing none of the two motifs was used for normalization, setting the frequency to one. Expanding the analysis to include the relative organization of ETS and E2F motifs in regions containing both motifs, it becomes apparent (D) that the effective binding affinity depends on that organization. The number of experimentally observed binding events (y-axis) overlapping any given ETS motif in the genome depends on the oriented distance (x-axis) from that ETS motif to the next E2F motif. (E) Specific spatial arrangements of ETS and E2F recognition sites are overrepresented in E2F3 and EWSR1/FLI binding regions. The plot displays the frequency of spatial configurations of ETS and E2F motifs within ChIP-seq binding regions of EWSR1/FLI1 and E2F3. Besides a global maximum at close distances, as expected in promoter regions with an overall increase of recognition sequences, discrete regions of increased frequency of pairs of E2F and ETS factors are visible. As a reference, scales for lengths 80 bp (length of one internucleosomal linker) and 146 bp (length of nucleosomal DNA) are also displayed in the graph. The frequency measurements depicted in D and E can best be interpreted as conditional probabilities, where D shows the probability to observe binding given that there is a specific geometric organization of the binding sites, while E shows the probability of finding a specific geometry, given that there is a binding event. Even though these two observations are related by Bayes' theorem, they are mutually independent, as discussed in detail in the Supplemental Material.
It is reasonable to hypothesize that this synergy is most effective in certain spatial configurations that may enhance accessibility to the DNA and/or facilitate protein interactions. Extending the analysis of Figure 3C to include dependence on oriented distances between transcription factor recognition motifs revealed that close proximity of E2F and ETS motifs generally increases the probability of observing E2F3 and EWSR1/FLI1 binding. However, at distinct distances, additional local maxima were observed, where binding probabilities were remarkably increased (Fig. 3D). Because the presence of these maxima suggests evolutionary selection, we investigated further for evidence of specific recognition site configurations overrepresented within sequences actually bound by EWSR1/FLI1 and E2F3. We found that in addition to a colocalization signature of ETS and E2F motifs indicated by an overall “volcano”-like graph, substructures with local maxima emerge in Figure 3E (see also Supplemental Methods and Supplemental Fig. S2B). The distances between these maxima are strikingly similar to length scales associated with the nucleosomal architecture of the chromatin: The characteristic length of linker DNA (∼80 bp) coincides with the location and/or distance between local maxima. Also, the increased likelihood of an E2F motif at 225 bp downstream from the ETS anchor resembles almost precisely 80 + 146, a linker length plus the length of DNA wound around a nucleosome.
Functional evidence for EWSR1/FLI1 cooperativity with E2F3 on activated gene promoters
The analysis so far indicated preferential colocalization of EWSR1/FLI1 and E2F3 on proximal promoters of activated genes, but the regulatory activity of both factors in vitro remained to be shown. Therefore, promoter fragments of 10 randomly selected genes with proximal EWSR1/FLI1 and E2F3 binding regions were tested for EWSR1/FLI1- and E2F3-dependent activity by firefly luciferase reporter assays in A673 cells. All 10 constructs demonstrated a significant twofold to threefold reduction of the reporter activity 48 h after conditional EWSR1/FLI1 knockdown, while the promoter of an expressed gene without any EWSR1/FLI1 or E2F3 ChIP-seq signal (PRKCI) and the empty vector control did not respond to EWSR1/FLI1 modulation (Fig. 4A). In contrast, the amplitude of the E2F3 knockdown effect on reporter activity was less pronounced and more variable. A statistically significant decrease in activity was observed in only six of the 10 selected genes (Fig. 4A). These results suggest that binding of EWSR1/FLI1 but not E2F3 is rate limiting for promoter activity.
Figure 4.

Promoter binding and activity of genomic EWSR1/FLI1 and E2F3 binding regions. (A) Firefly luciferase reporter assays for 10 arbitrarily chosen genes identified by ChIP-seq as EWSR1/FLI1 and E2F3 target genes. Promoter fragments (CDK2: −122/+458; E2F3: −272/+327; RAD51: −186/+164; VRK1: −269/+100; RFC2: −400/+25; ATAD2: −368/+202; RRM2: −463/+191; GEMIN4: −275/+87; MFLI1P: −251/+70; SKP2: −240/348) were cloned into the pGL4.10 vector (Promega) and tested for responsiveness to conditional EWSR1/FLI1 knockdown in A673 ES cells 48 h after doxycycline-induced EWSR1/FLI1 shRNA induction (dark green) or shRNA-induced knockdown of E2F3 (red). As negative controls, promoter activities of an expressed gene that does not show a change in mRNA expression after the EWSR1/FLI1 knockdown (PRKCI: −139/265), and of the empty vector (pGL4.10) are shown. The y-axis represents the promoter activity relative to control conditions. Means and standard deviations of at least three independent experiments, each performed in triplicate, are shown. (B) Fold changes in reporter activity of wild-type and mutant ATAD2 reporter constructs in the presence (light green) and doxycycline-induced absence (dark green) of EWSR1/FLI1 48 h after EWSR1/FLI1 shRNA induction. See Supplemental Figure S3 for ChIP and luciferase assays.
The contribution of E2F and ETS motifs to the EWSR1/FLI1-dependent promoter activity of three genes—GEMIN4, E2F3, and ATAD2—was subsequently tested by a site-directed mutagenesis strategy. First, the regions of direct EWSR1/FLI1 and E2F3 binding were validated for these three representative target genes by ChIP-PCR assays in two additional EWSR1/FLI1-expressing embryonic stem (ES) cell lines (Supplemental Fig. S3, TC71 and TC252), and in A673 cells before and after conditional knockdown of EWSR1/FLI1 (Supplemental Fig. S4A–F). After ChIP with either FLI1-specific (Supplemental Fig. S4A–C) or E2F3-specific (Supplemental Fig. S4D–F) antibodies, promoter regions covering predicted ETS and E2F binding motifs, and, for control, of flanking upstream regions were PCR-amplified. In each case, signals were obtained exclusively in the regions of predicted EWSR1/FLI1 and E2F3 binding and were stronger in the presence (+) than after silencing (−) of EWSR1/FLI1. As exemplified for ATAD2 (Fig. 4B) and E2F3 and GEMIN4 (Supplemental Fig. S4G,H), the EWSR1/FLI1 response of the selected promoter fragments in luciferase reporter assays was significantly reduced if either one of the core sequences for EWSR1/FLI1 or E2F3 binding was disrupted. For ATAD2, individual mutation of either the single ETS core motif at position +33 or a highly conserved E2F site at −267 (distance corresponding to approximately one nucleosome and two linkers) reduced the response by ∼50%, while perturbation of a second E2F core motif at +14 lowered the intensity only by ∼25%. In all single mutation instances, the promoter fragments retained their responsiveness to EWSR1/FLI1 knockdown. In contrast, the triple mutation disrupting ETS and E2F sites together lowered promoter activity in the presence of EWSR1/FLI1 to a level similar to that observed after EWSR1/FLI1 knockdown in the wild-type construct, thus rendering the ATAD2 promoter completely unresponsive to EWSR1/FLI1 modulation. This result suggests that both ETS and E2F motifs contribute to ATAD2 promoter regulation by EWSR1/FLI1. Of note, as shown in Figure 4A and verified in gene expression analyses (not shown), E2F3 is among the genes directly activated by EWSR1/FLI1. Thus, EWSR1/FLI1-dependent regulation of the ATAD2 gene promoter in the absence of a functional ETS binding site can be explained by E2F3 binding, and vice versa, in the absence of a functional E2F binding motif by binding of EWSR1/FLI1. EWSR1/FLI1 depletion reduces E2F3 expression and, therefore, leads to a stronger reduction in promoter activity than discrete mutations of ETS and E2F sites. These data support a functional interaction of EWSR1/FLI1 and E2F factors on promoters bound by EWSR1/FLI1 and E2F3 including that of E2F3 itself.
Distinct biological processes associate with promoter-type EWSR1/FLI1-E2F modules and E2F3-independent EWSR1/FLI1 binding patterns
Gene Ontology (GO) analysis of the genes associated with EWSR1/FLI1 binding revealed that overrepresented processes were in general related to translation (GO:0006412, 1.6-fold), ribonucleoprotein complex biogenesis (GO:0022613, 1.6-fold), cell cycle (GO:0007049, 1.2-fold), response to DNA damage stimulus (GO:0006974, 1.3-fold), and RNA processing (1.4-fold). Consistent with the well-established role of E2F factors in proliferation control, the most enriched GO terms for targets of E2F3 binding were DNA replication (GO:0006260, 2.4-fold enriched), response to DNA damage stimulus (GO:0006974, twofold), cell cycle (GO:0007049, 1.7-fold), RNA processing (GO:0006397, 1.7-fold), and RNA splicing (GO:0008380, 1.9-fold). Among these E2F3 targets, simultaneous EWSR1/FLI1 binding selected for ribonucleoprotein complex (GO:0030529, 1.5-fold), RNA processing (GO:0006396, 1.4-fold), and RNA splicing (GO:0008380, 1.4-fold), suggesting that EWSR1/FLI1 cooperates with E2F3 at promoters of genes regulating post-transcriptional gene expression in addition to those with proliferation-associated functions. In striking contrast, genes that we found targeted by EWSR1/FLI1 most frequently at nonpromoter sites without simultaneous E2F3 binding and predominantly repressed by EWSR1/FLI1 were annotated by distinct GO terms signal transduction, differentiation, and terms closely related to the still disputed histogenesis of ES. These include “positive regulation of bone remodeling” (GO:0046852, 1.3-fold), “mesenchymal cell differentiation” (GO:0048762, 1.4-fold), and “nervous system development” (GO:0007399, 1.4-fold) (Table 1; Supplemental Table S7). As another example, the KEGG (Kyoto Encyclopedia of Genes and Genomes) pathway “Axon Guidance” is highly significantly overrepresented among putative targets of distal EWSR1/FLI1 regulation (Supplemental Fig. S5).
Table 1.
Selected significantly enriched Gene Ontology terms for genes with adjacent binding events for E2F3 and EWSR1/FLI1
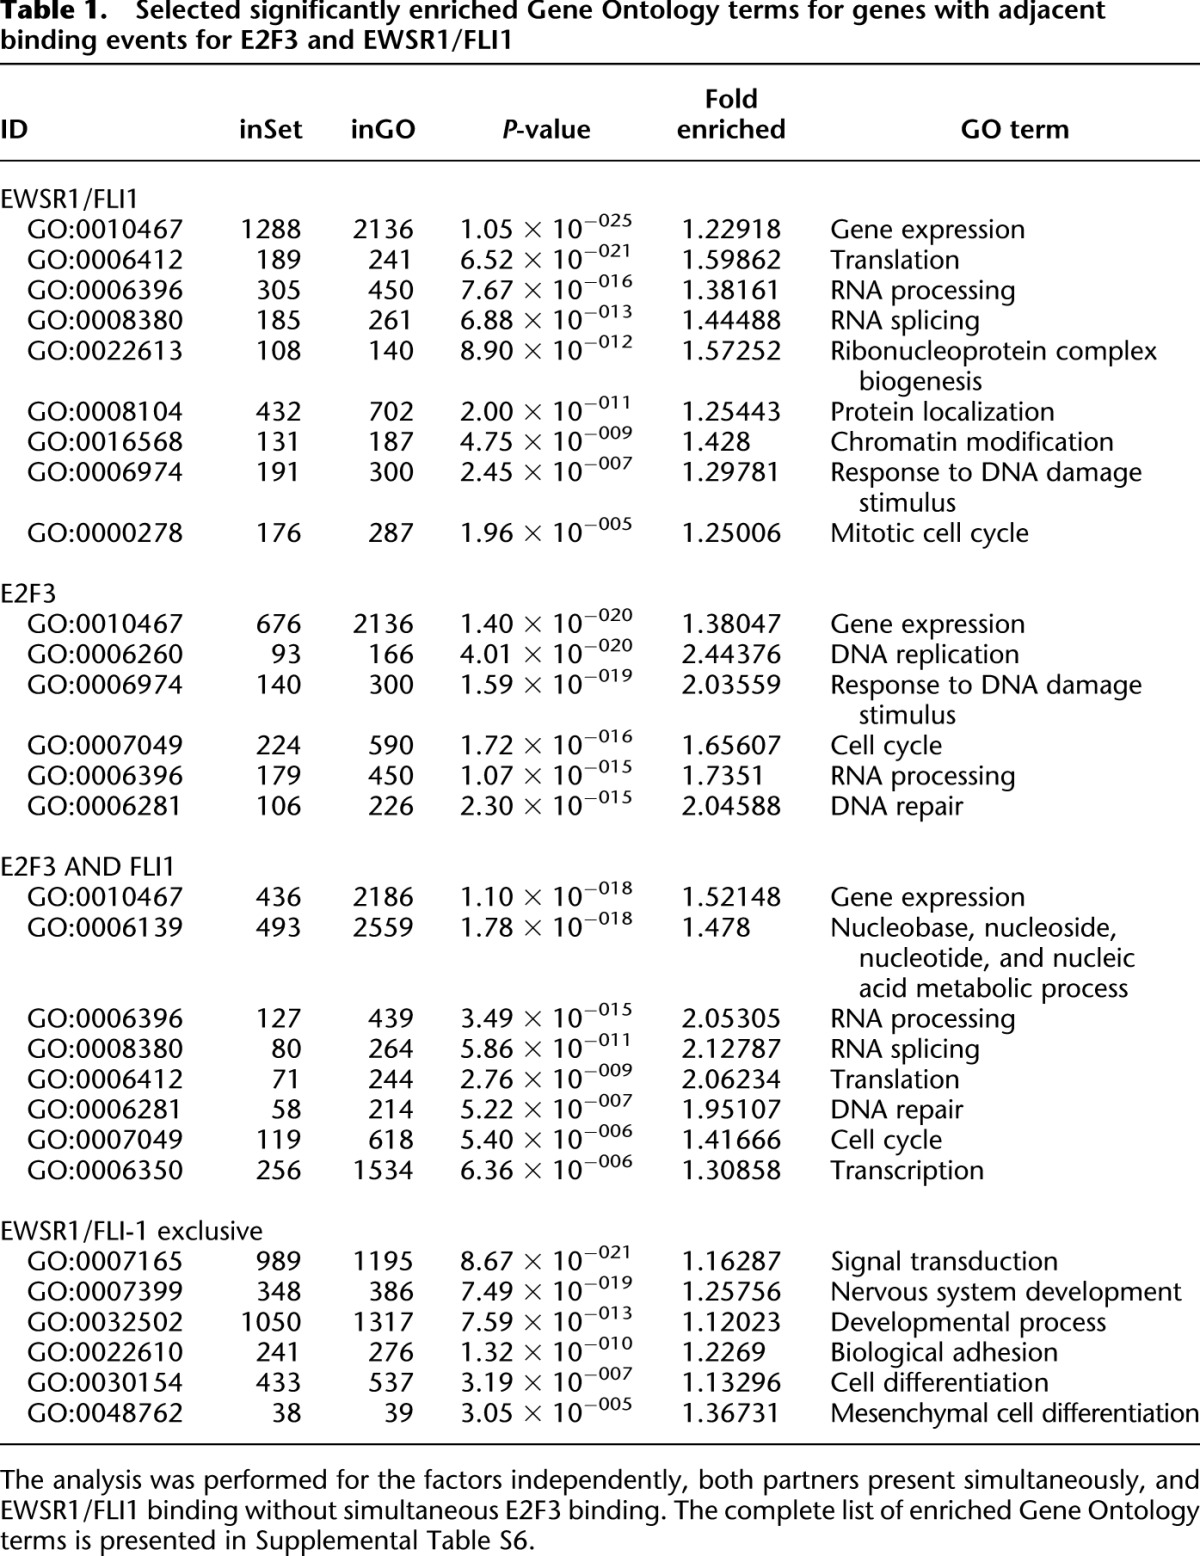
Together, these results demonstrate that EWSR1/FLI1 regulates distinct sets of target genes by two mechanisms: (1) inhibition of differentiation-associated genes by E2F3-independent EWSR1/FLI1 binding occurring mainly outside of promoters, and (2) stimulation of genes associated with proliferation and RNA processing by the cooperative action of EWSR1/FLI1 and at least E2F3 at their proximal promoters. The resulting simultaneous suppression of differentiation and proliferative drive is a key property of malignant transformation by the chimeric EWSR1/FLI1 transcription factor.
Comparative analysis reveals a shared ETS–E2F transcriptional module in Ewing sarcoma and prostate cancer
Fusion genes involving ETS transcription factors also play a role in other types of cancer. Recently, ERG, ETV1, and ETV4, which are also known as alternative ETS fusion partners for EWSR1 in ES, have been found to be overexpressed due to rearrangement with TMPRSS2 in a majority of prostate cancers (Clark and Cooper 2009). To determine whether the ETS–E2F module might also be active in prostate cancer, we performed additional ChIP-seq E2F3 localization experiments in prostate cancer cells (VCaP) and integrated recently reported localization data for ERG in non-FLI1-expressing (Rahim et al. 2011) VCaP- and ERG-overexpressing prostate epithelial cells (RWPE) into the analysis. Interestingly, binding patterns remained rather similar across cell types. More than 50% of the 1696 E2F3 binding sites in VCaP were also occupied in A673 cells. Of the EWSR1/FLI1 binding regions, almost 40% were bound by ERG in VCaP and 20% in RWPE cells. This finding is rather remarkable because it not only involves different members of the ETS family, but also different tumor types, suggesting that aspects of the activity of the respective fusion oncogenes may be mediated by a common mechanism.
Analysis of the sequences in ERG binding regions (Supplemental Material; Supplemental Fig. S6A,B; Supplemental Table S6) found a composition of binding motifs very similar to that found for EWSR1/FLI1, including a very strong enrichment of E2F motifs, with a geometrical organization (Supplemental Fig. S6C) almost identical to that found for EWSR1/FLI1 binding regions in ES. Colocalization of E2F3/ERG was more than 39-fold enriched (Fig. 5A): Of the 1696 E2F3 binding regions, >85% (858) overlapped with TMPRSS2/ERG binding sites. Interestingly, ETS binding regions shared across cancer types, those bound by TMPRSS2/ERG in VCaP and by EWSR1/FLI1 in A673 cells (see Supplemental Table S8), had an even stronger colocalization signature with enrichment increased by a factor of 5 to 209-fold. These results strongly suggest that E2F3 colocalization is a defining characteristic of ETS targets in both cancers. Of note, these shared targets retain the strong signature of cell cycle–related functions identified in A673 cells (for GO enrichment analysis, see Supplemental Table S7).
Figure 5.

Comparison of ETS factor binding and transcriptional regulation in prostate and ES cells. (A) ERG binding in RWPE and VCaP prostate cells occurs preferentially in regions bound by E2F3 in A673. Shown is the enrichment of ERG or TMPRSS2/ERG binding events in proximity to E2F3 binding regions calculated by comparison to a flat, random background model. Enrichment is even stronger for the component of ERG binding that overlaps that of EWSR1/FLI-1 in A673. (B) The occupancy by E2F3 in the promoter of E2F3 and GEMIN4 is significantly reduced in the models for ES (A673) and prostate cancer (VCaP) for promoters with a mutated ETS recognition site in comparison to wild-type sequence. In HeLa cells, mutation of the ETS recognition site does not significantly change E2F3 binding. (C) Enrichment of ETS fusion and E2F3 binding in proximity to genes positively regulated by the fusions in their respective cells (right half) and for binding events shared across A673 and VCaP cells (left). Shown is the enrichment of such genes positively regulated by ETS in VCaP (yellow), A673 (orange), or in the set of genes responsive in both cell types (blue). (D) Read densities in the promoter region of a representative ETS responsive cell cycle gene RFC4 illustrating similarity of overlapping binding by TMPRSS2/ERG and EWSR1/FLI1 with E2F3 in VCaP and A673 cells. See Supplemental Figure S5 for transcription factor motif analysis.
To test if ETS binding directly affects E2F3 recruitment to their shared target gene promoters or vice versa, we assessed E2F3 occupancy of wild-type and ETS binding site–mutated promoters (Fig. 5B; Supplemental Fig. S7A), and EWSR1/FLI1 occupancy of wild-type and E2F site–mutated promoters (Supplemental Fig. S7B) on transfected constructs of EWSR1/FLI1 target genes by chromatin immunoprecipitation. Prohibition of ETS factor binding to the E2F3 promoter by mutation of the conserved ETS binding sites at −7 and +207 led to a significant decrease of E2F3 binding in both A673 and VCaP cells, but not in HeLa cells used as an EWSR1/FLI1 and TMPRSS2/ERG negative control. A similar result was obtained for the binding of E2F3 to the GEMIN4 promoter when the two ETS binding motifs at −176 and −92 were disrupted (Fig. 5B). This suggests that EWSR1/FLI1 or TMPRSS2/ERG binding is necessary for the recruitment of E2F3 at these sites in both cell types. In contrast, mutation of the E2F binding site in ATAD2 and GEMIN4 promoters did not significantly affect EWSR1/FLI1 binding (Supplemental Fig. S7B).
To test the impact of the ETS/E2F3 complex on regulatory activity across cancer types, we integrated gene expression data from a TMPRSS2/ERG knockdown experiment in VCaP (Gupta et al. 2010; Yu et al. 2010) into our analysis. The significant association between E2F3–ETS colocalization and an increase in gene expression levels persisted in VCaP cells (Fig. 5C). As was the case for ES, the association was most pronounced when E2F3 and the ETS binding regions overlapped. Intersecting the top 1000 probe sets positively regulated by TMPRSS2/ERG in VCaP with our set of genes positively regulated by EWSR1/FLI1 in ES, identified a highly significant overlap (P < 10−9) of 223 genes (Supplemental Material; Supplemental Table S9). Genes in this common set were most tightly associated with E2F3 and ETS binding events overlapping and present in both cancer types (left half of Fig. 5C). By integrating all available data, we identified a small set of 25 putative direct regulatory targets of EWSR1/FLI1 and ERG (Supplemental Table S9) defined as genes that were positively regulated by the respective ETS factor and had adjacent overlapping binding of E2F3 and ETS fusions in both cancers (one example, RFC4, is shown in Fig. 5D). Remarkably, almost half of the 25 genes identified in this way have been implicated in pathways relevant to cancer including DNA replication and repair (GMNN, RFC4, MCM5, XRCC1, UBE2C), cell proliferation (GGCT, TK1, PA2G4), and chromatin biology (SNRPG, H2AFX, HIST1H4C).
Discussion
This study is the first to unravel structurally and functionally distinct classes of genomic binding modules for a prototypic aberrant ETS transcription factor in human malignancies by a combination of ChIP-seq, dynamic transcriptome analysis, and in silico motif and function predictions. This approach identified two modes of activity for the chimeric EWSR1/FLI1 oncoprotein in ES (Fig. 6A): activation from proximal promoters in concert with E2F and repression from the fusion protein binding at sites without E2F interaction. Strikingly, the promoter-type activity of EWSR1/FLI1 was found to affect >50% of the target genes of E2F3. Colocalization of EWSR1/FLI1 and E2F3 on these promoters could not be explained by individual recruitment of the two transcription factors to promoters enriched in ETS and E2F recognition motifs, but rather co-occupation resulted from a functional interaction, which was confirmed in reporter gene assays and by ChIP using ETS and E2F site–mutated promoters, and which affected a specific subset of genes involved in proliferation and RNA metabolism. It is therefore intriguing to speculate that EWSR1/FLI1 actively recruits E2F3 to these genes. Of interest, E2F3 itself as well as other members of the E2F family were not only observed to be EWSR1/FLI1 binding targets, but also were among the immediate early EWSR1/FLI1-induced genes (data not shown).
Figure 6.

Genomic location and architecture of EWSR1/FLI1 binding regions determine mode of target gene regulation. Two modes of EWSR1/FLI1-driven gene regulation: (A) Binding of EWSR1/FLI1 to distal ETS motifs in the absence of E2F binding results predominantly in target gene repression, while proximal cooperative promoter binding of EWSR1/FLI1 and EWSR1/FLI1 activated E2F3 results in target gene activation. (B) Spatial arrangement of ETS and E2F binding motifs in regions bound by EWSR1/FLI1 and E2F3.
Thus, we propose a novel transcriptional network module in which the oncogenic EWSR1/FLI1 fusion protein supports a feed-forward loop leading to the activation of E2F target genes. Our in silico analysis of the genomic architecture of combined transcription factor binding (Fig. 3) together with the in vivo evidence for loss of EWSR1/FLI1-mediated regulation upon mutation of ETS and E2F recognition motifs (Fig. 4; Supplemental Fig. S4), and for loss of E2F3 binding upon mutation of ETS binding sites (Fig. 5B) strongly suggest that E2F3 and EWSR1/FLI1 cooperatively bind to promoter DNA. First, the probability of observing binding of either factor is maximized when recognition sequences for both factors are present simultaneously, with locally increased binding when motifs occurred at specific distances and relative orientation. Second, configurations of increased binding were also overrepresented in the sequence of regulatory targets of both, E2F3 and EWSR1/FLI1. These two lines of evidence complement each other, with the first resulting from transcription factor binding affinity, while the second observation of nonrandom spatial distribution of recognition motifs is indicative of selection during sequence evolution (see also the Supplemental Material). The distances between maxima at +226 and +306 bp for E2F motifs downstream from the ETS motif in Figure 3E coincide with the length of DNA associated with a single nucleosome plus one (or two) linker DNA sequence, suggesting that certain geometric constraints contribute to the selection of preferred configurations, similar to the example depicted in Figure 6B. Note that this does not imply a direct physical interaction or even that both factors are bound simultaneously. Instead, a form of nucleosome-mediated cooperativity (Mirny 2010) may drive synsegistic binding. This hypothesis is consistent with our inability to immunoprecipitate protein complexes containing E2F3 and EWSR1/FLI1 together (data not shown). Interestingly, Figure 3E indicates that regions bound by EWSR1/FLI1 prefer the configuration with the E2F motif closer to the ETS binding site, while regions bound by E2F use both configurations with similar frequency. Although our study focused on the functional interaction of chimeric ETS factors with E2F3 for proof of principle, the underlying evolutionarily selected genomic architecture of the transcriptional ETS–E2F module suggests that other ETS–E2F factor combinations may use it as well. E2F3 is not the only E2F expressed in ES and PC, and it is very likely that in these diseases EWSR1/FLI1 and TMPRSS2/ERG may also cooperate with other E2F family members. The fact that knockdown of E2F3 does not affect promoter activity to the same extent as EWSR1/FLI1 silencing (Fig. 4A) may be explained by functional redundancy among co-expressed E2F family members (Tsai et al. 2008).
In addition to ETS–E2F colocalization, a substantial number of other transcription factor recognition motifs were found co-enriched in proximal regions of EWSR1/FLI1 binding. Hierarchical motif clustering (Mahony et al. 2007) identified CREB, AP/SP, and E-box motifs. Transcription factors binding to some of those motifs have been previously implicated in E2F-mediated gene regulation, such as YY1 (52-fold enriched), which contributes to the specificity of E2F functions (Schlisio et al. 2002; Freedman et al. 2009), and recognition motifs (V$SP1_Q4_01, 97-fold; V$ZF5_01, 97-fold; and V$AP2_Q6, 15-fold), which have been implicated in the differential regulation of E2F target genes (De Bleser et al. 2007). This pattern indicates evolutionary selection for co-enriched ETS binding motifs with E2F and sites of cooperating and regulatory transcription factors in EWSR1/FLI1 bound regions. The ETS transcription factors that regulate this subset of E2F target genes during normal cellular development remain to be defined. One such candidate regulating E2F-dependent cell cycle genes has been previously identified as GABPA (Izumi et al. 2000; Joung et al. 2006; Yang et al. 2007). Our findings may therefore identify a subset of EWSR1/FLI1 bound genes as bona fide E2F target genes, which are dysregulated by EWSR1/FLI1 in ES.
Numerically, the proximal EWSR1/FLI1 binding patterns were by far outnumbered by distant EWSR1/FLI1 binding regions in which no particular transcription factor motif associations were enriched except for the presence of ETS recognition motifs [for a detailed discussion of the role of (GGAA)n microsatellites (Mao et al. 1994; Gangwal and Lessnick 2008) in distal EWSR1/FLI1 binding regions, see the Supplemental Material]. In a study comparing binding of epitope-tagged EWSR1/FLI1 in an ES cell line (EWSR1502) to FLI1, Patel et al. (2012) recently suggested that EWSR1/FLI1 directs chromatin remodeling at a proportion of distant sites. Interestingly, in our study, the predominant transcriptional behavior of genes associated with EWSR1/FLI1 without simultaneous E2F3 binding was found to be repression. These data suggest that isolated, distal EWSR1/FLI1 binding is often associated with a transcriptional silencer activity. The mechanism remains to be elucidated but may involve the NuRD complex, which was recently shown (Sankar et al. 2012) to mediate transcriptional repression by direct interaction with EWSR1/FLI1. In accord with our previous observation that EWSR1/FLI1-repressed genes are annotated preferentially as differentiation genes frequently devoid of ETS recognition motifs within their proximal promoter sequences (Kauer et al. 2009), we found that genes associated with mesenchymal differentiation, neuronal development, and bone remodeling are subject to regulation by isolated EWSR1/FLI1 silencer activity. This finding is well in line with the current view of an MSC origin of ES (Staege et al. 2004; Hu-Lieskovan et al. 2005; Tirode et al. 2007; Kauer et al. 2009) and explains the experimental observations that EWSR1/FLI1 abolishes the pluripotency of MSC (Riggi et al. 2005), and ES cells regain the ability to differentiate along neuronal and osteoblastic lineages upon sustained EWSR1/FLI1 suppression (Tirode et al. 2007).
EWSR1/FLI1 represented the first example of an oncogenic ETS transcription factor rearrangement in human solid tumors (Delattre et al. 1992), and there is ample functional evidence for its decisive role in malignant transformation and tumorigenesis (Kovar 2010). However, ∼10% of ES are characterized by alternative EWSR1 fusion partners from the ETS family (ERG, ETV1, ETV4, FEV), and the oncogenic role of EWSR1/ERG, the second most frequent ES gene fusion, has been demonstrated (Forster et al. 2005). The indistinguishable phenotype and clinical behavior of ES with EWSR1/FLI1 and those with alternative EWSR1/ETS fusions (Ginsberg et al. 1999) suggest a very similar target gene spectrum for the EWSR1/ETS gene fusions. Interestingly, our integrated analysis identified a shared set of ETS fusion gene binding sites in ES and prostate cancer, which exhibit colocalization with E2F3 in both tumor types. The importance of this result was strengthened by our demonstration of a significant overlap in the gene expression responses of these two systems to depletion of their respective ETS fusion oncoproteins. These observations suggest that the functional EWSR1/FLI1-E2F3 module in ES is shared to a significant extent between these diseases and that it may be in part responsible for the oncogenic activity of their respective ETS factors. This assumption is strengthened by our observation that mutation of the ETS binding site in promoters regulated by either EWSR1/FLI1 in A673 or ERG in VCaP results in decreased E2F3 occupancy. Thus, our findings in a pediatric bone tumor may also be of immediate relevance to one of the most frequent human cancers and suggest that an ETS–E2F transcriptional module may be a general feature of ETS driven cancers.
Methods
Chromatin immunoprecipitation and sequencing
Chromatin immunoprecipitation (ChIP) was performed using a ChIP-IT kit from Active Motif, following the manufacturer's instructions with minor modifications. Briefly, A673 cells were cross-linked with 1% formaldehyde for 15 min at room temperature. Then the cells were sheared with a VirSonic 100 sonicator for 20 cycles of 10 × 1-sec pulses. The chromatin was immunoprecipitated overnight at 4°C. The antibodies used were anti-FLI1 antibody (sc-356) and anti-E2F3 (sc-878) (Santa Cruz Biotechnology). A mixture of Protein-G and Protein-A agarose beads was used. After reversal of cross-linking overnight at 65°C, the ChIP DNA was purified using spin columns provided by the kit. For ChIP-seq, the ChIP DNA was prepared, amplified, and analyzed on an Illumina Genome Analyzer I, following the manufacturer's protocols.
Gene expression analysis
Cells
A clone of the ES cell line A673 with a stably transfected construct harboring a doxycycline-inducible shRNA against the EWSR1/FLI1 fusion protein (Tirado et al. 2006) kindly provided by Oscar Tirado was used for gene expression experiments.
Microarray analysis
RNA was extracted at five time points—0 h, 18 h, 36 h, 53 h, 72 h—and subjected to microarray analysis where 0 h marks the time point when doxycycline was added, and 18 h the time point when modulation of EWSR1/FLI1 protein was first observed as determined by immunoblot analysis. RNA was hybridized to Affymetrix GeneChip Human Genome U133A 2.0 Arrays. cRNA target synthesis and GeneChip processing were performed according to standard protocols (Affymetrix). Processing of CEL files, normalizing, and filtering were done in the R statistical environment using Bioconductor packages (Wu et al. 2004). Each time point was replicated at least twice.
Affymetrix CEL files were read into the R statistical environment and normalized using the “gcrma” algorithm (Wu et al. 2004). Probe sets with very low expression values across all samples (R package “panp”) were filtered out. Subsequently, probe sets associated with the same gene identifier were averaged and merged to one symbol, yielding 12,928 unique genes. Principal component analysis was performed using the GNU scientific library Singular Value Decomposition routines. Pearson correlation coefficients with |r| > 0.8 of comparing individual genes with the first three principal components were used to identify significantly correlated genes.
Sequence data analysis
Sequence reads were mapped to the human reference genome (NCBI36/hg18) using Illumina's extended ELAND alignment program. Reads starting at identical positions as well as low-quality reads with more than two deviations from the reference or an alignment score <25 were removed from the resulting data sets. Local read densities were then estimated by counting coverage of read events for each nucleotide in the genome, where the oriented reads were extended to the insert length (100 bp), which was size-selected during library preparation.
P-values were used to identify significantly increased read densities. They were estimated based on the cumulative Poisson distribution, where the local emission coefficient λ(x) was estimated from input (non-IP) data using the average read densities of windows centered around x of sizes 1 bp, 100 bp, 1000 bp, respectively. Of those, the most conservative (largest) estimate max λi(x) was used in order to minimize the false discovery rate. Discrete enriched regions were identified using the following heuristic: a continuous stretch of DNA was called significantly enriched if the following conditions were met simultaneously: P < 10−9 anywhere within that region, and P ≤ 10−6 everywhere else. Subsequently, distinct significant regions were merged into a single region if they were less than one-half fragment size (50 bp) apart. Finally, regions determined in this way smaller than the median fragment length (100 bp) were rejected.
The discrete regions of enrichment were analyzed for conservation by reporting the maximum phastCons score (vertebrate, 44-way conservation scores downloaded from UCSC; http://www.genome.ucsc.edu) within the discrete regions of enriched read density.
Identification of putative EWSR1/FLI1, E2F3 regulatory target genes
Putative regulatory targets of EWSR1/FLI1 and E2F3 binding were identified based on the closest gene heuristic; this is, for each binding site, the closest RefSeq transcript with a unique Entrez gene identifier. In cases where multiple RefSeq transcripts mapped to the same Entrez gene identifier, the longest transcript was selected. Gene Ontology analysis of the genes was made with custom in-house software. Pathway analysis was done using DAVID (Dennis et al. 2003).
DNA motif analysis
Coordinates of sequences similar to known transcription factor binding site motifs were identified using a matrix-based approach (Quandt et al. 1995), the frequency of known motifs (TRANSFAC 11.4 database) present in regions of enriched read density was counted and compared with their respective frequency in (1) the entire genome or (2) regions selected randomly from the genome. For (2), sequencing data for nonselected (input) DNA were used to generate the random location distribution. P-values for overrepresentation were derived using (for [1]) Fisher's exact test or (for [2]) by counting the number of random iterations, where the frequency of a given motif in the random set was larger or equal to the frequency observed in the ChIP-seq data set.
Co-enrichment of other transcription factors around a given motif was estimated by enlarging a hit for that motif up- and downstream ±100 bases, counting the number of co-occurrences and comparing this number to their respective frequency in the entire genome, again using Fisher's exact test to calculate P-values. The algorithm used to identify the geometry of the ETS and E2F pair of recognition sites is described in the Supplemental Material.
Chromatin immunoprecipitation assays
Chromatin immunoprecipitation was performed using the MAGnify Chromatin Immunoprecipitation System (Invitrogen) according to manufacturer's instructions. The following antibodies were used: E2F3, sc-878; Santa Cruz Biotechnology; Fli1, MyBiosource. The specificity of the FLI1 antibody for FLI1 in A673 cells was confirmed using EWSR1/FLI1 knockdown, and excluding cross reactivity with ERG in ERG-expressing VCaP cells. PCRs were performed using Phusion Hotstart II (Finnzymes). The primers used in 38 cycles of amplification were as follows: ATAD2: 26/129 GAGCGCGGAAGAGCCAGAG, GCTGCTGCGGAGAACCACCA, −117/18 GCCCGGCCTCCTTCGCTCTA, GGCGCCACAAGCTCCGCGCCA, −350/−240 CAGGGGTGGGGAGGAGACGC, GAGCGGTGCGTAGCCCGTTT, −1678/−1470 CCCAGACATTGCATTCTTCA, GAGGCCAATGAGAACAGAGC, E2F3: 131/262 CCAGAGCCCCGATTATTTTT, GCAGTCGGAGTTTCCAAGTC, −123/62 CGGGTTGAGGGGCGGGGATA, TGCAACGGATTGCGAGGCGG, −272/−149 TCAAGGAGGCCTATGCAAAT, GGCCGCTACCTCCTTACTTC, −1457/−1334 AAGGAGTCCTAGCCTGATCTGA, TGAGGATTGCAACACCTTGA, GEMIN4: −130/76 ACGTCCGGGTACCTGAGGGC, TCCGAGAACTCGAACGCGGC, −153/8 GGTGCGGAGGGGTCTAGT, TTAGGCCTGCTCACAACCTC, −236/−47 GTTACCGGGTGAGGGTGAAT, GCAGTCCTCACGAACGAG, −1457/−1334 GGAGGCTACTGTGGAGACCA, ATGACCCTGGACACTCAAGC.
SYBR Green PCR for ChIP on promoter constructs was performed using Maxima SYBR Green/ROX qPCR Master Mix (Fermentas). The primers used were as follows: E2F3 forward −46 GCGTAAACCGTATCCCTTCA, pGL4.10 reverse 1 AACAGTACCGGATTGCCAAG, GEMIN4 forward GTTACCGGGTGAGGGTGAAT, pGL4.10 reverse 2 CTCGAAGTACTCGGCGTAGG.
Reporter gene assays
Site-directed mutagenesis was performed using the QuikChange II Site-Directed Mutagenesis Kit (Stratagene, 200523) according to the manufacturer's instructions. The primers used to introduce mutations were as follows: ATAD2: ETS 33/35: CGCAGCTCTGGCTCTTTATAGCTCCGAATTCTGGCGCC, E2F −267/−265: CCCGCCGCCGTCCCTTACCAAAATTCCAAACGG, E2F 14/16 CGCGCTCCGAATTCTGTTACCACAAGCTCCGCGC, E2F3: ETS −7/−5 CATTGTCAGCAGCAGCTATATGGAGCCATTTTTCAGCTGCC, ETS 207/209 GAGAGGGGGCTCTATAGCGCCGGGCGG, GEMIN4: ETS −178/−176 CCGCTGGGACCCCTATAGAGGGGCCGGGC, ETS −92/−90 GGGAGGGCTCTGCCTATAGGCGGCGCTGTGC, E2F −70/−68 CGGCGCTGTGCGCTTGTTACGCTCGTTCGTGAGG, E2F 55/57 CGTGCCGTGCGTCCCTTACCGCGTTCGAGTTCTC.
A673 cells carrying a doxycycline-inducible EWSR1/FLI1 shRNA were cotransfected with the pGL4.10-based reporter constructs and pmaxEGFP (Amaxa GmbH) using LipofectAMINE Plus reagent (Invitrogen) at 20% density. The cells were treated with doxycycline 48 h after transfection, and gene reporter assays were carried out with the Bright-Glo Luciferase assay kit (Promega) 96 h after transfection (48 h after doxycycline induction). For E2F3 knockdown experiments, an shRNA construct (kindly provided by Dr. Nevins) was transfected as described above and gene reporter assays were performed 48 h after transfection. EGFP-positive cells as a measure of transfection efficiencies were monitored by standard flow cytometry.
Enrichment analysis
Enrichments were generally calculated as E = o/r, the ratio of the number o of observed events and the number r of events expected by the null model. The null models were as follows:
Enrichment of gene compartments (Fig. 1D) and TF motifs (Fig. 3A,B) and colocalization (Fig. 5A): The position, but not the size, of binding events was randomized using the density of nonselected (input) DNA as the position probability density to account for nonalignable regions. The numbers rc were estimated from the average counts obtained from 10 permutations for randomized binding events in compartment c (Fig. 1D), overlapping a TF recognition motif c (Fig. 3A,B), or overlapping a binding site of the partner protein c (Fig. 5A).
Enrichment of binding events associated with PCA components (Fig. 2C) and regulatory activity (Fig. 5C): Background numbers rφπ for transcription factor φ and principal component (or gene set, respectively) π were calculated as rφπ = Gπ/G * oφ, where G is the total number of RefSeq genes (for Fig. 2C) or the number of genes on the U133A microarray (Fig. 5C), Gπ the number of genes associated with PCA (or geneset) π, and oφ the number of binding events for transcription factor φ.
Data access
The microarray data from this study have been submitted to the NCBI Gene Expression Omnibus (GEO; http://www.ncbi.nlm.nih.gov/geo/) under accession number GSE27524. Sequence data generated for this study have been submitted to the NCBI Sequence Read Archive (SRA; http://www.ncbi.nlm.nih.gov/sra) under accession number SRA096176.
Acknowledgments
This study was supported in part by the Intramural Research Program of the NIH, National Cancer Institute, Center for Cancer Research and the Austrian Science Fund (FWF), grant 22328-B09; and by the 7th Framework Program of the European Commission, grant 259348 (“ASSET”). R.S. is a recipient of a DOC-fFORTE scholarship of the Austrian Academy of Sciences. We thank J. Waterfall for valuable discussions.
Footnotes
[Supplemental material is available for this article.]
Article published online before print. Article, supplemental material, and publication date are at http://www.genome.org/cgi/doi/10.1101/gr.151340.112.
Freely available online through the Genome Research Open Access option.
References
- Chen H-Z, Tsai S-Y, Leone G 2009. Emerging roles of E2Fs in cancer: An exit from cell cycle control. Nat Rev Cancer 9: 785–797 [DOI] [PMC free article] [PubMed] [Google Scholar]
- Clark JP, Cooper CS 2009. ETS gene fusions in prostate cancer. Nat Rev Urol 6: 429–439 [DOI] [PubMed] [Google Scholar]
- De Bleser P, Hooghe B, Vlieghe D, van Roy F 2007. A distance difference matrix approach to identifying transcription factors that regulate differential gene expression. Genome Biol 8: R83. [DOI] [PMC free article] [PubMed] [Google Scholar]
- Delattre O, Zucman J, Plougastel B, Desmaze C, Melot T, Peter M, Kovar H, Joubert I, De Jong P, Rouleau G 1992. Gene fusion with an ETS DNA-binding domain caused by chromosome translocation in human tumours. Nature 359: 162–165 [DOI] [PubMed] [Google Scholar]
- Dennis G Jr, Sherman BT, Hosack DA, Yang J, Gao W, Lane HC, Lempicki RA 2003. DAVID: Database for Annotation, Visualization, and Integrated Discovery. Genome Biol 4: 3. [PubMed] [Google Scholar]
- Forster A, Pannell R, Drynan L, Cano F, Chan N, Codrington R, Daser A, Lobato N, Metzler M, Nam CH, et al. 2005. Chromosomal translocation engineering to recapitulate primary events of human cancer. Cold Spring Harb Symp Quant Biol 70: 275–282 [DOI] [PubMed] [Google Scholar]
- Freedman JA, Chang JT, Jakoi L, Nevins JR 2009. A combinatorial mechanism for determining the specificity of E2F activation and repression. Oncogene 28: 2873–2881 [DOI] [PMC free article] [PubMed] [Google Scholar]
- Gangwal K, Lessnick SL 2008. Microsatellites are EWS/FLI response elements: Genomic “junk” is EWS/FLI's treasure. Cell Cycle 7: 3127–3132 [DOI] [PubMed] [Google Scholar]
- Ginsberg JP, De Alava E, Ladanyi M, Wexler LH, Kovar H, Paulussen M, Zoubek A, Dockhorn-Dworniczak B, Juergens H, Wunder JS, et al. 1999. EWS–FLI1 and EWS–ERG gene fusions are associated with similar clinical phenotypes in Ewing's sarcoma. J Clin Oncol 17: 1809. [DOI] [PubMed] [Google Scholar]
- Guillon N, Tirode F, Boeva V, Zynovyev A, Barillot E, Delattre O 2009. The oncogenic EWS–FLI1 protein binds in vivo GGAA microsatellite sequences with potential transcriptional activation function. PLoS ONE 4: e4932. [DOI] [PMC free article] [PubMed] [Google Scholar]
- Gupta S, Iljin K, Sara H, Mpindi JP, Mirtti T, Vainio P, Rantala J, Alanen K, Nees M, Kallioniemi O 2010. FZD4 as a mediator of ERG oncogene-induced WNT signaling and epithelial-to-mesenchymal transition in human prostate cancer cells. Cancer Res 70: 6735–6745 [DOI] [PubMed] [Google Scholar]
- Hancock JD, Lessnick SL 2008. A transcriptional profiling meta-analysis reveals a core EWS–FLI gene expression signature. Cell Cycle 7: 250–256 [DOI] [PubMed] [Google Scholar]
- Holmes E, Antti H 2002. Chemometric contributions to the evolution of metabonomics: Mathematical solutions to characterising and interpreting complex biological NMR spectra. Analyst (Lond) 127: 1549–1557 [DOI] [PubMed] [Google Scholar]
- Hu-Lieskovan S, Zhang J, Wu L, Shimada H, Schofield DE, Triche TJ 2005. EWS–FLI1 fusion protein up-regulates critical genes in neural crest development and is responsible for the observed phenotype of Ewing's family of tumors. Cancer Res 65: 4633–4644 [DOI] [PubMed] [Google Scholar]
- Izumi M, Yokoi M, Nishikawa NS, Miyazawa H, Sugino A, Yamagishi M, Yamaguchi M, Matsukage A, Yatagai F, Hanaoka F 2000. Transcription of the catalytic 180-kDa subunit gene of mouse DNA polymerase α is controlled by E2F, an Ets-related transcription factor, and Sp1. Biochim Biophys Acta 1492: 341–352 [DOI] [PubMed] [Google Scholar]
- Joung JG, Shin D, Seong RH, Zhang BT 2006. Identification of regulatory modules by co-clustering latent variable models: Stem cell differentiation. Bioinformatics 22: 2005–2011 [DOI] [PubMed] [Google Scholar]
- Kauer M, Ban J, Kofler R, Walker B, Davis S, Meltzer P, Kovar H 2009. A molecular function map of Ewing's sarcoma. PLoS ONE 4: e5415. [DOI] [PMC free article] [PubMed] [Google Scholar]
- Kovar H 2010. Downstream EWS/FLI1—upstream Ewing's sarcoma. Genome Med 2: 8. [DOI] [PMC free article] [PubMed] [Google Scholar]
- Kovar H, Aryee DN, Jug G, Henockl C, Schemper M, Delattre O, Thomas G, Gadner H 1996. EWS/FLI-1 antagonists induce growth inhibition of Ewing tumor cells in vitro. Cell Growth Differ 7: 429–437 [PubMed] [Google Scholar]
- Landt SG, Marinov GK, Kundaje A, Kheradpour P, Pauli F, Batzoglou S, Bernstein BE, Bickel P, Brown JB, Cayting P, et al. 2012. ChIP-seq guidelines and practices of the ENCODE and modENCODE consortia. Genome Res 22: 1813–1831 [DOI] [PMC free article] [PubMed] [Google Scholar]
- Li R, Pei H, Watson DK 2000. Regulation of Ets function by protein–protein interactions. Oncogene 19: 6514–6523 [DOI] [PubMed] [Google Scholar]
- Mahony S, Auron PE, Benos PV 2007. DNA familial binding profiles made easy: Comparison of various motif alignment and clustering strategies. PLoS Comput Biol 3: e61. [DOI] [PMC free article] [PubMed] [Google Scholar]
- Maier H, Colbert J, Fitzsimmons D, Clark DR, Hagman J 2003. Activation of the early B-cell-specific mb-1 (Ig-α) gene by Pax-5 is dependent on an unmethylated Ets binding site. Mol Cell Biol 23: 1946–1960 [DOI] [PMC free article] [PubMed] [Google Scholar]
- Mao X, Miesfeldt S, Yang H, Leiden JM, Thompson CB 1994. The FLI-1 and chimeric EWS–FLI-1 oncoproteins display similar DNA binding specificities. J Biol Chem 269: 18216–18222 [PubMed] [Google Scholar]
- Mirny LA 2010. Nucleosome-mediated cooperativity between transcription factors. Proc Natl Acad Sci 107: 22534–22539 [DOI] [PMC free article] [PubMed] [Google Scholar]
- Patel M, Simon JM, Iglesia MD, Wu SB, McFadden AW, Lieb JD, Davis IJ 2012. Tumor-specific retargeting of an oncogenic transcription factor chimera results in dysregulation of chromatin and transcription. Genome Res 22: 259–270 [DOI] [PMC free article] [PubMed] [Google Scholar]
- Prieur A, Tirode F, Cohen P, Delattre O 2004. EWS/FLI-1 silencing and gene profiling of Ewing cells reveal downstream oncogenic pathways and a crucial role for repression of insulin-like growth factor binding protein 3. Mol Cell Biol 24: 7275–7283 [DOI] [PMC free article] [PubMed] [Google Scholar]
- Quandt K, Frech K, Karas H, Wingender E, Werner T 1995. MatInd and MatInspector: New fast and versatile tools for detection of consensus matches in nucleotide sequence data. Nucleic Acids Res 23: 4878–4884 [DOI] [PMC free article] [PubMed] [Google Scholar]
- Rahim S, Beauchamp EM, Kong Y, Brown ML, Toretsky JA, Uren A 2011. YK-4-279 inhibits ERG and ETV1 mediated prostate cancer cell invasion. PLoS ONE 6: e19343. [DOI] [PMC free article] [PubMed] [Google Scholar]
- Riggi N, Cironi L, Provero P, Suva ML, Kaloulis K, Garcia-Echeverria C, Hoffmann F, Trumpp A, Stamenkovic I 2005. Development of Ewing's sarcoma from primary bone marrow-derived mesenchymal progenitor cells. Cancer Res 65: 11459–11468 [DOI] [PubMed] [Google Scholar]
- Riggi N, Suva ML, De Vito C, Provero P, Stehle JC, Baumer K, Cironi L, Janiszewska M, Petricevic T, Suva D, et al. 2010. EWS–FLI-1 modulates miRNA145 and SOX2 expression to initiate mesenchymal stem cell reprogramming toward Ewing sarcoma cancer stem cells. Genes Dev 24: 916–932 [DOI] [PMC free article] [PubMed] [Google Scholar]
- Sankar S, Bell R, Stephens B, Zhuo R, Sharma S, Bearss DJ, Lessnick SL 2012. Mechanism and relevance of EWS/FLI-mediated transcriptional repression in Ewing sarcoma. Oncogene doi: 10.1038/onc.2012.525 [DOI] [PubMed] [Google Scholar]
- Schlisio S, Halperin T, Vidal M, Nevins JR 2002. Interaction of YY1 with E2Fs, mediated by RYBP, provides a mechanism for specificity of E2F function. EMBO J 21: 5775–5786 [DOI] [PMC free article] [PubMed] [Google Scholar]
- Shirasaki F, Makhluf HA, LeRoy C, Watson DK, Trojanowska M 1999. ETS transcription factors cooperate with Sp1 to activate the human tenascin-C promoter. Oncogene 18: 7755–7764 [DOI] [PubMed] [Google Scholar]
- Staege MS, Hutter C, Neumann I, Foja S, Hattenhorst UE, Hansen G, Afar D, Burdach SE 2004. DNA microarrays reveal relationship of Ewing family tumors to both endothelial and fetal neural crest-derived cells and define novel targets. Cancer Res 64: 8213–8221 [DOI] [PubMed] [Google Scholar]
- Tirado OM, Mateo-Lozano S, Villar J, Dettin LE, Llort A, Gallego S, Ban J, Kovar H, Notario V 2006. Caveolin-1 (CAV1) is a target of EWS/FLI-1 and a key determinant of the oncogenic phenotype and tumorigenicity of Ewing's sarcoma cells. Cancer Res 66: 9937–9947 [DOI] [PubMed] [Google Scholar]
- Tirode F, Laud-Duval K, Prieur A, Delorme B, Charbord P, Delattre O 2007. Mesenchymal stem cell features of Ewing tumors. Cancer Cell 11: 421–429 [DOI] [PubMed] [Google Scholar]
- Tsai SY, Opavsky R, Sharma N, Wu L, Naidu S, Nolan E, Feria-Arias E, Timmers C, Opavska J, de Bruin A, et al. 2008. Mouse development with a single E2F activator. Nature 454: 1137–1141 [DOI] [PMC free article] [PubMed] [Google Scholar]
- Watson DK, Robinson L, Hodge DR, Kola I, Papas TS, Seth A 1997. FLI1 and EWS–FLI1 function as ternary complex factors and ELK1 and SAP1a function as ternary and quaternary complex factors on the Egr1 promoter serum response elements. Oncogene 14: 213–221 [DOI] [PubMed] [Google Scholar]
- Wu Z, Irizarry RA, Gentleman R, Martinez-Murillo F, Spencer F 2004. A model-based background adjustment for oligonucleotide expression arrays. J Am Stat Assoc 99: 909–917 [Google Scholar]
- Yang ZF, Mott S, Rosmarin AG 2007. The ETS transcription factor GABP is required for cell-cycle progression. Nat Cell Biol 9: 339–346 [DOI] [PubMed] [Google Scholar]
- Yu J, Mani RS, Cao Q, Brenner CJ, Cao X, Wang X, Wu L, Li J, Hu M, Gong Y, et al. 2010. An integrated network of androgen receptor, Polycomb, and TMPRSS2–ERG gene fusions in prostate cancer progression. Cancer Cell 17: 443–454 [DOI] [PMC free article] [PubMed] [Google Scholar]