Abstract
Objective:
The objective of this study is to validate if ex-vivo multispectral photoacoustic (PA) imaging can differentiate between malignant prostate tissue, benign prostatic hyperplasia (BPH), and normal human prostate tissue.
Materials and Methods:
Institutional Review Board's approval was obtained for this study. A total of 30 patients undergoing prostatectomy for biopsy-confirmed prostate cancer were included in this study with informed consent. Multispectral PA imaging was performed on surgically excised prostate tissue and chromophore images that represent optical absorption of deoxyhemoglobin (dHb), oxyhemoglobin (HbO2), lipid, and water were reconstructed. After the imaging procedure is completed, malignant prostate, BPH and normal prostate regions were marked by the genitourinary pathologist on histopathology slides and digital images of marked histopathology slides were obtained. The histopathology images were co-registered with chromophore images. Region of interest (ROI) corresponding to malignant prostate, BPH and normal prostate were defined on the chromophore images. Pixel values within each ROI were then averaged to determine mean intensities of dHb, HbO2, lipid, and water.
Results:
Our preliminary results show that there is statistically significant difference in mean intensity of dHb (P < 0.0001) and lipid (P = 0.0251) between malignant prostate and normal prostate tissue. There was difference in mean intensity of dHb (P < 0.0001) between malignant prostate and BPH. Sensitivity, specificity, positive predictive value, and negative predictive value of our imaging system were found to be 81.3%, 96.2%, 92.9% and 89.3% respectively.
Conclusion:
Our preliminary results of ex-vivo human prostate study suggest that multispectral PA imaging can differentiate between malignant prostate, BPH and normal prostate tissue.
Keywords: Multispectral, photoacoustic, prostate
INTRODUCTION

Prostate cancer is the most prevalent newly diagnosed malignancy in men, second only to lung cancer in causing cancer-related deaths.[1] For the year 2013, it was estimated that 238,590 new cases of prostate cancer will be diagnosed in the United States, with an estimated 29,720 deaths.[2] American Cancer Society recommends that men who are at average risk of prostate cancer should undergo prostate cancer screening at age 50 years or older. Screening is generally done by performing prostate-specific antigen (PSA) blood test and digital rectal examination (DRE). Clinically localized disease is usually suspected based on an elevated PSA test or abnormal DRE. Both DRE and PSA screening suffer from low specificity and sensitivity prompting trans-rectal ultrasound (TRUS) guided biopsy of the prostate for definitive diagnosis. TRUS however, is not reliable enough to be used solely as a template for biopsy. Often, there are cancers that are not visible (isoechoic) on TRUS. Furthermore, in PSA screened populations, the accuracy of TRUS is only about 52% due to false-positive findings encountered.[3] Efficacy of color and power Doppler ultrasound for prostate cancer screening has not been demonstrated, probably due to limited resolution and small flow velocities. It is evident that given the limitations of the present diagnostic protocols, development of a new imaging modality that improves detection of prostate cancer would be beneficial.
The objective of this study is to validate if ex-vivo multispectral photoacoustic imaging (EMPI) can differentiate between malignant prostate tissue, benign prostatic hyperplasia (BPH), and normal human prostate tissue.
MATERIALS AND METHODS
Study subjects
This ex-vivo study was in compliance with the Health Insurance Portability and Accountability Act and was approved by Institutional Review Board. Between June 2011 and February 2012, 30 male patients (mean age, 62 ± 8; age range, 46-74 years) with biopsy-confirmed prostate cancer who underwent prostatectomy were consented for this study.
Excised prostate tissue handling
The surgically excised prostate gland from each patient was immediately sent from the operating room to surgical pathology. The prostate gland was then inked and sectioned by a genitourinary pathologist. The ex-vivo prostate tissue sections were typically 2-5 millimeter (mm) thick and 20-40 mm wide. The ex-vivo prostate sections with at least one grossly visible nodule were immediately placed in normal saline to prevent dryness, imaged with our multispectral PA imaging device and returned back to the surgical pathology within 1 hour post-surgery. Figure 1 illustrates the ex-vivo prostate tissue acquisition and handling protocol. This protocol was verified and approved by the genitourinary pathologist to ensure that the histopathology evaluation of prostate tissue is not compromised by our imaging procedure, which would otherwise impact the patient diagnosis.
Figure 1.
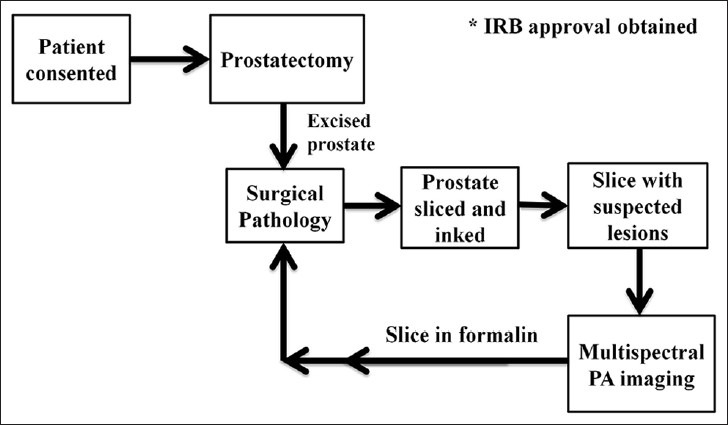
Tissue acquisition and handling protocol for photoacoustic imaging of ex-vivo prostate specimens.
Multispectral photoacoustic imaging of ex-vivo prostate tissue
Currently, we have a working acoustic-lens-based multispectral photoacoustic (PA) imaging device for ex-vivo prostate tissue imaging. The ex-vivo multispectral photoacoustic imaging (EMPI) device employs a fiber-coupled tunable near-infrared laser (wavelength: 700-1000 nm, pulse repetition frequency: 10 Hz, and pulse duration: 5 ns), spherical acoustic lens (focal length: 39.8 mm) and a linear sensor array (5 MHz, 32 elements, pitch 0.7 mm) integrated with a custom-designed simultaneous data acquisition (DAQ) module for photoacoustic signal generation, real-time focusing, detection and image display. The EMPI device is equipped with dual-axis linear stepper motors to facilitate three-dimensional (3D) imaging. After the 3D photoacoustic dataset is acquired, images of excised prostate tissue in transverse (B-scan), sagittal (B-scan), and coronal (C-scan) planes are reconstructed using custom-developed algorithms in MATLAB programming language.
Multispectral PA imaging of ex-vivo prostate tissue was performed with EMPI device while the laser was delivered onto the prostate using a trans-illumination setup.[4,5] The laser intensity delivered onto the ex-vivo prostate tissue was approximately 5 mJ/cm2, which is well below the maximum permissible energy limit (20 mJ/ cm2 at 700 nm-79.6 mJ/cm2 at 1000 nm) set by American National Standards Institute guidelines for safe human exposure.[6] PA imaging was performed at wavelengths of 760 nm, 850 nm, 930 nm and 970 nm that represent deoxyhemoglobin (dHb), oxyhemoglobin (HbO2), lipids, and water respectively.[7] The EMPI device was raster-scanned over the ex-vivo prostate tissue to acquire a 3D PA dataset over a volume of 45 mm3 × 45 mm3 × 5 mm3. The whole process of procuring the surgically removed prostate tissue, performing multispectral PA imaging and returning the specimen to surgical pathology took approximately 1 hour. A significant change in the concentration of dHb in the excised prostate tissue is not expected since it is bound deep within the tissue.
Photoacoustic image analysis
The PA image obtained at each wavelength is a composite map of optical absorption by all the tissue chromophores: dHb, HbO2, lipid, and water. From the acquired multispectral PA images, individual chromophore photoacoustic (CPA) images that represent optical absorption of dHb, HbO2, lipid, and water were reconstructed using custom-developed algorithms in MATLAB® programming language as described by Cox BT et al.[8]
For each excised prostate tissue, areas corresponding to malignant prostate, BPH, and normal prostate were identified and marked on the histopathology slide by a genitourinary pathologist. The digital images of marked histopathology slides were obtained from the pathologist and co-registered with each of the four reconstructed CPA C-scan images in order to be able to compare the marked regions. Typically the excised prostate gland is inked using different colors prior to slicing and this ink has been generating PA signals that are recorded by our EMPI system in the raster scan process. These recorded signals from the ink act like a guided boundary outline on our CPA images for every imaged specimen. This guided boundary helped us to select the region of interest (ROI) on the CPA images using marked digital histopathology slides as ground truth. On these co-registered CPA C-scan images, ROI for malignant prostate, BPH and normal prostate tissue were defined. From each ROI, mean intensity value of all the pixels was calculated to determine the optical absorption of dHb, HbO2, lipid and water. Figure 2 illustrates the multispectral PA image analysis procedure. The person performing the co-registration of CPA C-scan images and histopathology images was blinded to the histopathology results.
Figure 2.
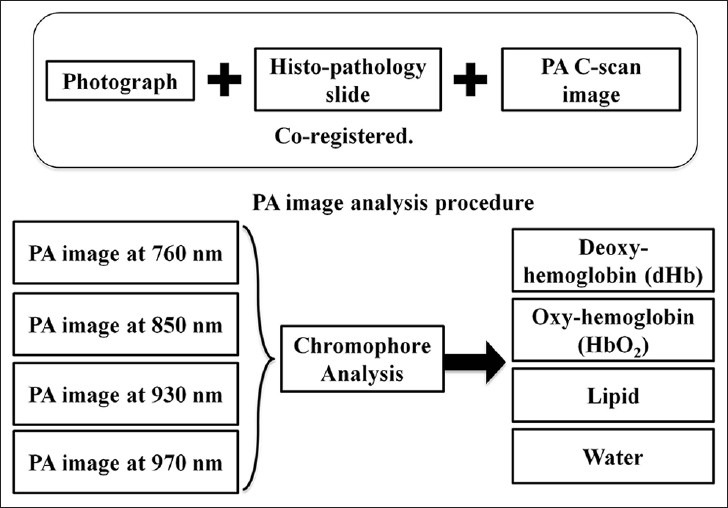
Photoacoustic (PA) image analysis procedure. Chromophore analysis was performed on the acquired multispectral composite PA images to extract individual optical absorption maps of dHb, HbO2, lipid and water. Each PA image is co-registered with the photograph of gross prostate tissue and histopathology for further evaluation.
Statistical analysis
Generalized estimating equations (GEE) were used to model the regression of the pixel values on tissue type (malignant prostate, BPH, and normal prostate), wavelength and the interaction of tissue type and wavelength. To assess the relationship between malignant prostate, BPH and normal prostate tissue based on CPA C-scan images, t-tests were carried out with conservative significance level of P ≤ 0.01. Multivariate Analysis of Variance (MANOVA) was carried out to determine if there was a significant difference when considering dHb, HbO2, lipid and water simultaneously. To determine EMPI device classification probabilities to categorize malignant prostate, BPH and normal prostate tissue, a logistic regression model was employed using the mean intensity of dHb. Statistical analyses were carried out in SAS® 9.3 software (Copyright© 2011, SAS Institute Inc., Cary, NC, USA) and R 2.12.2 (Copyright© 2011, The R Foundation for Statistical Computing, Vienna, Australia) on a Windows 7 platform.
RESULTS
From 30 patients, a total of 42 excised prostate sections were acquired and imaged using EMPI device. Histopathology evaluation was performed by the genitourinary pathologist for each of the imaged prostate sections. Out of the 42 excised prostate sections, 16/42 sections were diagnosed as malignant, 8/42 sections were diagnosed as BPH and 18/42 prostate sections were diagnosed as normal by the genitourinary pathologist [Table 1].
Table 1.
Subjects information

Initial statistical analysis was performed on the acquired multispectral PA images using GEE analysis. GEE results show significant differences between mean intensity values of malignant and normal prostate at wavelengths of 760 nm (P = 0.0023), 850 nm (P = 0.0006) and 970 nm (P = 0.0193). There were differences between mean intensity values of malignant prostate and BPH at wavelengths of 760 nm (P = 0.0104), 850 nm (P = 0.0128) and 930 nm (P = 0.0438). There was a statistically significant difference between mean intensity value of BPH and normal prostate at a wavelength of 970 nm (P = 0.0185). Figure 3 shows the differences between mean intensity values of malignant prostate, BPH, and normal prostate tissue as a function of the wavelength.
Figure 3.
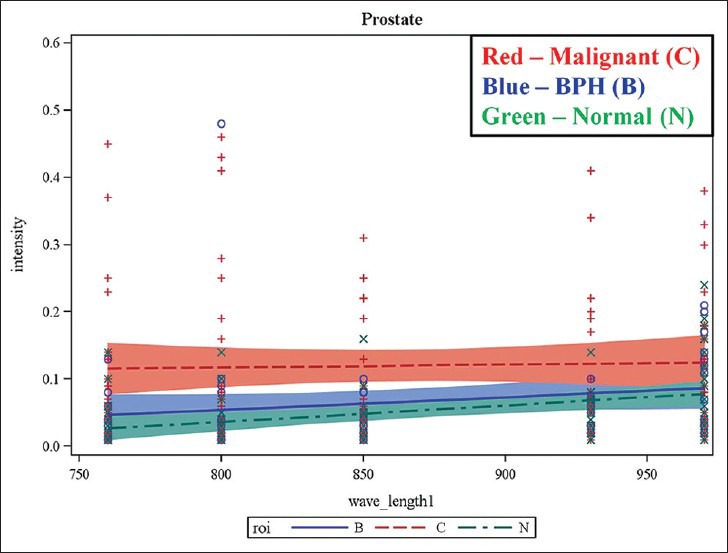
Results of generalized estimated equation model demonstrating the potential of multispectral photoacoustic imaging in differentiating normal, BPH and malignant prostate tissue. The plots show mean intensity values against incident laser wavelength. The mean intensity of malignant prostate was found to be higher compared with that normal and BPH at all the wavelengths.
Statistical analysis using pair-wise t-tests, MANOVA and logistic regression was performed on CPA C-scan images to determine the differences between mean intensity values of dHb, HbO2, lipid and water for malignant prostate, BPH, and normal prostate tissue. Table 2 presents the summary of t-tests. There was a statistically significant difference in mean intensity value of dHb (P < 0.0001) and lipid (P = 0.0251) between malignant and normal prostate. There was a statistically significant difference in mean intensity of dHb (P < 0.0001) between malignant prostate and BPH. No statistically significant difference in dHb, HbO2, lipid, and water was present between BPH and normal prostate tissue. When BPH and normal prostate tissue were considered together as non-malignant prostate, a statistically significant difference in mean intensity of dHb (P < 0.0001) was found between malignant and non-malignant prostate tissue.
Table 2.
Malignant vs. normal, benign prostatic hyperplasia and nonmalignant prostate

The overall MANOVA test was significant (P = 0.0035) between malignant prostate and BPH due to the difference in mean intensity of dHb (P = 0.0003). For malignant and non-malignant tissue (BPH + normal prostate tissue), the overall MANOVA was significant (P < 0.0001) due to the differences in mean intensity of dHb (P < 0.0001) and HbO2 (P = 0.0433).
Logistic regression was performed on dHb to determine system classification probabilities for malignant and non-malignant prostate tissue [Table 3]. The overall logistic regression model (P < 0.001) and dHb estimate (P = 0.015) were significant. For a 0.01 increase in mean intensity of dHb, the effect size (odds ratio) was 1.35 with 95% confidence interval (CI) ranging from 1.06 to 1.72 implying that for 0.01 increase in dHb mean intensity, the odds of a tissue being malignant (vs. non-malignant) increased by 35%. The EMPI device was able to predict 25/26 non-malignant ROI and 13/16 malignant ROI correctly. This translates to a sensitivity of 81.3% (95% CI: 57-93.4%) and specificity of 96.2% (95% CI: 81.1-99.3%). Positive predictive value (PPV) was found to be 92.9% while negative predictive value was 89.3%.
Table 3.
Predicted results vs. Observed results

DISCUSSION
A recent study involving patients from Europe and United States suggests that DRE and PSA suffer from false positive rates of 15% and 10.4% respectively.[9] Other studies suggest that PPV for DRE and PSA might be as low as 17.8% and 25.1% respectively. Typical sensitivity and specificity values for PSA are 72.1% and 93.2% respectively.[10,11] TRUS also suffers from low prostate cancer detection rates. The sensitivity and specificity values of TRUS in detecting organ confined prostate cancer are only 66.1% and 32.6% while sensitivity and specificity values of DRE are 68.5% and 20% clearly suggesting that TRUS is not a suitable alternative for prostate cancer screening.[12] On the other hand, sensitivity, specificity of diffusion weighted magnetic resonance imaging are 69%, 89% and T2 weighted magnetic resonance imaging are 60%, 76% respectively.[13] Therefore, there is a compelling need for a better imaging device in the management of prostate cancer.
TECHNOLOGY
This section describes the novelty of the PA imaging technology to familiarize the readers with the basics and fundamentals of the PA imaging. The authors’ intention is not to endorse or support the superiority of our technique over other existing PA methodologies.
What is PA imaging?
PA imaging is a hybrid non-invasive technique that combines optics and ultrasound imaging technologies. PA signal is generated in tissue in response to low-energy nanosecond pulses of laser light usually in the near-infrared region, as shown in Figure 4. The absorption of a short optical pulse causes localized heating and rapid thermal expansion, which generates thermoelastic stress waves (ultrasound waves). These ultrasound waves are generated instantaneously and simultaneously everywhere in a 3D tissue volume irradiated by the laser pulse. Owing to the nature of their generation, these ultrasound waves are referred to as PA waves. The PA signal amplitude is proportional to the optical absorption of laser intensity by the absorber, and PA images are gathered by mapping the location and strengths of the absorbers in the tissue.
Figure 4.
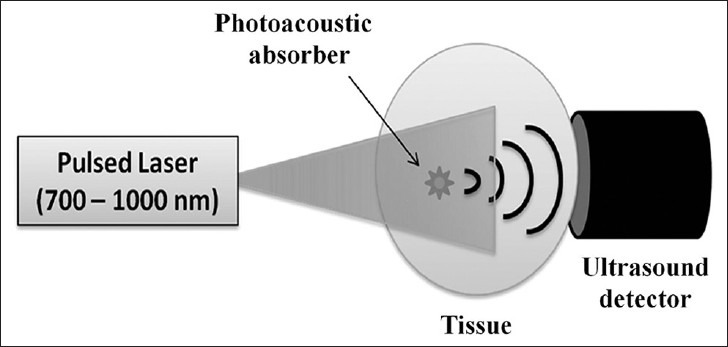
Illustration of photoacoustic (PA) effect. When a tissue is exposed to low energy pulsed laser beam for a very short duration, optical absorption in the tissue takes place followed by localized heating and rapid thermal expansion generating acoustic waves. Since the acoustic waves are generated due to laser exposure, they are commonly called PA waves.
C-scan image formation
C-scan is an image produced by spatially sampling the ultrasound signal amplitude at a fixed time while the sensor is laterally scanned over a tissue surface.[14] The C-scan image is vividly different from a conventional B-scan image generated by an ultrasound imaging system in that C-scan image depicts information in the coronal plane, whereas a B-scan image conveys information from sagittal or transverse plane in the body as shown in Figure 5.
Figure 5.
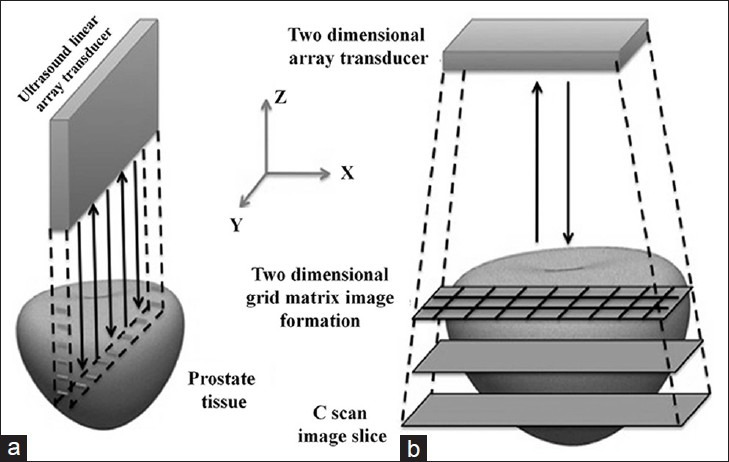
Differences between C-scan and B-scan image formation. B-scan image depicts sagittal or transverse planes in the body where as a C-scan image depicts information from coronal plane in the body. Reproduced with permission from “Basics and Clinical Applications of Photoacoustic Imaging,” Ultrasound Clinics, Vol. 4, Issue 3: 403-429, July 2009.
Acoustic lens focusing
PA image focusing in our system was achieved by using a spherical acoustic lens in contrast to electronic focusing techniques applied in the backend processing stage of conventional ultrasound systems. The lens will focus the PA signals generated in tissue plane onto an ultrasound sensor placed in its image plane [Figure 6] to detect the PA signals whose time of arrival depends on the object plane-image plane distance and the medium in which the PA waves propagate. An advantage of using a physical lens over electronic focusing is that it results in real-time DAQ besides being inexpensive. Our acoustic-lens-based EMPI device will display PA images as fast as every 0.1-0.5 s.
Figure 6.
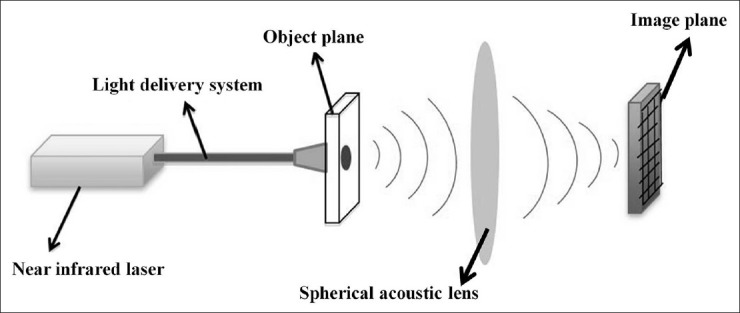
Acoustic lens focusing. Photoacoustic signals generated from the tissue (object plane) are focused onto an ultrasound sensor array placed in the image plane, enabling real-time high speed data acquisition. Reproduced with permission from “Photoacoustic Imaging: Opening New Frontiers in Medical Imaging”. J Clin Imaging Sci 2011, 1:24.
Diagnostic and prognostic implications
In this study, we have presented our preliminary findings with the EMPI device that was developed to characterize prostate tissue in the ex-vivo study. Our PA imaging experiments were able to provide information on tissue chromophores in ex-vivo prostate tissue suggesting that it may be useful for the diagnosis and prognosis of underlying prostate disease. Approximately, prostate cancers (0.64 mL/g/min) have three times more blood flow than normal prostate (0.21 mL/g/ min) and the oxygenation level (6 mmHg) much lower compared to normal prostate (26 mmHg).[15] Prostate tumors being hypoxic, our EMPI system results showed that dHb is one of the key constituents that can help us differentiate malignant from non-malignant prostate tissue [Figure 7]. PA imaging might help in the prognosis and follow-up of prostate disease based on its ability to monitor variations in concentrations of tissue constituents. PA imaging information is mainly derived from spectroscopic analysis. For an advanced imaging technology, PA imaging combined with ultrasound will be capable of visualizing both the functional and structural properties of a tissue. The development of this resulting non-invasive hybrid imaging technology will add features in differentiating malignant from benign and improve the quality of lives.
Figure 7.
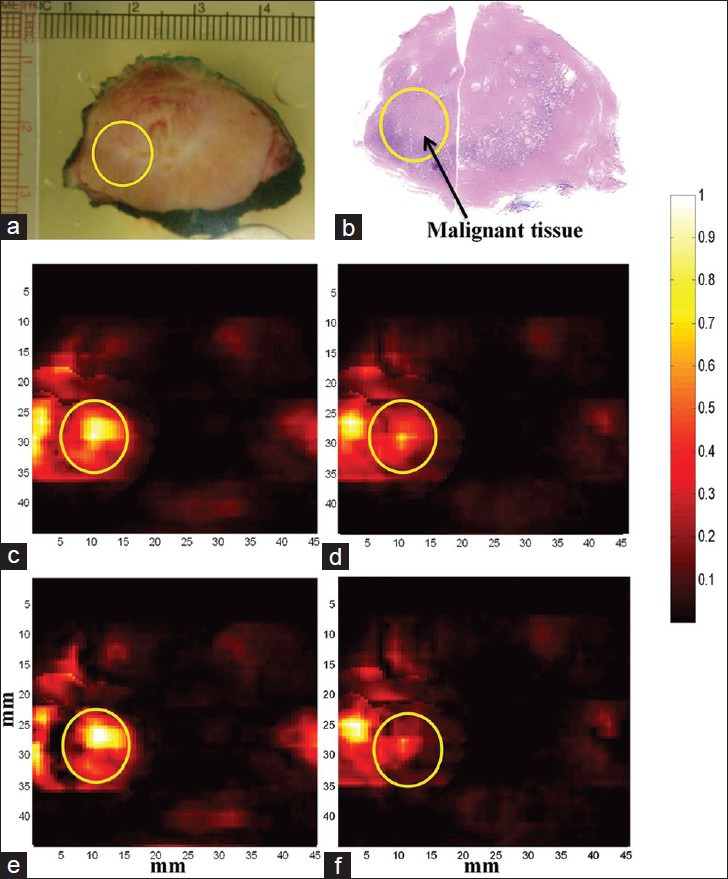
Multispectral photoacoustic (PA) imaging of prostate. PA images are acquired at multiple laser wavelengths. Each wavelength image is a composite image of all the tissue constituents such as deoxy-hemoglobin (dHb), oxy-hemoglobin (HbO2), lipid and water. Chromophore analysis was performed to extract PA images showing absorption of individual constituents from the multi-wavelength images. All the PA images are co-registered with histopathology and photograph of the gross specimen. (a) Photograph of gross prostate specimen (b) Histopathology of prostate with malignant region encircled. (c) Composite PA image acquired at 760 nm wavelength (d) Composite PA image acquired at 850 nm wavelength (e) PA image showing absorption of dHb (f) PA image showing absorption of HbO2. Higher absorption of dHb was seen in the region of interest corresponding to malignant prostate tissue compared to HbO2.
LIMITATIONS
This is an ex-vivo study. An in-vivo study would have been ideal. Typically, tissue PA signals have frequencies anywhere between 1 MHz and 10 MHz. Our EMPI device implemented a 5 MHz frequency linear array restricting the acquisition of PA signals within the sensor bandwidth. Dual-axis linear stepper motors were used to acquire 3D PA dataset in this study resulting in an acquisition time of 5 min to acquire images of size 45 mm × 45 mm, which could have been significantly reduced if a 2D sensor array was implemented. The ex-vivo human prostate tissue is made up of many chromophores; however, we presumed that PA image obtained at each wavelength is a composite of only four tissue constituents: dHb, HbO2, lipid and water.
CONCLUSION
Our preliminary results of ex-vivo human prostate study suggest that multispectral PA imaging can differentiate between malignant prostate, BPH, and normal prostate tissue.
ACKNOWLEDGEMENT
The authors take this opportunity to thank the Radiological Society of North America (RSNA) for awarding the Research Seed Grant #RSD1118 and the New York State Foundation for Science, Technology and Innovation (NYSTAR) for awarding the Center for Emerging and Innovative Sciences (CEIS) grant to perform this ex-vivo human prostate tissue study. We gratefully acknowledge the Lang Memorial Foundation for generously sponsoring the tunable pulsed near-infrared laser for multispectral Photoacoustic imaging of ex-vivo prostate tissue.
Footnotes
Available FREE in open access from: http://www.clinicalimagingscience.org/text.asp?2013/3/1/41/119139
Source of Support: Nil
Conflict of Interest: None declared.
REFERENCES
- 1.Eheman C, Henley SJ, Ballard-Barbash R, Jacobs EJ, Schymura MJ, Noone AM, et al. Annual Report to the nation on the status of cancer, 1975-2008, featuring cancers associated with excess weight and lack of sufficient physical activity. Cancer. 2012;118:2338–66. doi: 10.1002/cncr.27514. [DOI] [PMC free article] [PubMed] [Google Scholar]
- 2.Cancer Statistics. National Cancer Institute. 2012. [Last accessed on 2013 Apr 24]. Available from: http://www.cancer.gov/statistics .
- 3.Carter HB, Hamper UM, Sheth S, Sanders RC, Epstein JI, Walsh PC. Evaluation of transrectal ultrasound in the early detection of prostate cancer. J Urol. 1989;142:1008–10. doi: 10.1016/s0022-5347(17)38971-1. [DOI] [PubMed] [Google Scholar]
- 4.Rao NA, Lai D, Bhatt S, Arnold SC, Chinni B, Dogra VS. Acoustic lens characterization for ultrasound and photoacoustic C-scan imaging modalities. Conf Proc IEEE Eng Med Biol Soc 2008. 2008:2177–80. doi: 10.1109/IEMBS.2008.4649626. [DOI] [PubMed] [Google Scholar]
- 5.Valluru KS, Chinni BK, Rao NA, Bhatt S, Akata D, Dogra VS. Development of a c-scan photoacoustic imaging probe for prostate cancer detection. Proc SPIE. 2011;7968 79680C1-7. [Google Scholar]
- 6.American national standard for the safe use of lasers, ANSI Z136. 1-2007. [Google Scholar]
- 7.Vogel A, Venugopalan V. Mechanisms of pulsed laser ablation of biological tissues. Chem Rev. 2003;103:577–644. doi: 10.1021/cr010379n. [DOI] [PubMed] [Google Scholar]
- 8.Cox BT, Arridge SR, Beard PC. Estimating chromophore distributions from multiwavelength photoacoustic images. J Opt Soc Am A Opt Image Sci Vis. 2009;26:443–55. doi: 10.1364/josaa.26.000443. [DOI] [PubMed] [Google Scholar]
- 9.Eckersberger E, Finkelstein J, Sadri H, Margreiter M, Taneja SS, Lepor H, et al. Screening for prostate cancer: A review of the ERSPC and PLCO trials. Rev Urol. 2009;11:127–33. [PMC free article] [PubMed] [Google Scholar]
- 10.Mistry K, Cable G. Meta-analysis of prostate-specific antigen and digital rectal examination as screening tests for prostate carcinoma. J Am Board Fam Pract. 2003;16:95–101. doi: 10.3122/jabfm.16.2.95. [DOI] [PubMed] [Google Scholar]
- 11.Galić J, Karner I, Cenan L, Tucak A, Hegedus I, Pasini J, et al. Comparison of digital rectal examination and prostate specific antigen in early detection of prostate cancer. Coll Antropol. 2003;27(Suppl 1):61–6. [PubMed] [Google Scholar]
- 12.Colombo T, Schips L, Augustin H, Gruber H, Hebel P, Petritsch PH, et al. Value of transrectal ultrasound in preoperative staging of prostate cancer. Minerva Urol Nefrol. 1999;51:1–4. [PubMed] [Google Scholar]
- 13.Tan CH, Wei W, Johnson V, Kundra V. Diffusion-weighted MRI in the detection of prostate cancer: Meta-analysis. AJR Am J Roentgenol. 2012;199:822–9. doi: 10.2214/AJR.11.7805. [DOI] [PMC free article] [PubMed] [Google Scholar]
- 14.Valluru KS, Chinni BK, Rao NA. Photoacoustic imaging: Opening new frontiers in medical imaging. J Clin Imaging Sci. 2011;1:24. doi: 10.4103/2156-7514.80522. [DOI] [PMC free article] [PubMed] [Google Scholar]
- 15.Vaupel P, Kelleher DK. Blood flow and oxygenation status of prostate cancers. Adv Exp Med Biol. 2013;765:299–305. doi: 10.1007/978-1-4614-4989-8_42. [DOI] [PubMed] [Google Scholar]


