Abstract
Objective:
The UNAIDS modes of transmission model (MoT) is a user-friendly model, developed to predict the distribution of new HIV infections among different subgroups. The model has been used in 29 countries to guide interventions. However, there is the risk that the simplifications inherent in the MoT produce misleading findings. Using input data from Nigeria, we compare projections from the MoT with those from a revised model that incorporates additional heterogeneity.
Methods:
We revised the MoT to explicitly incorporate brothel and street-based sex-work, transactional sex, and HIV-discordant couples. Both models were parameterized using behavioural and epidemiological data from Cross River State, Nigeria. Model projections were compared, and the robustness of the revised model projections to different model assumptions, was investigated.
Results:
The original MoT predicts 21% of new infections occur in most-at-risk-populations (MARPs), compared with 45% (40–75%, 95% Crl) once additional heterogeneity and updated parameterization is incorporated. Discordant couples, a subgroup previously not explicitly modelled, are predicted to contribute a third of new HIV infections. In addition, the new findings suggest that women engaging in transactional sex may be an important but previously less recognized risk group, with 16% of infections occurring in this subgroup.
Conclusion:
The MoT is an accessible model that can inform intervention priorities. However, the current model may be potentially misleading, with our comparisons in Nigeria suggesting that the model lacks resolution, making it challenging for the user to correctly interpret the nature of the epidemic. Our findings highlight the need for a formal review of the MoT.
Keywords: HIV epidemic, mathematical modelling, most-at-risk-populations, Nigeria, UNAIDS
Introduction
Mathematical modelling has helped increase our understanding of the HIV epidemic and played a key role in decision-making [1–4]. UNAIDS developed a series of simple mathematical models, to help countries understand their current epidemic [5–7]. The Modes of Transmission (MoT) model is one such model. It is a deterministic static compartmental model, used to estimate the distribution of new HIV infections in different population subgroups based on information about their current HIV prevalence and behavioural patterns. So far, 29 countries have analysed their HIV epidemic using the MoT model [8], with the results being used to help guide interventions [8,9].
The MoT model divides the population into subgroups that represent the percentage of individuals in the population who ascribe to a certain type of behaviour or identity, related to their ‘risk’ of acquiring HIV. In this instance, ‘risk’ is dependent on: the degree of sexual contact or injecting drug use activity that is exchanged with their partner group; the HIV prevalence in their partner group; the probability of acquiring HIV through a single contact with that partner group and the percentage of sexual or injecting acts which are protected (through condom use or sterile needles). Some individual's have multiple partner groups, but in the MoT, acquisition of HIV is only characterized through the partner group with the highest transmission risk. The HIV transmission pathways were all predefined by the model's authors.
Although this compartmentalization of the population is a standard approach in deterministic modelling, most deterministic models usually take into account multiple exposures, unlike the current MoT. The predefined structure for the MoT may be overly simplistic, especially in settings with important heterogeneities within subgroups. For example, in many settings there are distinct subgroups of sex workers, such as ‘brothel-based’ and ‘street-based’, that have different numbers of sexual partners and condom use, and so potentially different HIV risks [10].
Although there are many benefits to having a relatively simple MoT model, there is the risk that the model simplicity and inherent assumptions about patterns of sexual mixing, produces misleading findings [8]. The aggregation may also lead to a masking of key population subgroups that are particularly vulnerable to HIV infection, which should be targeted by HIV programming interventions. There is also a danger of it becoming a ‘black box’ process [11], in which the findings are taken at face value, without sufficient appreciation of how the underlying assumptions and simplifications may influence the incidence projections obtained.
Given the widespread use of the MoT to inform decision making, the aim of this study was to compare the MoT model projections for Cross River, a Nigerian state with a low-level generalized HIV epidemic of 8%, with a revised MoT model that incorporates additional heterogeneity and updated parameters. An intermediate model, which employs the revised model structure, but retains the original model parameters, is used to illustrate the incremental effect of incorporating additional model complexity, and revising and updating the parameter estimates.
Methods
The modes of transmission model
The model is designed to calculate the number of new HIV infections within a 12-month period among different population subgroups, based on the current distribution of infections in the population. Biological and behavioural surveillance data, supplemented by the broader scientific literature, are used to develop setting-specific model input parameters.
To estimate the risk of infection for a susceptible individual, the model uses an established mathematical equation that estimates the probability of HIV acquisition (appendix C), if the individual has a given number of sexual partners from a particular (population) subgroup and a specified number of sex acts with those partners [9]. An estimate of the number of incident infections is generated by multiplying the risk of infection by the number of susceptible individuals at risk in a subgroup. In the original MoT model, the total adult population (commonly taken to be 15–49 year olds) is divided into 11 subgroups and disaggregated by sex. HIV transmission probabilities are per act estimates and are based on the published literature [12]. The presence of sexually transmitted infections (STIs) in the partner group adds a multiplicative effect to an individual's risk of HIV acquisition [13]. The partially protective effect of male circumcision is incorporated [12]. Finally, the model is calibrated, by adjusting the HIV prevalence in certain risk groups to the antenatal care (ANC) prevalence for that particular setting, so the weighted average across all risk groups (men and women) matches the HIV ANC prevalence. The model therefore enables estimates for the total percentage of new infections in different population subgroups to be calculated.
‘Original’ modes of transmission modelling analysis for Cross River state
An MoT modelling analysis [14], was conducted in 2009 in Cross River state, located in the south of Nigeria with a population of 2.1 million aged 15–49 years. Survey data from 2008 estimates an ANC HIV prevalence of 8%, making Cross River the fifth highest HIV prevalence state in the country [15]. For this study, state level data were used where available, and otherwise data from states in the same geopolitical zone or national-level data were applied. The size of the population was based on the 2008 Demographic Health Survey [16] and 2007 National HIV/AIDS and Reproductive Health Survey Plus (NARHS+) [17]. The STI prevalence in different population subgroups was based on survey data on the reported presence of unusual genital discharge or genital ulcer in the past 12 months [10,16]. Total numbers of sex acts reported by one population subgroup were not equalized with their partner group. The original MoT indicates that sex acts between clients and FSW should be equal, in this case however this instruction is not followed. This limitation in the MoT may lead to an over-estimate of HIV infections for some subgroups and an under-estimate for others. Full details of the methods and data sources used are in Table 1, Appendix D. The behavioural and biological parameter tables for the model are provided in Appendix E. The original model was calibrated to ANC prevalence for Cross River state, 8%, for both male and female groups.
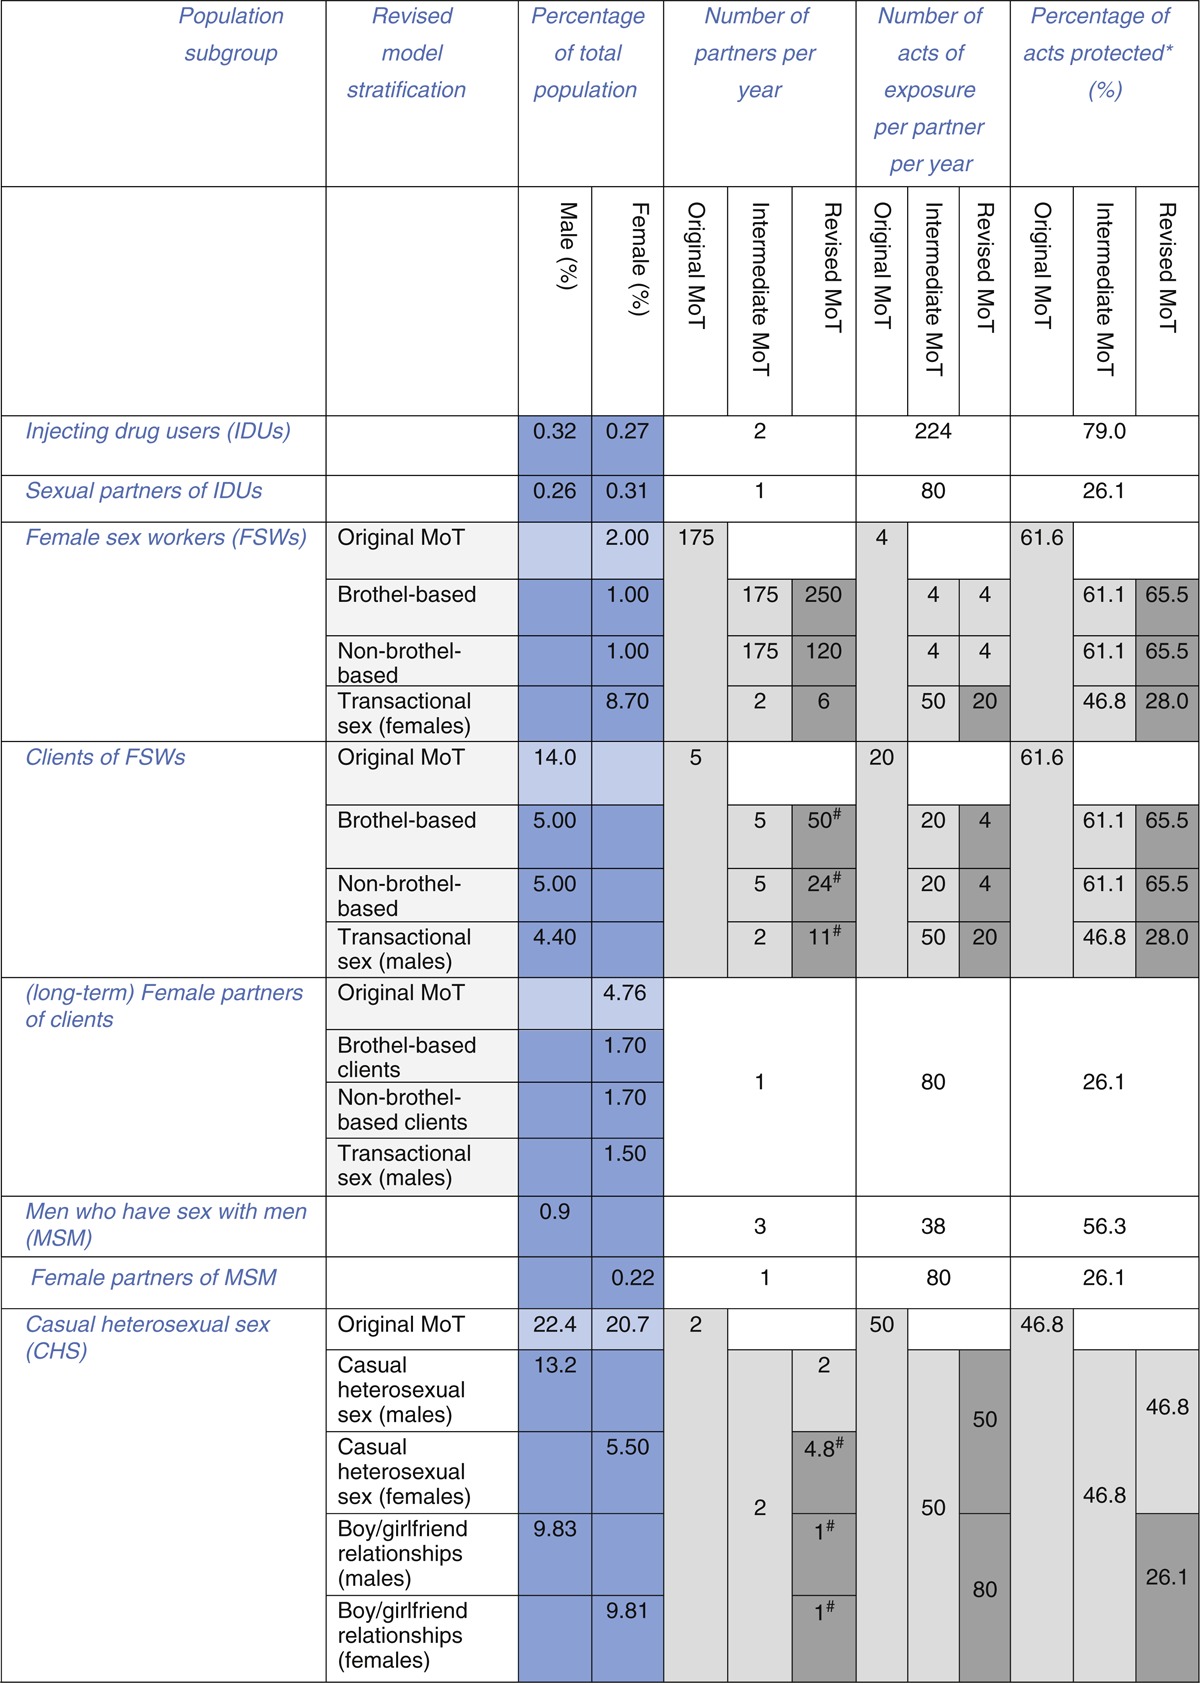
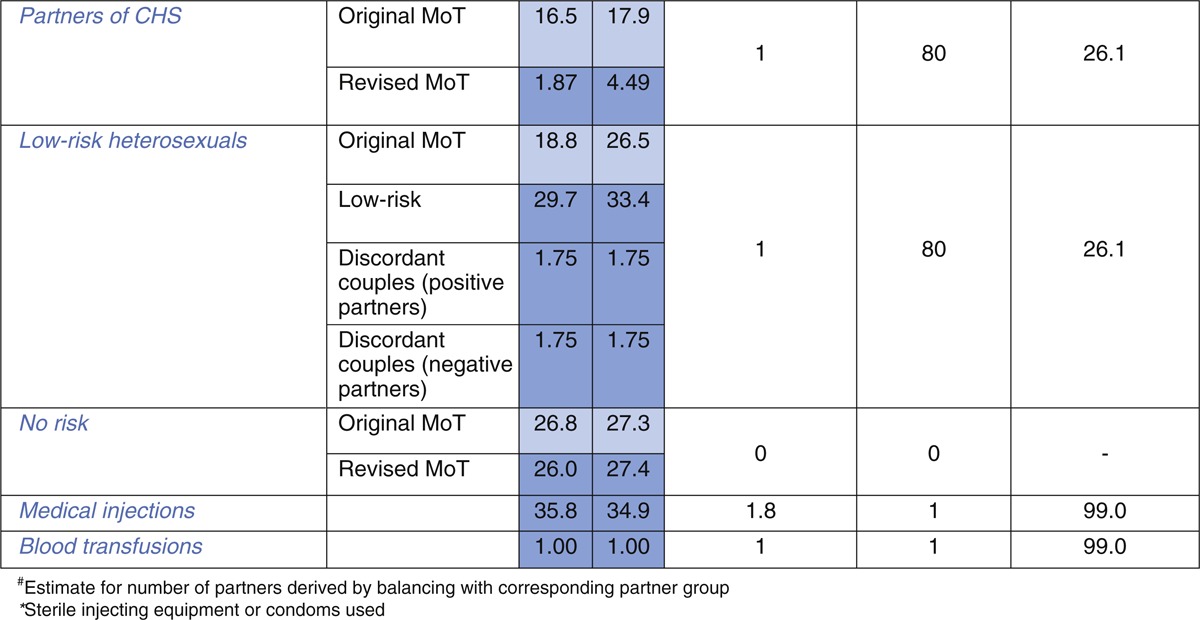
Table 1.
(a) Behavioural parameter estimates for the original, intermediate and revised MoT models.
Revision of the modes of transmission model for Cross River state
The MoT model was revised to incorporate additional heterogeneity using data from the NARHS 2007+ [17], HIV/AIDS Integrated Biological and Behavioural Surveillance Survey 2007 [10] and wider literature. Figure 1 summarizes the revisions made, showing how some of the original subgroups were divided into smaller subgroups or fed into different subpopulation categories. Based upon a review of the literature, the revised model included a new group called ‘women involved/engaged in transactional sex’ to represent women ‘who have sex for cash, gifts or favours’ but who would not necessarily identity themselves as ‘sex workers.’ Research from Nigeria indicates that this type of behaviour is prevalent [18–20]. The subgroup is formed from the ‘casual heterosexual sex (CHS)’ group in the original model, although their involvement in the transactional exchange of money for sex and contact with multiple sexual partners place them at higher risk of HIV infection than those in the CHS group. In addition we subdivided the ‘sex worker’ group into ‘brothel-based’ and ‘non-brothel-based’ FSWs because most surveys in Nigeria distinguish FSWs in this way. We established separate FSW client groups for each.
Fig. 1.
Schematic overview illustrating the structural changes to the modes of transmission (MoT) model, for the original model, intermediate and revised versions (including revisions to subgroup sizes for each model).
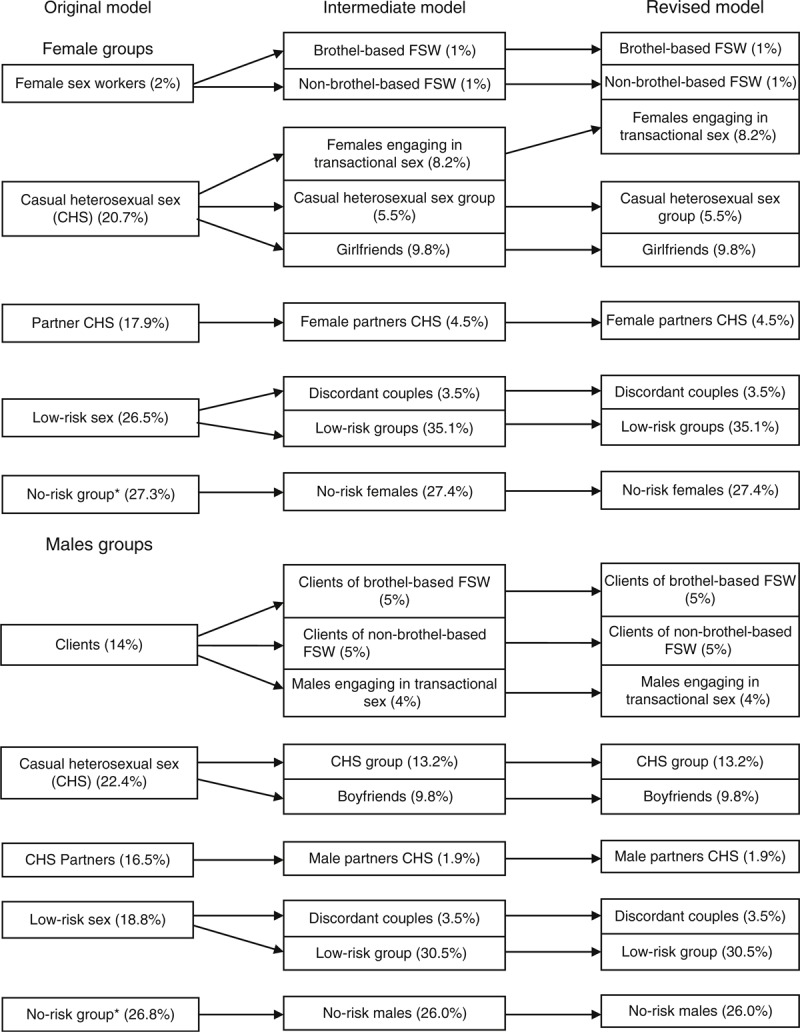
∗No risk individuals are those who report no sexual intercourse or injecting drug use in the past 12 months. The figure does not include MSM, IDUs and any of the partners of the most-at-risk-populations (MARPs) groups, as these were not revised.
Revised size estimates for the subgroups from the original model led to an increase in the estimated size of the ‘low-risk’ population for women from 26.5 to 38.6% and men ‘from 18.8 to 34%, with estimates for ‘partners of those engaged in casual heterosexual sex (partners CHS)’ revised down because the NARHS 2007+ survey suggested the percentage of individuals engaging in ‘CHS’ is lower than in the original model. Individuals who were originally in the ‘partners CHS’ subgroup were redistributed to the ‘low-risk’ group in the revised MoT. In the original model, those in the CHS subgroup were defined as individuals who report ‘nonmarital’ sex, but in the revised model we reclassified them as individuals who report ‘more than one marital or nonmarital partner’ in a 12-month period [17], as many individuals have nonmarital relationships but do not have multiple partners. For individuals in nonmarital relationships with a single partner, we created additional subgroups called ‘boyfriend’ and ‘girlfriend’ relationships. The number of individuals receiving blood transfusions and medical injections was not revised.
The ‘low-risk’ group was divided into ‘discordant’ partnerships/couples, defined as heterosexual monogamous relationships in which one partner is HIV positive and the other HIV negative. The estimate for the size of this population is based on a previous study [21]. The remaining individuals in this subgroup are considered as being very ‘low-risk’. They represent sexually active individuals in the population who are in stable relationships in which both partners are assumed to be either HIV negative or HIV positive. The prevalence in the ‘low-risk’ group may be adjusted to match the ANC prevalence in the setting, for model calibration purposes, but with no new infections being attributed to this subgroup.
In the revised model, the total number of sex acts offered by a subgroup was balanced between partner groups by adjusting the number of partners (n) in the corresponding subgroup, while assuming the number of contacts per partner (α) was equal between groups. As there is more data available on the number of partners of brothel-based and street-based FSW, we used a triangulation method to calculate the number of partners their client groups have. For the CHS groups, we used the estimate from the original MoT of two partners and 50 sex acts for men, and calculated the number of female CHS partners based on the assumption that they too have 50 sex acts with male partners.
The revised model was calibrated to an 8% HIV prevalence from ANC data and incidence projections were cross-referenced with projections (0.0025 for Nigeria) from the UNAIDS global report [22], which equates to approximately 5000–5500 new infections.
Modes of transmission: intermediate model
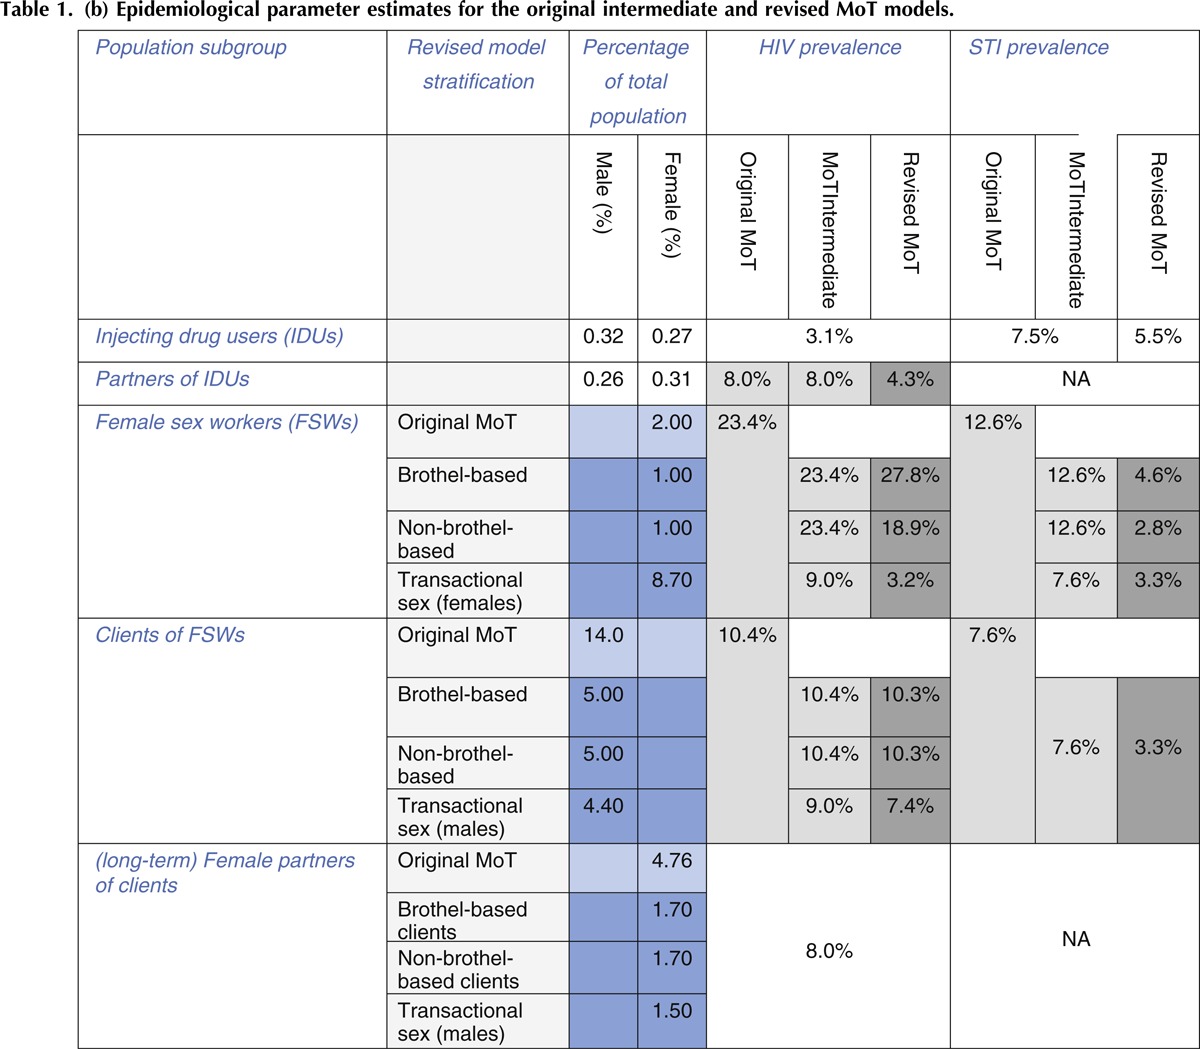
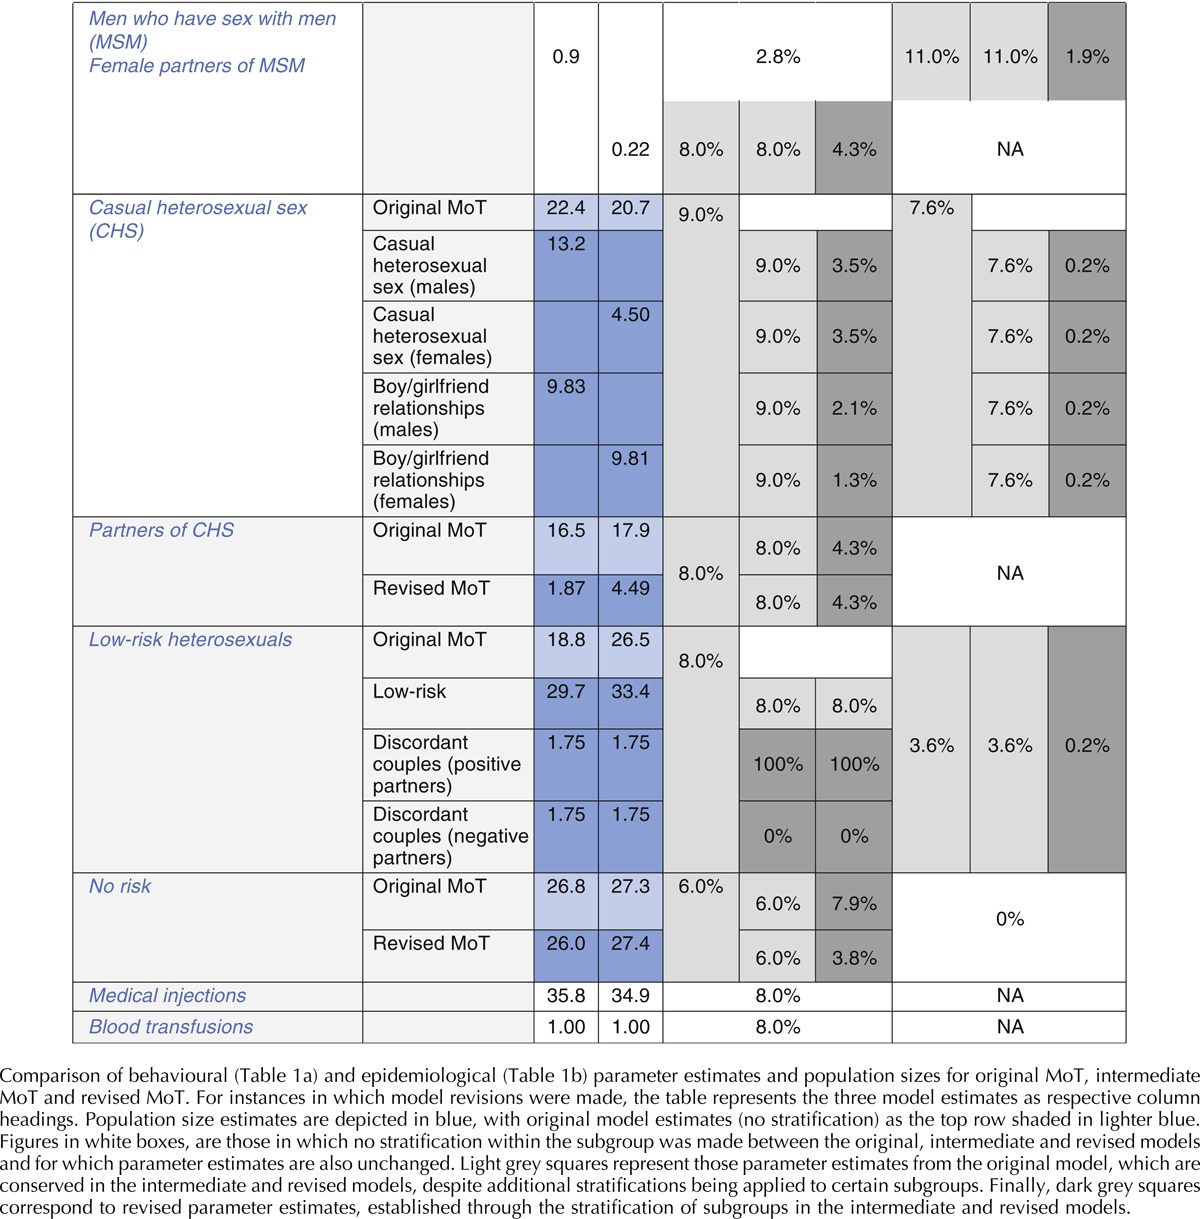
An intermediate MoT, with the revised model structure and original parameter estimates was developed. This model contains the revised population estimates for the stratified subgroups from the revised model but maintains the same behavioural and epidemiological estimates as the original model. Table 1(a) compares and summarizes the behavioural parameter estimates across all three models and Table 1(b) the epidemiological parameter estimates. As in the original model, for the intermediate model, balancing of sex act numbers between subgroups was ignored.
The revision to the model structure allows for a comparison of model projections between the original and revised MoT. As the intermediate model uses the revised structure and revised population size estimates it is not possible to draw a direct comparison of the effect of changing the structure because of changes to population sizes and additional risks. However, it does allow for an overview of additional heterogeneity present within individual subgroups. The comparison between the intermediate and revised model is more direct, because only parameter estimates are updated. Therefore, the effects of disaggregating subgroups and including different risk behaviours is shown here.
Categorization of population subgroups
To assess the distribution of HIV infections in different key population subgroups from an HIV programming perspective, we grouped the population into categories in order to compare the findings from the original versus the revised MoT.
In the original model we classified sex workers, clients, men who have sex with men (MSM) and injecting drug users (IDUs) as ‘most-at-risk-populations’ (MARPs). In the revised model the MARPs included the brothel-based FSW, non-brothel-based FSW, MSM, IDUs, FSW clients and men and women involved in transactional sex. Subgroups that form partnerships with MARPs were termed ‘partners of MARPs’, these included female partners of MSM, sexual partners of IDUs and regular female partners of FSW clients in the original model. For the revised model, regular female partners of men involved in transactional sex were additionally included in this category. Subgroups not directly connected through sexual or injecting contact with high or medium-risk groups were categorized as ‘general population’ groups. In the original and revised model, these included the low-risk group, the CHS subgroup and partners of CHS subgroup. In the revised model, the ‘boyfriend’ and ‘girlfriend’ subgroups were also included as ‘general population’ groups. Finally, discordant couples, who are not explicitly recognized in the original model were assigned their own category in the revised MoT to assess the importance of this group for HIV programming purposes.
Evaluation of parameter estimates and methods for sensitivity analysis
In order to assess the robustness of model projections a detailed sensitivity analysis was conducted, for all parameter estimates. Latin Hypercube Sampling was used to generate 10 000 random parameter sets using uniform distributions for all parameters. For the majority of behavioural and epidemiological parameters estimated from surveys within the Nigerian setting (either state level or geopolitical zone) 95% CI from the survey data were used as uncertainty bounds. For parameter estimates obtained through alternative data sources or from the wider literature, we sampled each parameter relatively ±50% to reflect the higher levels of uncertainty. Parameter sets were included if the HIV prevalence projection fell within the 95% CI uncertainty range for the ANC estimate, obtained through the 2008 sentinel surveillance survey which collected HIV data from 300 women in Cross River. Additional sampling details for all parameter estimates are provided below in Table 2.
Table 2.
Description of sampling methods used for the modes of transmission revised model sensitivity analysis, including data sources and rationale.
| Parameter | Method of sampling uncertainty |
| Population sizes | Population size estimates were sourced from the National HIV/AIDS and Reproductive Health Survey Plus (NARHS+) surveys for general population subgroups. Details on high-risk group population estimates and additional calculations are contained in appendix D, with most of these estimates conserved from the original model. Owing to the high levels of uncertainty in the size of the population estimates we sampled each parameter relatively ±50%. |
| HIV prevalence | For all HIV prevalence values estimated from survey data for Cross River state or regional estimates from NARHS+ 2007, 95% confidence interval (CI) intervals were generated and applied in the sensitivity analysis. These included all risk-groups with the exception of women engaging in transactional sex and their partners, clients of brothel-based and non-brothel-based female sex workers (FSW) and their regular female partners. Because of the greater level of uncertainty in these estimated values each parameter was varied ±50% relative to its original value. |
| STI prevalence | All estimates were generated from survey data for which 95% CI were available. For general population groups, the estimate was taken from the 2003 sentinel survey for individuals tested for syphilis. From this, 95% CI were derived based on the sample size for the south-south geopolitical zone. Sexually transmitted infection (STI) prevalence estimates for high-risk groups and clients were generated from the Integrated Biological and Behavioural Surveillance Survey (IBBSS) 2010 for reported genital ulcer/sores. This estimate was selected because no serological data were available and as it was considered that genital ulcers/sores present as more visible forms of STIs and are more likely to reflect the presence of syphilis. 95% CI were generated from the data to reflect the uncertainty in these estimates. |
| Number of partners and number of sex acts with individual partners per year | To allow for the uncertainty in the number of partners and number of sex acts with each partner for individual subgroups, all parameter estimates were varied ±50%. This was to reflect the uncertainty in these estimates and the fact that some estimates were generated through triangulation methods based on population size estimates, whereas others were based on assumptions from the original MoT model. |
| Condom usage | Estimates for condom use for clients of brothel-based and non-brothel-based FSW come from the DHS for men who report ‘payment for sex’. The same value was assumed for brothel-based and non-brothel-based FSW, as FSW in the Integrated biological and behavioural surveillance survey (IBBSS) survey report 100% condom use and this estimate was deemed to be unrealistic. Estimates for condom use in men who have sex with men (MSM) and sterile needle use for injecting drug users (IDUs) are taken from the IBBSS 2007 and all other subgroup estimates were generated using appropriate estimates from the NARHS 2007+, taking 95% CI on each occasion to generate uncertainty ranges for data sampling. |
Results
Comparisons of the original and revised modes of transmission model projections
Figure 2(a)–(c) show the projected overall distribution of HIV infections produced by the original, intermediate and revised MoT models respectively. Results from the original model show 73% of infections occur in general population subgroups, compared with 21% in MARPs. HIV prevalence in the population is estimated to be 8% and the rate of HIV infection in the 15–49 population, 0.005 per year (500 infections per 100 000 population).
Fig. 2.
Comparison using the three different modes of transmission (MoT) models for the projected distribution of new HIV infections in the population.
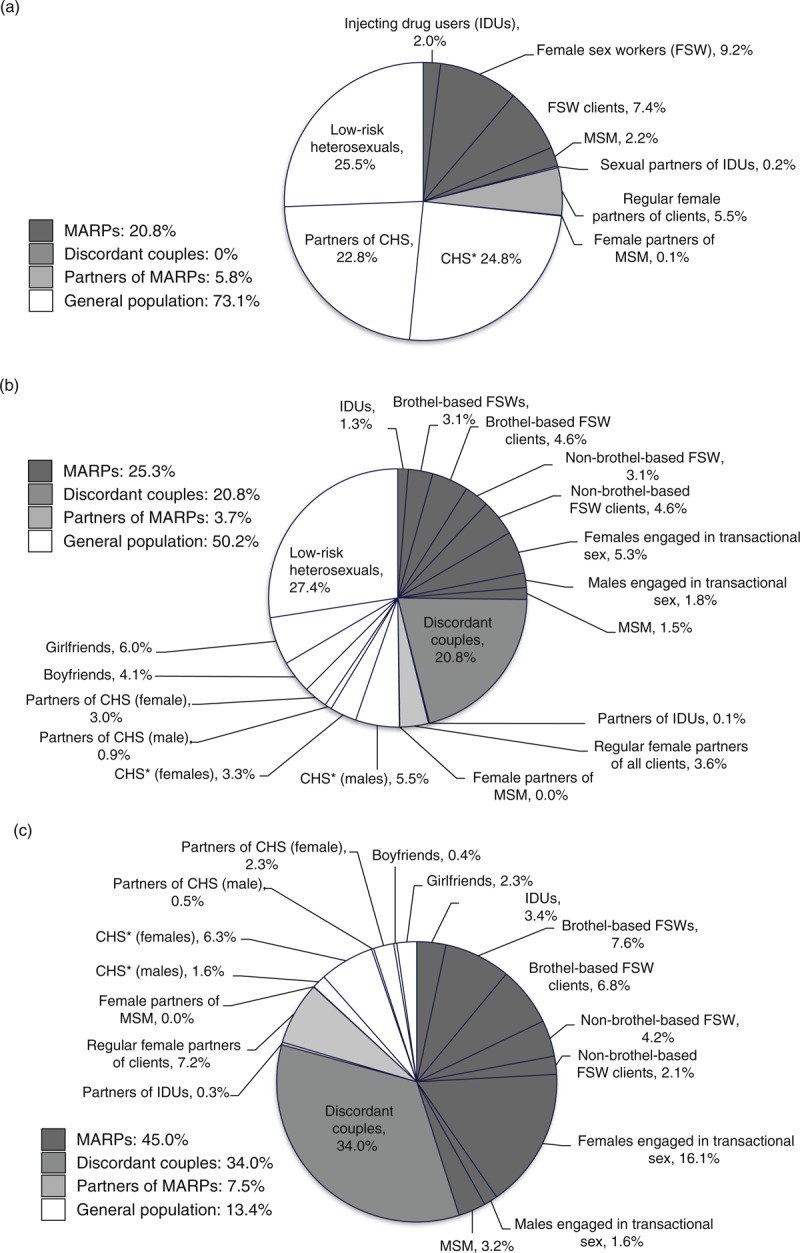
(a) shows results from the original MoT model, (b) displays results from the intermediate MoT model and (c) illustrates modelling projections for the revised MoT model. ∗CHS, casual heterosexual sex.
Following revisions to the MoT model structure through the introduction of additional subgroups, model projections are modified. The new ‘discordant couples’ group, are projected to account for 21% of all infections. The percentage of infections distributed amongst MARPs remains similar to the original model, partly as a result of maintaining the same parameter estimates. The percentage of infections in the general population subgroups is still significant, with 50% of infections occurring within this category. The overall population HIV prevalence for this model is 9.4%, 1.4% higher than the ANC HIV prevalence, with an HIV incidence rate of 0.0059 per year. The higher prevalence and incidence is largely due to infections being attributed to the ‘low-risk’ group, because of their large population size, despite the stratification of discordant partnerships away from this group.
Figure 2(c), shows the revised MoT model, including all parameter updates. The projected distribution of incident HIV infections is significantly different, with approximately 45% of infections now occurring amongst MARPs. In the revised model individuals in the low-risk group are assumed not at risk from transmitting or acquiring HIV. This lowered the number of infections in the population, resulting in a proportional redistribution to other subgroups, with discordant couples now accounting for 34% of infections instead of 21% in the intermediate model. The stratification and reparameterization of individuals involved in transactional sex, from the CHS group, is also important. We see that 23% of infections in the original MoT originate from casual heterosexual sex, whereas for the revised model the CHS and transactional sex groups combined contribute 25% of infections (with 16% arising from women engaging in transactional sex). The HIV prevalence for this scenario is 7.8% and the HIV incidence rate is 0.0031 per year.
Model sensitivity analysis
Figure 3 shows the distribution of infections amongst different subgroups as produced in the sensitivity analysis. In the revised MoT model, 18% of the sexually active 15–49 years old population were part of a MARP subgroup. Model projections suggest these groups contribute 40–75% (95% CrI) of incident HIV infections. This is in contrast to those in the general population subgroups which account for 6–24% (95% CrI) of new infections but make up 78% of the sexually active population. Interestingly, discordant couples, who constitute around 3.5% of the population, may contribute 10–46% (95% Crl) of total infections.
Fig. 3.
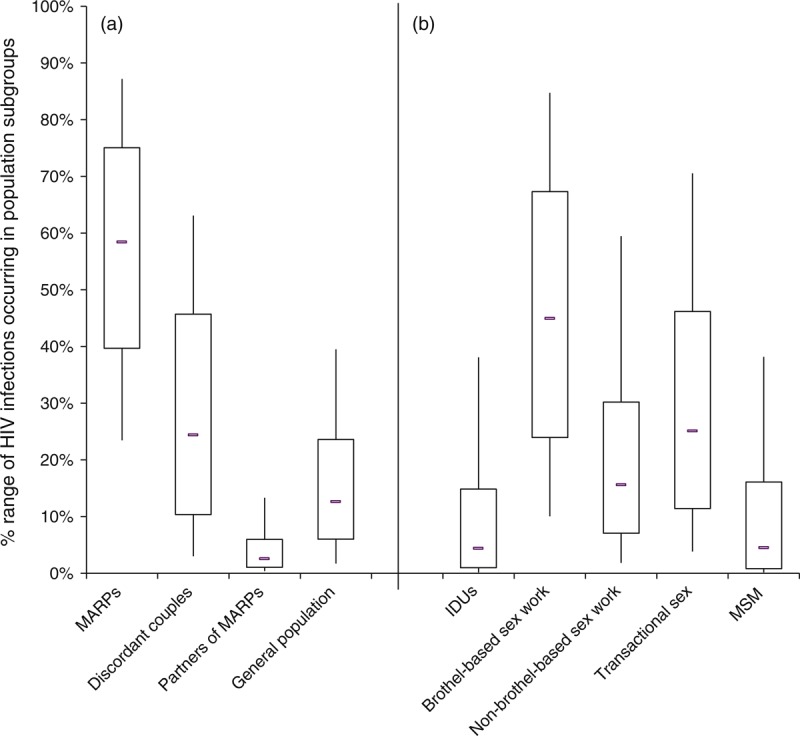
Results from the sensitivity analysis illustrating the projected percentage of infections likely to occur in different population risk categories on the left (a) and distribution of HIV infections amongst the most-at-risk-populations (MARPs) only on the right (b).
We also analysed the number of infections amongst each female sex worker (FSW) group with their respective client groups to explore the percentage of infections derived from each type of sex work, including transactional sex. Our sensitivity analysis suggests that brothel-based sex work (FSW and clients) contributes the most infections (24–67%, 95% Crl) amongst MARPs, likely to be as a result of high numbers of partners and moderate condom usage (65%). In addition, a high percentage of infections (11–46%, 95% Crl) also occur amongst those involved in transactional sex. In contrast, although still significant, fewer infections occur as a result of non-brothel-based sex work (7–30%, 95% Crl), IDUs (1–15%, 95% Crl) and MSM (1–16%, 95% Crl).
Discussion
Results from the original modelling analysis in Cross River state concluded that the HIV epidemic was generalized in nature, with the highest percentage of infections occurring through heterosexual sex amongst persons in the general population and that the majority of infections can only be curbed by targeting interventions towards general population subgroups [14].
Following model revisions to incorporate additional population subgroups, the conclusions about the distribution of new infections have changed substantially. The explicit inclusion of discordant couples into the model helps illustrate the burden of new infections that are likely to occur in these individuals. The incorporation of updated parameter estimates into the fully revised model, produces an epidemic profile with a significantly higher percentage of infections in MARPs, compared with the original modelling analysis. This more plausible scenario is due largely to the removal of the implicit assumption that all low-risk individuals have some risk of acquiring HIV, which results in high numbers of new infections occurring in the ‘low-risk’ group.
The results from the sensitivity analysis indicate that infections generated through brothel-based sex work in both FSW and their clients may be an important source of infections in this setting. However, with a high incidence of infections amongst this group, it is important to obtain better estimates of the size of the brothel-based FSW population. In the absence of more comprehensive mapping data, it is difficult to ascertain how accurate these projections are, as a smaller population may considerably lower this estimate. However, evidence from the modelling shows that continued surveillance and intervention programmes are essential for maintaining high rates of condom use and education amongst brothel-based FSW and their clients.
Transactional sex is also indicated to be an important source of new HIV infections, previously not included in the original MoT. Despite being well documented in the literature [23–27], until now mathematical models have rarely differentiated this as distinct from casual sex. However, identifying women engaging in transactional sex may be challenging because, while one-off sex acts may take place within this context, quite commonly it may be the principal motivation for on-going relationships with primary or secondary partners.
There are also challenges in identifying discordant couples. Discordant couples are often identified through ANC testing for women; however, this strategy relies on the attendance and willingness of the male partner to also test.
The high percentage of infections occurring in discordant partnerships illustrates the importance of identifying these individuals and providing effective prevention options – including condoms, early ART treatment and possibly pre-exposure prophylaxis treatment. The source of infection in a discordant couple also needs to be considered. Various studies indicate [10,28] the duration of time that women spend selling sex may be short, and similarly, it may well be that girls only engage in transactional sex for a limited duration of time, before getting married. Therefore, it is possible that many of the infections within discordant partnerships arise from infections acquired from previous partnerships [29].
Our results highlight both the challenge and importance of appropriately parameterizing the MoT model to a particular setting. The introduction of greater model complexity provides a more comprehensive and realistic insight into which population subgroups are most vulnerable to HIV infection. The original MoT report for the state suggested focusing on primarily the general public groups, while also continuing to target high-risk groups such as FSWs [30]. For Cross-River State, our findings suggest most new HIV infections will occur among MARPs, and so effective prevention strategies need to be delivered to these groups as a priority. However, there is a requirement for sufficient data to be available before using the revised model. As demonstrated by the intermediate MoT analysis, unless more due care is taken in model parameterization, the user is likely to generate misleading results. In addition the results of the analysis should be used as a guide rather than a platform on which to inform policy, as cost-analyses and epidemiological reviews of the setting must also be taken into consideration.
The UNAIDS MoT remains an accessible and potentially a useful model that can inform intervention priorities in different settings. However, our findings suggest that the current model may produce misleading findings, especially in concentrated or low-level generalized HIV epidemic settings, such as Cross River. Our analyses for Nigeria illustrate that the current model may underestimate the importance of different vulnerable groups, including girls involved in transactional sex and brothel-based sex work. We suspect that problems with the MoT model projections will be most significant for less generalized HIV epidemic settings, although further research to explore this question for other settings is needed. Nevertheless, our findings point to the need for UNAIDS to formally review and revise the MoT model.
Acknowledgements
H.P.: Lead author. Responsible for development of storyline and design of study, including re-parameterization of model and comparative analysis. Developed main body of text.
C.W.: Strong contribution to design of study, including key ideas evolving from the article. Reviewed drafts of article, including final draft.
N.B.: Contributed and resourced key data estimates for parameterization of model. Provided insight into story line, assisted in writing of all sections of article and reviewed final draft of article.
L.H.: Advised on storyline of article and provided insights into key messages. Reviewed multiple drafts including final draft of article.
M.O.: Advised and provided data sources for parameterization of model and provided key insights into the context of the setting to allow model structure development. Reviewed and provided feedback on final draft of article.
A.M.: Advised and provided data sources for parameterization of model. Reviewed and approved final draft of article.
J.B.: Advised and provided data sources for parameterization of model. Developed ideas for model comparison and suggested location setting for comparison. Reviewed drafts of article, including final draft.
P.V.: Provided input to structure of storyline, key messages and themes. Advised on model structure and development. Reviewed and provided feedback on drafts of article, including final draft and assisted in writing of key sections of text.
A.F.: Provided input to structure of storyline, key messages and themes. Key role in deciding the choice of setting for comparison and assisted in model parameterization and sensitivity analysis. Reviewed multiple drafts of article, assisted in writing and development of sections of text and reviewed and approved final article.
Additional thanks to Marelize Gorgens, of The World Bank, Global HIV/AIDS Program for her helpful insights and support in developing this work.
Funding for this work comes from the Bill and Melinda Gates Foundation via a subcontract through Imperial College through the HIV Modelling Consortium, and from UKAID, as part of the STRIVE, Structural Drivers HIV Research Consortium.
Conflicts of interest
There are no conflicts of interest.
Supplementary Material
Footnotes
Correspondence to Holly J. Prudden, MSc, London School of Hygiene and Tropical Medicine, London, UK.
References
- 1.Anderson RM, Garnett GP. Mathematical models of the transmission and control of sexually transmitted diseases. Sex Transm Dis 2000; 27:636–643 [DOI] [PubMed] [Google Scholar]
- 2.Anderson RM, Gupta S, Ng W. The significance of sexual partner contact networks for the transmission dynamics of HIV. J Acquir Immune Defic Syndr 1990; 3:417–429 [PubMed] [Google Scholar]
- 3.Boily MC, Lowndes CM, Vickerman P, Kumaranayake L, Blanchard J, Moses S, et al. Evaluating large-scale HIV prevention interventions: study design for an integrated mathematical modelling approach. Sex Transm Infect 2007; 83:582–589 [DOI] [PMC free article] [PubMed] [Google Scholar]
- 4.Regan DG, Wilson DP. Modelling sexually transmitted infections: less is usually more for informing public health policy. Trans R Soc Trop Med Hyg 2008; 102:207–208 [DOI] [PubMed] [Google Scholar]
- 5.UNAIDS and The World Bank New HIV infections by mode of transmission in West Africa: A multicountry analysis. 2010 [Google Scholar]
- 6.Pisani E, Garnett GP, Grassly NC, Brown T, Stover J, Hankins C, et al. Back to basics in HIV prevention: focus on exposure. BMJ 2003; 326:1384–1387 [DOI] [PMC free article] [PubMed] [Google Scholar]
- 7.UAC/UNAIDS Uganda: HIV prevention response and modes of transmission analysis. 2009, Uganda AIDS Commission, UNAIDS [Google Scholar]
- 8.Case KK, Ghys PD, Gouws E, Eaton JW, Borquez A, Stover J, et al. Estimating the sources of new HIV infections: Recommendations for the current Modes of Transmission modelling approach and its use in decision making. Bull World Health Organ 2012 [Google Scholar]
- 9.UNAIDS Modelling the expected short-term distribution of incidence of HIV infections by exposure group. 2007; http://www.unaids.org/en/media/unaids/contentassets/restore/20090407_modeoftransmission_manual2007_en.pdf [Accessed on 26 July 2013] [Google Scholar]
- 10.Federal Ministry of Health Results from HIV/STI Integrated Biological and Behavioural Surveillance Survey (IBBSS), 2007 [Google Scholar]
- 11.Garnett GP. An introduction to mathematical models in sexually transmitted disease epidemiology. Sex Transm Infect 2002; 78:7–12 [DOI] [PMC free article] [PubMed] [Google Scholar]
- 12.Powers KA, Poole C, Pettifor AE, Cohen MS. Rethinking the heterosexual infectivity of HIV-1: a systematic review and meta-analysis. Lancet Infect Dis 2008; 8:553–563 [DOI] [PMC free article] [PubMed] [Google Scholar]
- 13.Gray RH, Wawer MJ, Brookmeyer R, Sewankambo NK, Serwadda D, Wabwire-Mangen F, et al. Probability of HIV-1 transmission per coital act in monogamous, heterosexual, HIV-1-discordant couples in Rakai, Uganda. Lancet 2001; 357:1149–1153 [DOI] [PubMed] [Google Scholar]
- 14.Mbukpa M, Ekeoba P, Omang P, Nwankwo E, Adebayo S, Adebajo S, et al. HIV modes of transmission in Cross River State, 2010, Cross River State AIDS Control Agency. Department for International Development (DFID); Nigeria: 2010 [Google Scholar]
- 15.UNAIDS and National Agency for the Control of AIDS (NACA) United Nations General Assembly Special Session (UNGASS) Country Progress Report, 2010 [Google Scholar]
- 16.National Population Commission (NPC) [Nigeria] and ICF Macro, Nigeria Demographic and Health Survey 2008, 2009: Abuja [Google Scholar]
- 17.Federal Ministry of Health National HIV/AIDS and Reproductive Health Survey 2007 (NARHS Plus), Nigeria, 2008: Abuja [Google Scholar]
- 18.Erinosho O, Isiugo-Abanihe U, Joseph R, Dike N. Persistence of risky sexual behaviours and HIV/AIDS: evidence from qualitative data in three Nigerian communities. Afr J Reprod Health 2012; 16:113–123 [PubMed] [Google Scholar]
- 19.Owoaje ET, Uchendu OC. Sexual risk behaviour of street youths in south west Nigeria. East Afr J Public Health 2009; 6:274–279 [PubMed] [Google Scholar]
- 20.Cooper ML, Barber LL, Zhaoyang R, Talley AE. Motivational pursuits in the context of human sexual relationships. J Pers 2011; 79:1031–1066 [DOI] [PubMed] [Google Scholar]
- 21.Chemaitelly H, Cremin I, Shelton J, Hallett TB, Abu-Raddad LJ. Distinct HIV discordancy patterns by epidemic size in stable sexual partnerships in sub-Saharan Africa. Sex Transm Infect 2012; 88:51–57 [DOI] [PMC free article] [PubMed] [Google Scholar]
- 22.UNAIDS UNAIDS report on the Global AIDS Epidemic 2010. 2010; Available from: http://www.unaids.org/globalreport/Global_report.htm [Accessed on 26 July 2013] [Google Scholar]
- 23.Moore AM, Biddlecom AE, Zulu EM. Prevalence and meanings of exchange of money or gifts for sex in unmarried adolescent sexual relationships in sub-Saharan Africa. Afr J Reprod Health 2007; 11:44–61 [PMC free article] [PubMed] [Google Scholar]
- 24.Jewkes R, Dunkle K, Nduna M, Shai NJ. Transactional sex and HIV Incidence in a cohort of young women in the stepping stones trial. AIDS Clin Res 2012; 13: [Google Scholar]
- 25.Gukurume S. Transactional sex and politics of the belly at tertiary educational institutions in the era of HIV and AIDS: a case study of Great Zimbabwe University and Masvingo Polytechnical College. J Sustainable Dev Africa 2011; 13: [Google Scholar]
- 26.Leclerc-Madlala S. Transactional sex and the pursuit of modernity. Soc Dynam 2003; 29:213–233 [Google Scholar]
- 27.Stoebenau K, Nixon S, Rubincam C, Willan S, Zembe Y, Tsikoane T, et al. More than just talk: the framing of transactional sex and its implications for vulnerability to HIV in Lesotho, Madagascar and South Africa. Globalization Health 2011; 7:34. [DOI] [PMC free article] [PubMed] [Google Scholar]
- 28.Federal Ministry of Health Nigeria Integrated Biological and Behavioural Surveillance Survey. 2010 [Google Scholar]
- 29.Fazito E, Cuchi P, Mahy M, Brown T. Analysis of duration of risk behaviour for key populations: a literature review. Sex Transm Infect 2012; 88 Suppl 2:i24–i32 [DOI] [PMC free article] [PubMed] [Google Scholar]
- 30.Cross River State HIV Modes of Transmission and Prevention Response Analysis. 2010 [Google Scholar]
Associated Data
This section collects any data citations, data availability statements, or supplementary materials included in this article.


