Short abstract
The false vocal folds are hypothesized to affect the laryngeal flow during phonation. This hypothesis is tested both computationally and experimentally using rigid models of the human larynges. The computations are performed using an incompressible Navier–Stokes solver with a second order, sharp, immersed-boundary formulation, while the experiments are carried out in a wind tunnel with physiologic speeds and dimensions. The computational flow structures are compared with available glottal flow visualizations and are employed to study the vortex dynamics of the glottal flow. Furthermore, pressure data are collected on the surface of the laryngeal models experimentally and computationally. The investigation focuses on three geometric features: the size of the false vocal fold gap; the height between the true and false vocal folds; and the width of the laryngeal ventricle. It is shown that the false vocal fold gap has a significant effect on glottal flow aerodynamics, whereas the second and the third geometric parameters are of lesser importance. The link between pressure distribution on the surface of the larynx and false vocal fold geometry is discussed in the context of vortex evolution in the supraglottal region. It was found that the formation of the starting vortex considerably affects the pressure distribution on the surface of the larynx. The interaction of this vortex structure with false vocal folds creates rebound vortices in the laryngeal ventricle. In the cases of small false vocal fold gap, these rebound vortices are able to reach the true vocal folds during a time period comparable with one cycle of the phonation. Moreover, they can create complex vorticity patterns, which result in significant pressure fluctuations on the surface of the larynx.
Keywords: false vocal fold, larynx geometry, glottal flow, immersed boundary method, wind tunnel
1. Introduction
False vocal fold (FVF) activities exist in both normal and pathological phonations [1], yet a complete understanding about the role of FVFs, even in normal phonation, is lacking. A better understanding of the effect of this pair of tissues on the glottal flow will yield insight into human phonation and can aid speech pathologists with better assessment of normal and abnormal phonation, which results in improved diagnosis and treatment for speech disorders.
The main sources of sound in the human larynx are produced by the vibration of the true vocal folds (TVFs). The FVFs are the first obstruction located above the glottis, and the sinuous space formed between the TVFs and the FVFs is called the laryngeal ventricle (Fig. 1). The geometry, positioning, and viscoelastic properties of the FVFs are gender-dependent [2], where the stiffness of the FVF tissue for males is reported to be approximately twice that of female FVF tissue [3]. Moreover, the TVFs are stiffer than the FVFs and have a smaller viscosity [4]. Therefore, the FVFs barely vibrate in normal phonation, although their vibration is employed in specific singing styles [5–8] and could also be involved in pathological phonation, such as ventricular dysphonia [9–11]. Moreover, this pair of tissues is a part of the articulation during the pronunciation of /i/, glottal stops [12], and their adduction is employed to produce specific tones in the Northern Vietnamese language [13]. Clinical observations also indicate that the vibration of the supraglottic structures can be utilized as a compensatory mechanism to provide the source of sound in patients with glottal incompetence [1,14,15]. Vibration of the medial edge of the FVFs is hypothesized to provide better voice quality in children who suffer from voice disorders after airway reconstruction [14], although current knowledge in these regards is poor and further investigation is required.
Fig. 1.
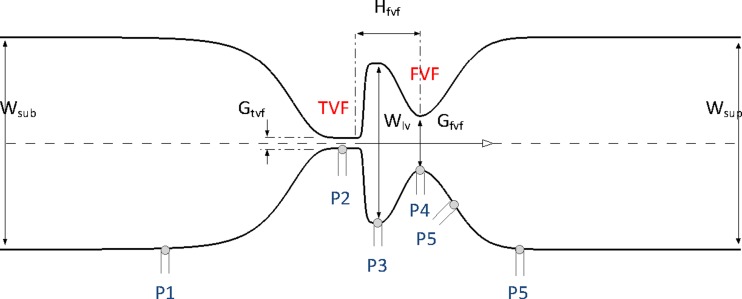
Schematic view of the laryngeal models, W sub = width of subglottal region, W sup = width of supraglottal region, WVL = width of ventricle of the larynx, Hfvf = height between FVFs and TVFs, Gtvf = TVF gap, Gfvf = FVF gap. Gtvf = 1 mm and W sub = W sup = 20 mm are constant for all models. The location of the pressure taps on the surface of the experimental models is shown in the lower side of the larynx.
Particle image velocimetry (PIV) measurements of the glottal flow using flexible and static models of TVFs demonstrate that the FVFs could affect the glottal jet [16–18]. Furthermore, the widely accepted understanding of the FVFs is that the normal positioning of the FVFs in the larynx reduces the transglottal resistance compared to the larynges without this pair of tissues. This functionality is due to the fact that this pair of tissues could straighten or stabilize the glottal jet flow and consequently delay the transition of the laminar glottal jet flow to turbulence [17,19–22]. However, available computational and experimental results about the role of the FVFs in phonation have been mostly obtained using normal size and positioning of this pair of tissues. Hence, investigations about the influence of the shape and the size of the FVFs are limited. Kucinschi et al. [19] considered two sizes for the FVF gap (Gfvf) and the height between the TVFs and FVFs (Hfvf). They reported that the glottal jet for a narrow Gfvf was straighter and its Strouhal number was lower in comparison with the model with wide Gfvf. Moreover, the Strouhal number was independent of Hfvf for wide size of Gfvf, and its value dropped slightly as the size of Hfvf was decreased. Alipour et al. [23] showed that the medial compression of the FVFs of excised canine larynges resulted in higher differential glottal resistance. They also provided evidence that the absence of supraglottic structures could significantly affect the vibratory pattern of the TVFs and, in extreme conditions, result in unstable oscillation of the vocal folds. In a more recent study on the canine larynges [24], it was found that the FVFs can vibrate in-phase or out-of-phase with the TVFs and the pressure in the laryngeal ventricle is considerably affected by the motion of the FVFs rather than the TVFs. Li et al. [20] used static models of the larynx to study the effect of Gfvf on the surface of the larynx with a divergent, parallel, and convergent glottis with a minimum TVF gap (Gtvf) of 0.06 cm in a wind tunnel. The smallest flow resistance was found for the models for which the ratio of the Gfvf to Gtvf was 1.5–2. All these studies are limited to experimental investigations with focus on influence of Gfvf and/or Hfvf, and the possible influences of the width of the laryngeal ventricle (Wlv) on phonation remain uninvestigated.
The glottal flow past the laryngeal ventricle can be perceived as a type of open cavity flow, where the jet flow can be strong enough to bridge the distance between the TVFs and FVFs. It is known that impingement of the jet flow spanning over an open cavity with its trailing edge creates an acoustic source. If the flow persists for a sufficient time interval, the acoustic waves from this source can propagate and intensify the shear layer instabilities in the leading edge of the cavity. The growth of these instabilities forms vortical structures in the shear layer of the jet flow, and the impingement of these flow structures creates additional sources of sound [25]. Computational studies of Zhang et al. [26] showed that the reattachment of the glottal jet flow with the FVFs created dipole acoustic sources. Medial compression of the FVFs in excised larynx experiments of Alipour et al. [23] increased the sound intensity. Nevertheless, the theoretical investigation of McGowan and Howe [27] suggested the presence of the FVFs had a small impact on acoustic output of the larynx. Available literature on flow structures in open cavities have been thoroughly studied at high Reynolds number, turbulent, and compressible cavity flows, but few studies exist for moderate Reynolds number incompressible cavity flows [28]. These studies have focused primarily on rectangular geometries of different aspect ratios, though a recent experimental study showed that the shape of the cavity can considerably affect the flow structures in an open cavity [29].
In the current work, glottal flow is simulated using an incompressible Navier–Stokes solver with a second order, sharp, immersed-boundary formulation. This allows us to provide detailed information about the glottal flow dynamics and pressure distribution on the surface of the larynx at locations for which experimental flow visualization and pressure measurements are either complicated or even impossible. As opposed to the majority of the previous studies that mainly compared larynges with and without the FVFs, the computational simulations are carried out for laryngeal models with the FVFs while aiming to understand the effect of different Gfvf, Hfvf, and Wlv on the glottal flow in the physiological ranges reported by Agarwal et al. [2]. Due to the increasing importance of the size of Gfvf in diagnosis of a number of voice disorders, pressure data is also collected in a low-speed wind tunnel for real-size static models of the larynx with three different Gfvf. The computational and experimental results are compared with available experimental data. Moreover, pressure distribution on the surface of the larynx is described with a focus on the evolution of the vortical structures in the laryngeal ventricle.
2. Methods
2.1. Computational Method.
The Mach number in the larynx is approximately 0.1; hence, the glottal flow can be assumed to be incompressible. The unsteady incompressible Navier–Stokes equations governing these flows are as follows:
| (1) |
| (2) |
where , p, , and are the fluid velocity, pressure, density, and kinematic viscosity, respectively. The maximum inlet velocity U and the size of the inlet boundary D can be used to nondimensionalize the Navier–Stokes equation , where the subscript * refers to nondimensional variables and the Reynolds number is .
The incompressible solver is based on a sharp, immersed-boundary formulation. In this approach, complex geometries are embedded in a fixed Cartesian grid and are represented using level-set fields [30]. The velocity-pressure coupling is treated using a four-step fractional step method. The viscous and nonlinear terms of the momentum equation are temporally integrated using second order Crank–Nicolson and Adams–Bashforth time-stepping. Grid points away from the location of the immersed interface are discretized using standard second order central finite differencing. A ghost fluid method with least-squares extrapolation is used to complete the discretization stencils of grid points for which neighboring grid points are outside the fluid domain.
The incompressible solver is implemented in an adaptive octree-based local mesh refinement (LMR) algorithm to resolve local regions with fine-scale flow structures [31]. The adaptive algorithm is fully parallelized using the Message Passing Interface library, and the mesh adaptation is dynamically load-balanced as the simulation proceeds. Additionally, the Cartesian mesh interior to the solid that is not required for the ghost fluid treatment is pruned during the initialization of the simulation for improved load-balancing and memory performance.
2.2. Experimental Apparatus.
The experiments were performed in a wind tunnel to determine the pressure distribution on the surface of the rigid models of the vocal folds. The TVFs in the models were parallel with a glottal gap of 1 mm. The distance between the TVFs and the FVFs, width of the laryngeal ventricle, and size of the FVFs gap were based on the average human vocal fold measurements provided by Agarwal et al. [2]. The values of these geometrical parameters are shown in Table 1, and the corresponding location within the larynx can be seen in Fig. 1.
Table 1.
Summary of geometrical parameters used to design the laryngeal models. C1 is the control model, which is approximately designed based on average laryngeal geometries reported by Agarwal et al. [2]. All the parameters are defined in millimeters.
| C1 | G1 | G2 | G3 | G4 | H1 | H2 | L1 | L2 | |
|---|---|---|---|---|---|---|---|---|---|
| Gfvf | 5.1 | 2.3 | 3.3 | 6.3 | 7.5 | 5.1 | 5.1 | 5.1 | 5.1 |
| Hfvf | 6.2 | 6.2 | 6.2 | 6.2 | 6.2 | 5.3 | 7.5 | 6.2 | 6.2 |
| Wlv | 15.0 | 15.0 | 15.0 | 15.0 | 15.0 | 15.0 | 15.0 | 10.3 | 19.7 |
The laryngeal models were designed using the computer-aided design (CAD) program Pro/Engineer. The models were manufactured from acrylonitrile butadiene styrene plastic martial using a 3D rapid prototype machine. Five pressure taps were created normal to the surface of each larynx at the subglottic region, TVFs, laryngeal ventricle, FVFs, and supraglottic region. A 2D side view of the models, including the location of the pressure taps, is shown in Fig. 1.
A low-speed wind tunnel was employed for the experiments with a uniform rectangular cross section that was 20 mm high and 25 mm wide. The rectangular ducts upstream and downstream of the model were 0.8 m and 0.6 m long, respectively. The tunnel was an open circuit, and the air flow was pulled through the tunnel ducts using a vacuum source with adjustable speed. The specification of the experimental setup and data collection is reported in detail by Alipour and Scherer [24].
3. Validation of the Computational Method
In order to showcase the validity of the computational method for the laryngeal flow simulations, the experiment by Chisari et al. [16] was reproduced using the current computational method. The test case was composed of two consecutive static constrictions, which approximate the TVF and FVF gaps. A uniform base grid was used for domain discretization with up to six levels of grid refinement. The simulation was performed in parallel for Re = 900 using 80 cores of the helium high performance computing cluster at the University of Iowa. The time step size was adaptive and satisfied Courant–Friedrichs–Lewy (CFL). The initial number of grid points was 186,856 after the startup refinement, and the simulation terminated with 695,895 grid points, due to adaptive refinement in regions with high gradients of the velocity and vorticity.
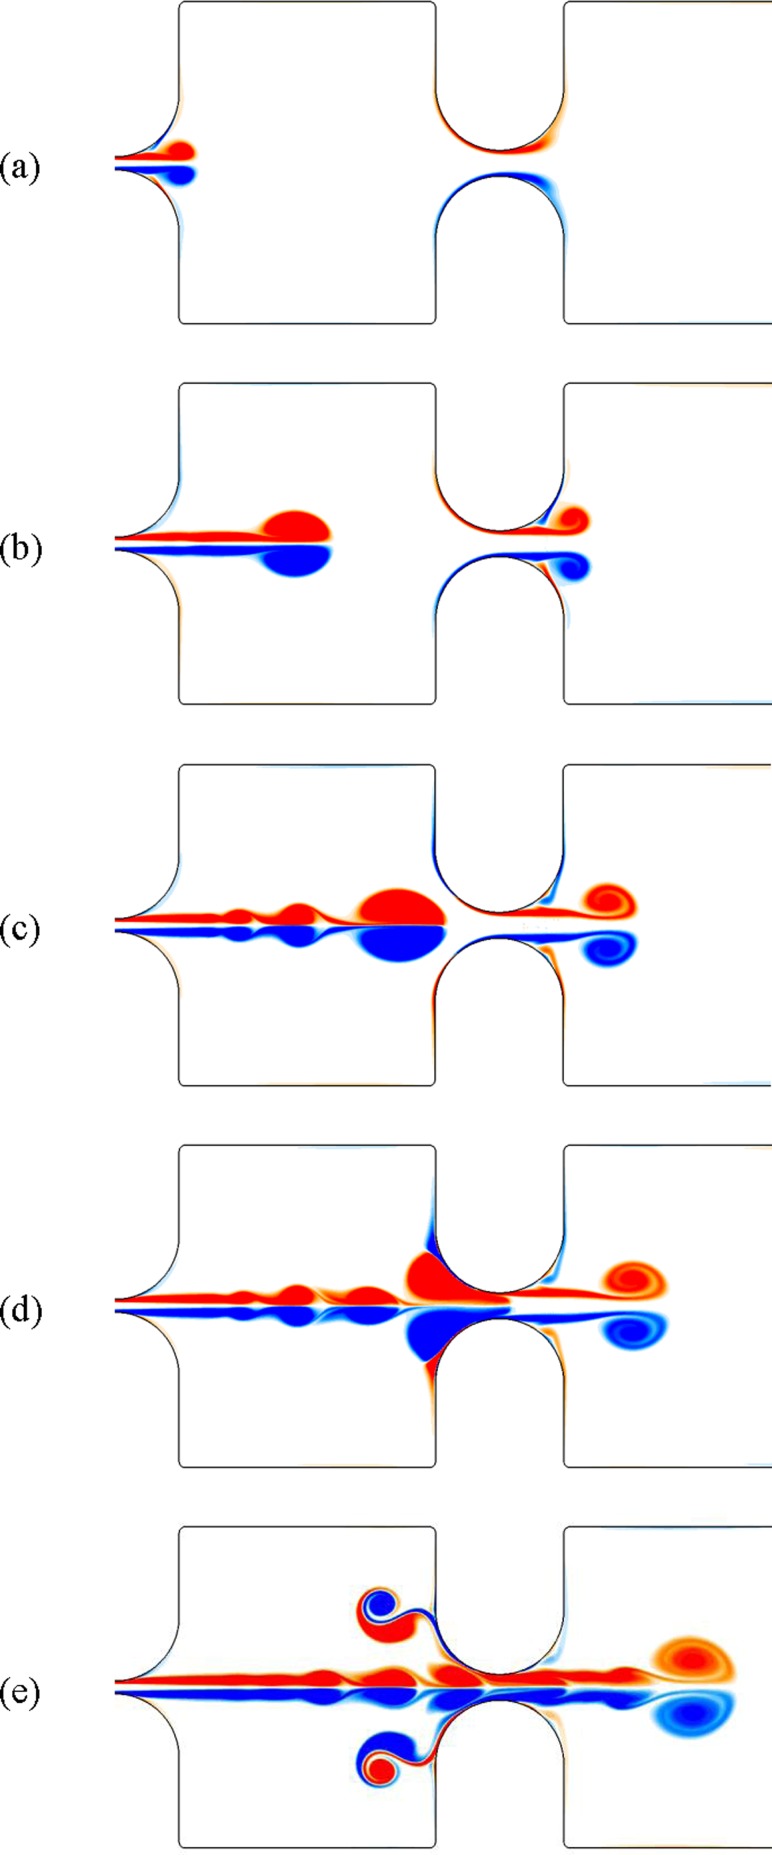
Figure 2 shows the vorticity contours after 3.5, 5.8, 7.2, 7.8, and 9.5 ms. A starting vortex (vortex ring) was created and detached from the surface of the first constriction. This vortex structure moved toward the second constriction while it was followed by a trailing jet flow. A second starting vortex simultaneously formed at the location of the second constriction and convected to the outlet boundary. The first vortex moved axially between the constrictions and squeezed into the second slit. The strong interaction between this vortex structure and the walls of the second constriction created a set of secondary vortices that moved backward toward the first slit. Formation of these secondary vortex structures has also been reported in other fundamental fluid dynamics experiments when a vortex ring impinges an interface [32,33]. These vortices that detach the surface of the interface and move away from the interface in the opposite direction of the initial vortex ring are known as the “rebound vortices.” The described flow dynamics agree well with the flow visualizations and numerical simulation of Chisari et al. [16].
Fig. 2.
Vorticity contour of the air flow in a semilaryngeal structure at dimensional times of (a) 3.5 ms, (b) 5.8 ms, (c) 7.2 ms, (d) 7.8 ms, and (e) 9.5 ms. The size of first and second constriction gap was 0.04 and 0.08 cm, respectively.
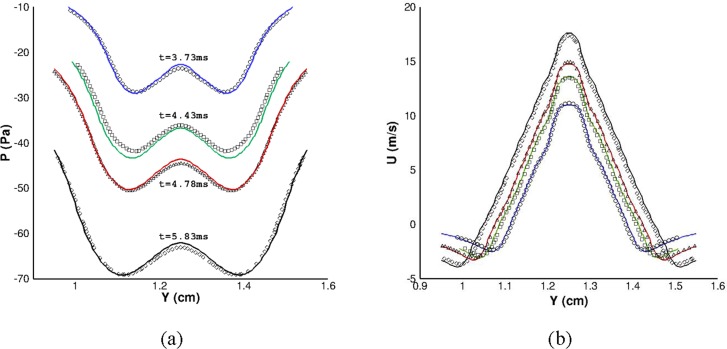
The centers of the two counterrotating vortices of the first starting vortex were tracked as they moved axially between the two constrictions. The pressure and velocity profiles on the line passing through centroids of these vortices were extracted at 3.73 ms, 4.43 ms, 4.78 ms, and 5.83 ms. A quantitative comparison with the numerical simulation of Chisari et al. [16] in Fig. 3 shows good agreement.
Fig. 3.
A comparison between the current computational solver (solid lines) with the result of Chisari et al. [16] (scattered symbols). (a) Pressure and (b) streamwise velocity profiles along the line that connect the starting vortex centroids at times of 3.73 ms (circles), 4.43 ms (squares), 4.78 ms (diamonds), and 5.83 ms (deltas).
4. Results and Discussion
Agarwal et al. [2] suggested a series of parameters to describe the shape and the size of the FVFs in the human larynx. Among these parameters, Gfvf, Hfvf, and Wlv were utilized in the current work (Fig. 1) to study the effect of the geometry of the FVFs on the dynamics of the glottal flow. The range of the aforementioned parameters was reported for two groups of normal people and trained singers [2]. The overlap of the measurements of the aforementioned groups was used to design several rigid laryngeal models. The TVFs of these models were parallel, and the glottis was 1 mm wide. The sizes of the Gfvf, Hfvf, and Wlv for the models used in the current study are reported in Table 1.
4.1. Grid Independence Study.
A grid independence study was performed on a laryngeal model (hereafter the control model or C1), which was designed according to the mean values of the measurements of the human larynx [2]. For this propose, the time-dependent Navier–Stokes equations were solved for two base Cartesian grid sizes of and . A linear ramp was used to impose the inlet boundary condition, whereby the velocity grew gradually for and then remained constant for the rest of the simulation. The maximum Reynolds number, based on the input diameter at the subglottal region and the maximum velocity after the velocity ramp, was 1000. A no-slip boundary condition was imposed on the larynx walls, and the outlet boundary was treated with a convective outflow condition. The simulations were performed for a time of .
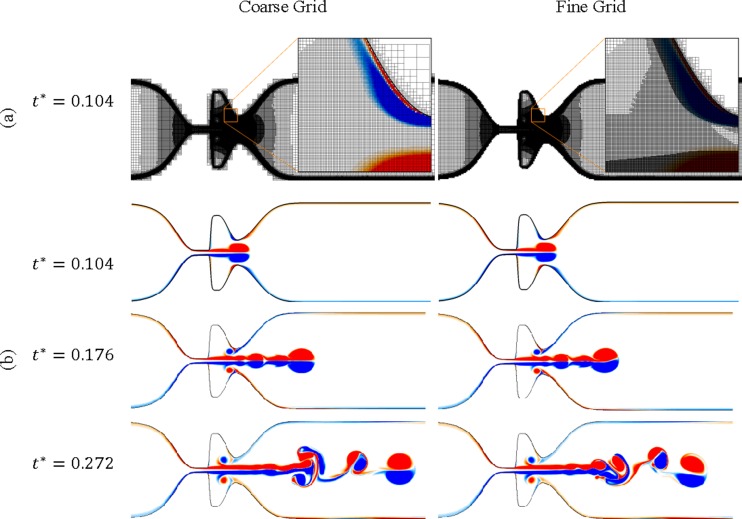
Efficient mesh resolution in regions with vorticity and velocity gradients is of great importance for correct prediction of complex fluid dynamics phenomena, including the shear layer instabilities, growing boundary layers, and sophisticated vortex structures. In a recent study [34], the effect of near-wall grid refinement at the boundaries of the glottis on correct prediction of the characteristics of the glottal jet was highlighted in a series of three-dimensional simulations. They observed that their results with a fine (5,000,000 grid points) and a coarse (1,000,000 grid points) mesh, including near wall refinement, were more consistent with the experimental measurements, whereas the computational results with 3,000,000 grid points without near wall refinement demonstrated poor agreement with the experiments. In order to achieve a highly accurate glottal flow simulation, it is also necessary to consider unsteady characteristics of the glottal jet. The flow unsteadiness and instabilities affect jet flapping in the downstream of the glottis. Therefore, adaptive grid refinement is also required at the shear layer of the glottal jet and a uniform or stretched mesh at these regions is insufficient for the precise simulation of the glottal flow. This requirement was fulfilled in our simulations with the possibility of six levels of LMR. Our simulation with a coarse grid began with approximately 112,000 grid points after the initial refinement. As the flow structures were developing, the number of the grid points continuously increased, due to the adaptive refinement. This simulation terminated with about 900,000 grid points. The simulation with a fine grid initiated with 479,000 grid points and terminated with 6,432,500 grid points. These simulations were performed in parallel using 60 cores of the helium high performance computing cluster at the University of Iowa. Figure 4 compares these two grids refined at a region near the FVF at .
Fig. 4.
Grid refinement study: (a) comparison between the coarse and fine mesh. The Cartesian mesh interior to the solid that is not required for the ghost fluid treatment is pruned during the simulation for improved memory performance. (b) Comparison between the vorticity contours of the coarse and fine grid at t * = 0.104, 0.176, and 0.272, respectively.
The vorticity contours for the fine and coarse simulations are depicted in Fig. 4. The overall vorticity pattern is nearly identical for the two cases before . After this time, jet flapping was observed in a similar location for both simulations and vortices moved toward the same side of the vocal tract. Moreover, the behavior of the vorticity structures remained the same in the laryngeal ventricle during the whole period of the simulation. Since the focus of the current work is on the glottal flow in the laryngeal ventricle, the fact that the coarse and fine mesh predicts the same aerodynamics characteristics at this region justified the use of a grid size similar to the coarse grid for the rest of the simulations in this work.
4.2. Comparison With Previous Investigation of the Glottal Flow.
The glottal flow is pulsatile, and its laminar core at the subglottal rejoin can transition to turbulence and create complex three-dimensional flow structures [21,35–37]. The main characteristics of the jet flow consist of the formation of a starting vortex (two counterrotating vortices, also known as a vortex dipole), which is followed by a trailing jet, growth of shear layer instabilities, flapping of the glottal jet, and transition of its laminar core into turbulence [17,18,34–36]. However, the flow structures described in our simulations are obtained using two-dimensional rigid models in the presence of a nonpulsatile inlet flow condition. The simulations are terminated at a time scale comparable with one cycle of phonation.
Our simulations in Fig. 4 start with formation of a starting vortex. This vortex structure results from a shear layer roll-up charged by the jet flow from the glottis. The starting vortex then detaches from the surface of the TVFs and passes through the gap between the FVFs while being followed by a trailing jet. Formation of the starting vortex and its trailing jet were reported in other flow visualizations with rigid and flexible TVFs [16,17,19,36]. The formation of this vortex structure (vortex rings in three dimensions) has been reported in many other physiological fluid flows [38]. According to Gharib et al. [38], a limit exists for which the starting vortex acquires the maximum circulation and pinches off from its trailing jet. This limit is defined by a universal nondimensional number, known as the formation number , where and d are the discharge time and orifice diameter (Gtvf). Moreover, in our simulations is the mean value of the inlet velocity (). This parameter has been examined for a wide range of fluid flows, and it is commonly accepted that its value lies in the range between 3.6 and 4.5. The formation number of the starting vortex observed in the current simulations is approximately 3.8. Therefore, the simulation results are consistent with the known physical behavior of starting vortices [38].
The interaction between the starting vortex and the FVFs while it is passing through the gap between the FVFs resulted in formation of a set of rebound vortex structures in the laryngeal ventricle (Fig. 4). PIV measurements of the glottal flow using flexible and static models of the TVFs also demonstrated that the FVFs could interfere with the starting vortex and create vortices in this region [16,17]. Impingement of the glottal jet on the FVFs was also observed in the computational simulations when the laryngeal flow was assumed symmetric [26]. The rebound vortices in the current work detach the surface of the FVFs and move in the laryngeal ventricle toward the TVFs; however, they do not reach the TVFs during the simulation.
The trailing jet of the glottal flow in the supraglottal region beyond the FVFs in our computational simulations experiences a flapping motion consistent with previous studies on the glottal flow [17,36]. This phenomenon occurs due to the growth of the Kelvin–Helmholtz instability in the shear layer of the jet flow [36,39].
While several consecutive vibrations of the TVFs are required for human phonation, the goal of the current study is to examine the effect of the FVF geometry on vortical structures important to human phonation, with a focus on the starting vortex and its sensitivity to the FVF geometry. In spite of these simplifications, the flow structures observed in this section (formation of the starting vortex, creation of shear layer instabilities in the trailing jet, and formation of the rebound vortices) are consistent with the vorticity patterns observed in each cycle of the phonation of the oscillatory models of the TVFs [17,36]. Therefore, simplifications of the current study enable the performance of a parametric study of the effect of the FVF geometry on key features of the glottal flow.
4.3. The Effect of the FVF Gap.
In the current work, five laryngeal models (namely G1, G2, C1, G3, and G4) were created, for which Gfvf were 2.3, 3.3, 5.1, 6.3, and 7.5 mm, respectively. The Reynolds number and the boundary conditions applied for these simulations were similar to those described for performing the grid independent study.
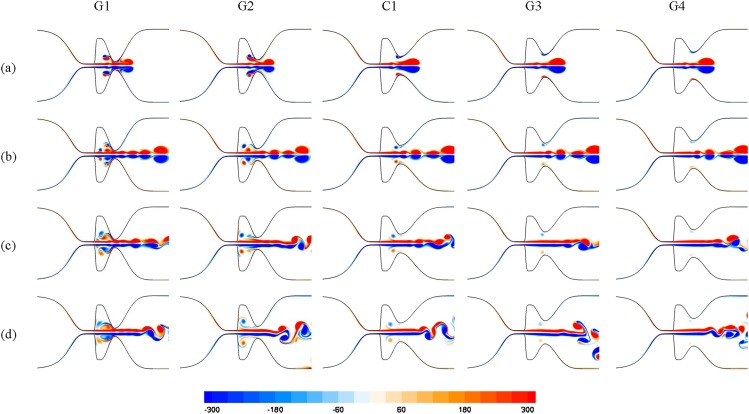
The vorticity contours for these laryngeal models are compared in Fig. 5. In all cases, a starting vortex forms and convects toward the supraglottic region. Moreover, jet flapping occurs at the regions after the FVFs.
Fig. 5.
Nondimensional vorticity contours for the laryngeal models with different sizes of the Gfvf at nondimensional time (t *) of (a) 0.128, (b) 0.176, (c) 0.24, and (d) 0.304. The interaction between the starting vortex and the FVFs increases as the Gfvf decreases; hence, rebound vortices in the laryngeal ventricle of the models with narrow Gfvf are stronger.
The laryngeal models with the smallest Gfvf reveal the strongest interaction between the starting vortex and the FVFs (Fig. 5). These vortex structures for G3 and G4 are weak and remain in the vicinity of the FVFs walls. The rebound vortices detach from the surface of the FVFs and convect toward the TVFs for the control model; however, they do not reach the TVFs during the simulation. These rebound vortices for G1 and G2 are much stronger and result in a more complex flow pattern. Following the impingement of the starting vortex with the surface of the FVFs in these models, the resulting rebound vortices move toward the TVFs. The structure of each rebound vortex is also composed of two counterrotating vortices followed by a trailing jet. These vortices collide with the shear layer of the glottal jet in the laryngeal ventricle. One of the counterrotating vortices filters into the FVF gap and creates a second set of rebound vortex structures, while the other counterrotating vortex moves toward the TVFs and impacts its surface. For G2, the second rebound vortex moves into the flow circulation at the laryngeal ventricle, whereas these rebound vortices for G1 again collide with the shear layer of the trailing jet of the glottal flow and then reach the surface of the TVFs.
In order to investigate the oscillatory pattern of the vortex shedding from the surface of the TVFs, the Strouhal number is provided for all cases (where f, d, and V are the vortex shedding frequency, Gtvf, and average velocity at the glottis). The shedding frequency is calculated based on the time interval when the first two subsequent vortices in the trailing jet flow pass the same location just after the FVFs gap. The highest value of the Strouhal number is approximately 0.174 and is found for G1 and G2 models with small Gfvf. As the size of Gfvf increases, the value of the Strouhal number drops to 0.151, 0.157, and 0.156 for C1, G3, and G4, respectively. This trend indicates that the small size of the Gfvf would increase the ratio of the local flow velocity of the vortex shedding to the average flow of the glottal jet.
Kucinschi et al. [19] also studied the relationship between the Strouhal number and the size of the FVF gap by comparing two Gfvf using experimental models in a wind tunnel. Their findings indicated that the Strouhal number was larger in the model with the wider Gfvf. However, their flow oscillations were measured in the ventricle region, resulting from vortex shedding from the separation of the glottal flow from a divergent glottis. Moreover, they did not report any vortical structures in the laryngeal ventricle. In our simulation, the TVFs are parallel and the jet remains more intact up to the FVFs. The vortex shedding is more pronounced distal to the FVFs and is affected by the interaction of the glottal jet flow and the FVFs. Moreover, the rebound vortices and their collision with the shear layer of the trailing jet in the laryngeal ventricle of the models with small FVF gap play an important role in destabilizing the glottal jet flow and increasing the vortex shedding.
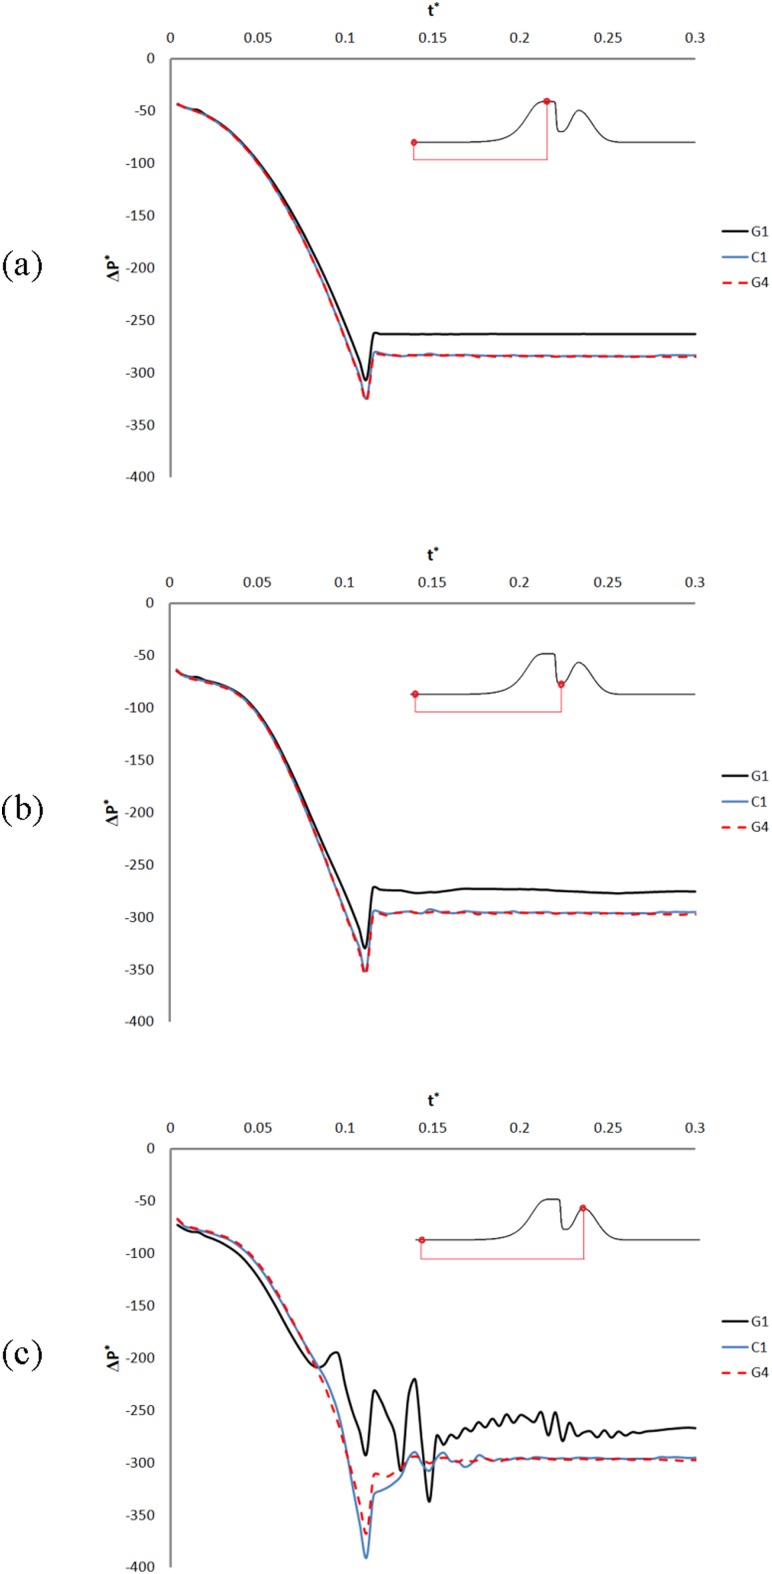
The balance between the viscoelastic force of the TVF tissues and the aerodynamic forces of the air flow creates the vibration of the TVFs, the latter force being composed of pressure and viscous shear contributions. Successful lumped-element models, such as the two-mass model of Steinecke and Herzel [40] employ the air pressure as the dominant aerodynamic force to capture self-sustained oscillation of the vocal folds. Although the TVFs are modeled as rigid and stationary in our simulations, the nondimensional differential pressure history on the surface of the TVFs, laryngeal ventricle, and FVFs is plotted in Figs. 6(a)–6(c) for G1, C1, and G4 (plots of the nondimensional differential pressure history for G2 and G3 models are omitted to provide better clarity but show similar trends). The differential pressure in the current work is defined as the pressure difference between a point on the surface of the larynx and the subglottal pressure. The plots reveal a primary transitional region in which the nondimensional differential pressure drops continuously. This happens concurrently with the linear velocity ramp rising from zero to its maximum value, while a starting vortex also forms and moves toward the FVFs. The maximum pressure drop on the TVFs and laryngeal ventricle occurs when the starting vortex reaches the FVF gap (Figs. 6(a) and 6(b)). As the starting vortex passes through this gap, the nondimensional differential pressure recovers partially; however, it remains nearly unchanged for the rest of the simulation. The nondimensional differential pressure on the surface of the TVFs and laryngeal ventricle after the transitional region is higher for the models with narrow FVF gap; however, it is almost similar for the control model and the laryngeal models with wide FVF gap.
Fig. 6.
Nondimensional differential pressure (ΔP *) history on the surface of the TVFs (a), laryngeal ventricle (b), and FVFs (c) for models with different sizes of FVF gap. t * is the nondimensional time. The pressure initially drops as the starting vortex is created and convected in the laryngeal ventricle and then recovers partially for the rest of the simulation. Moreover, pressure data on the surface of the FVF fluctuate for the models with narrow Gfvf.
The nondimensional differential pressure history on the surface of the FVFs (Fig. 6(c)) for the control model and the laryngeal models with wide FVF gap also shows the initial pressure drop followed by a partial pressure recovery; however, its value is lower at the FVFs compared to its values on the surface of the TVFs and the laryngeal ventricle. Moreover, some pressure fluctuations are observed after the pressure recovery, which die out with time. These fluctuations for the laryngeal models with narrow FVF gap are stronger and occur sooner. The first pressure fluctuation for these models occurs as the starting vortex collides with the surface of the FVFs. It is followed by strong pressure fluctuations as a series of vortex structures formed at the jet flow pass the FVF gap. These small vortex structures are produced by the shear layer stabilities and, as mentioned, raise the Strouhal number in the models with small Gfvf. The level of pressure fluctuation for G1 is higher than G2 (plots of the nondimensional differential pressure for G2 are omitted in the figure). These high-pressure fluctuations are replaced by high-frequency and low-amplitude fluctuation during the rest of the simulation for G1 and G2.
The translaryngeal resistance is often used to study the laryngeal functionality. The nondimensional translaryngeal resistance in this work is defined as the ratio of the average nondimensional translaryngeal pressure to the mean nondimensional glottal flow rate. The values of the nondimensional translaryngeal resistance for G1, G2, C1, G3, and G4 are 257, 267, 286, 289, and 290, respectively, and indicate that the nondimensional translaryngeal resistance increases for the wider gaps of the FVFs. Moreover, the rate of change of nondimensional translaryngeal resistance decreases for the wider FVFs gaps, suggesting that the glottal flow is less affected with the presence of the FVFs. This observation is consistent with the experiments of Agarwal and Scherer [41] for the intermediate range of the Gfvf. They show that, for a given glottal gap, a critical ratio of the Gfvf to glottal gap exists, for which the flow resistance exhibits a minimum. Although Agarwal and Scherer [41] did not plot the laryngeal resistance against the ratio of the Gfvf to the glottal gap for the uniform glottis, their plots for divergent glottis show that the minimum laryngeal resistance for the wider glottis shifts toward 1 on the axis, indicating the ratio of the Gfvf to the glottal gap. This ratio for our laryngeal models ranges from 2.3 to 7.5 and is in the range reported for people without voice abnormalities.
Although a smaller translaryngeal resistance may suggest a more efficient phonation, the nondimensional differential pressure plots in Fig. 6 suggest that the narrower FVF gap will exhibit pressure fluctuations on the surface of the FVFs. These pressure fluctuations for the narrower FVF gap may be the main source of the aerodynamic force that results in involuntary or irregular FVFs oscillation in the presence of voice abnormalities (e.g., ventricular dysphonia [11]).
In addition to computational simulations, wind tunnel experiments are performed on G2, C1, and G3 laryngeal geometries to collect pressure data under the same flow conditions. It should be noted that the laryngeal models employed in this work are rigid with parallel TVFs. Therefore, the effect of the TVFs' oscillation is not examined in this study. Measuring pressure experimentally with TVF oscillation is extremely challenging, due to high-frequency vibration of TVFs, and the rigid wall simplification allowed us to experimentally investigate the pressure distribution on the surface of the laryngeal models within a wind tunnel.
For each pressure tap on the experimental model, the nondimensional differential pressure is collected and averaged over a window of 10 seconds. Similar to the computational simulations, the differential pressure in the experiments is measured with respect to upstream air pressure in the wind tunnel. The Reynolds number in the experiments is 1000, which is calculated based on the hydraulic diameter of the wind tunnel and the average velocity of air flow. These steady-state pressure data have been nondimensionalized and tabulated for G2, C1, and G4 models (Table 2). It should be observed that is defined using the mean upstream inlet velocity . However, most literature reports experimental results in the form of a pressure coefficient, , which is based on the average velocity at the glottis . Since the average velocity at the glottis is one order of magnitude larger than the inlet velocities investigated in this work, it is concluded that the current results are consistent with previous results from the literature [42,43]. As can be observed, the pressure decreases on the surface of the TVFs. This is expected, due to the acceleration of the air flow in this region. The nondimensional differential pressures on the surface of the laryngeal ventricle are slightly lower than the TVFs and are followed by partial pressure recovery at the FVF gap. This pattern of the pressure distribution is consistent with the experiments of Li et al. [20]. Furthermore, the pressure drop on the surface of the TVFs and laryngeal ventricle is smaller for the laryngeal model with small Gfvf.
Table 2.
Nondimensional differential pressures collected in the experiments on the surface of the models with different FVF gaps. The location of the pressure taps are depicted in Figure 1.
| P1 | P2 | P3 | P4 | P5 | P6 | |
|---|---|---|---|---|---|---|
| G2 | –64.9605 | –289.538 | –324.802 | –313.666 | –315.522 | –309.954 |
| C1 | –59.3556 | –278.713 | –293.746 | –283.713 | –293.746 | –297.326 |
| G3 | –63.9408 | –291.087 | –315.99 | –316.339 | –316.339 | –318.625 |
In the experiments, it is not possible to measure pressure in the initial phase of flow, and thus, the effect of the starting vortex is not measured experimentally. In order to compare the experimental and computational results, the computational pressure data after the pressure recovery are averaged on the TVFs, laryngeal ventricle, and FVFs (identical to “P2”, “P3”, and “P4” in the experiments, respectively) and tabulated in Table 3. The experimental nondimensional differential pressure drop (Table 2) is slightly higher than the computational values (Table 3), which might be due to three-dimensional effects that could not be captured in our 2D simulations. The numerical and experimental pressure shows that the pressure drop on the surface of the larynx is approximately similar for C1 and G3 models, whereas it drops less on the laryngeal model with the smaller Gfvf. Moreover, in each model, the differential pressure is higher on the surface of the TVFs (P2) compared to the laryngeal ventricle (P3). The computational and experimental results are in good agreement, and, importantly, show that the widely used assumptions of the Bernoulli equation within the speech society, which predicts full pressure recovery in the laryngeal ventricle, are inadequate to describe the pressure within this region.
Table 3.
Nondimensional differential pressures on the surface of the larynx in the computational simulations
| TVF | LV | FVF | |
|---|---|---|---|
| G2 | –283.864 | –295.555 | –295.907 |
| C1 | –266.681 | –278.557 | –280.432 |
| G3 | –284.239 | –296.133 | –296.441 |
4.4. The Effect of the Height Between TVF and FVF.
Three laryngeal models were employed to study the effect of the size of the Hfvf (see Fig. 1) on the glottal flow. These models will be referred as H1, C1, and H2, for which Hfvf is 5.3, 6.2, and 7.5 mm, respectively. The Reynolds number and the boundary conditions were similar to those described for performing the grid-independent study.
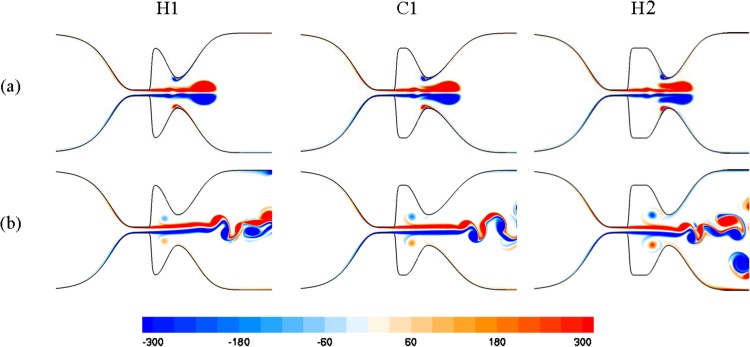
The vorticity contours for these models are depicted in Fig. 7. The coherent structures of the glottal jet flow, including formation of the starting vortex followed by a trailing jet as well as flapping of this jet flow at the supraglottal region, are observed in all models. Moreover, rebound vortices are formed at the laryngeal ventricle of these models, although they do not reach the TVFs during the simulation.
Fig. 7.
Nondimensional vorticity contours for the laryngeal models with different size of Hfvf at nondimensional time (t *) of (a) 0.128 and (b) 0.304, respectively
The results show that the Strouhal number increases in the simulations as Hfvf decreases. The lowest value of the Strouhal number is for H2 (St = 0.134), while it is higher and nearly equal for the C1 and H1 models (0.151 and 0.152, respectively). A similar pattern was reported by Kucinschi et al. [19] for the models with a small-size Gfvf but with different Hfvf, although their Strouhal number values were smaller.
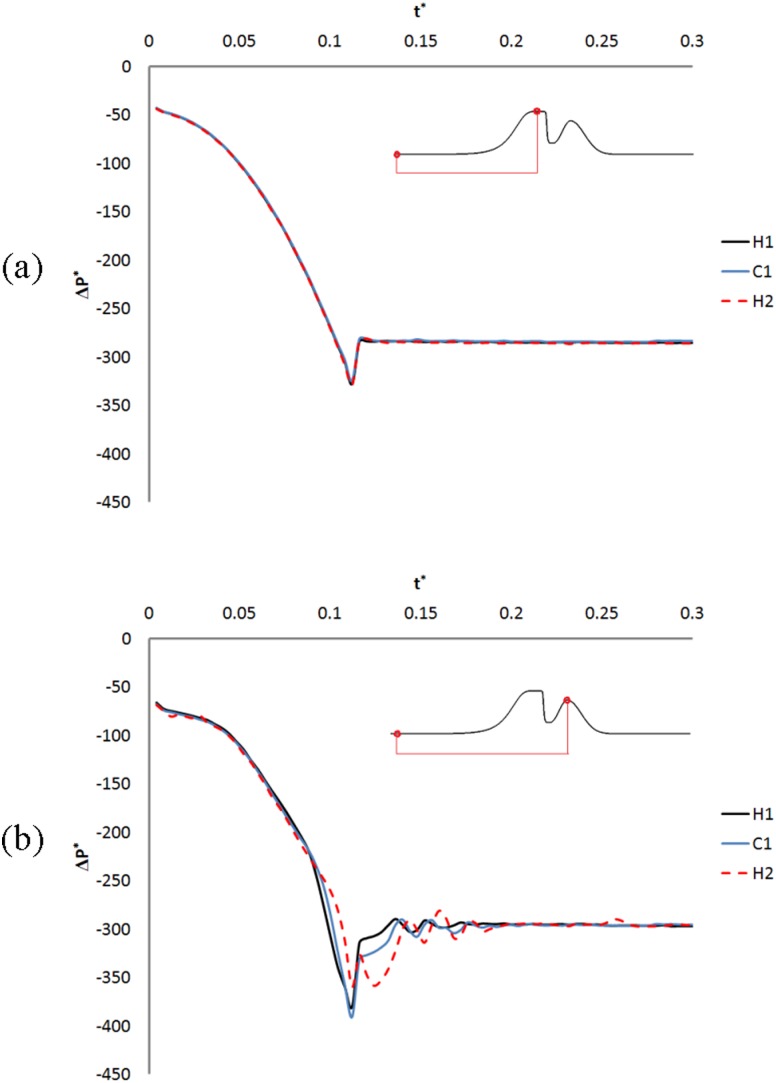
The nondimensional differential pressure history on the surface of the TVFs and FVFs for these models is plotted in Fig. 8. The pressure initially drops for all models and then partially recovers and reaches a plateau. The values of the differential pressure are slightly higher on the surface of the TVFs compared to the FVFs. Moreover, some pressure fluctuations are observed on the surface of the FVFs (Fig. 8(b)) while the pressure is recovering. The magnitude of these pressure fluctuations is higher for the H2 model.
Fig. 8.
Nondimensional differential pressure (ΔP *) history on the surface of (a) TVFs and (b) FVFs for models with different sizes of Hfvf. t* is the nondimensional time. The plot of ΔP * on the surface of the laryngeal ventricle (plot omitted) is similar to ΔP * on the surface of the TVFs; however, its values after pressure recovery are close to the ΔP * on the surface of the FVFs.
The plot of the nondimensional differential pressure on the surface of the laryngeal ventricle shows no pressure fluctuation, and its trend is similar to pressure variation on the surface of the TVFs (figure omitted). However, the value of the nondimensional differential pressure at this region is close to its values on the surface of the FVFs.
The results also show that the variation of the height between the TVFs and FVFs has minor effect on the nondimensional translaryngeal resistance. The value of this parameter for H1, C1, and H2 are 288, 286, and 287, respectively.
4.5. The Effect of the Width of the Laryngeal Ventricle.
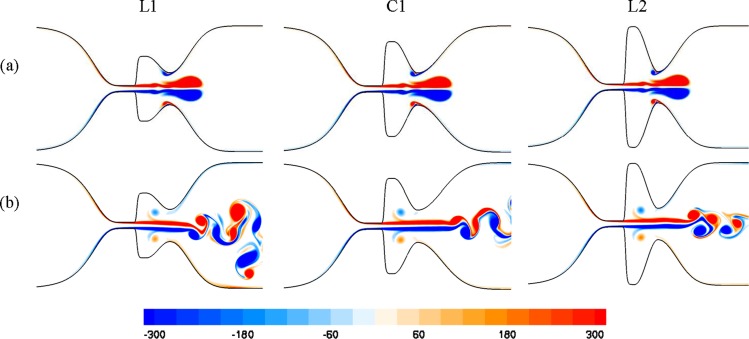
Three laryngeal models (hereafter L1, C1, and L2) were designed, for which Wlv was 10.3, 15, and 19.7 mm, respectively. The Reynolds number and the boundary conditions applied for these simulations were similar to those described for performing the grid-independent study.
Vertical structures in the laryngeal models with different Wlv are depicted in Fig. 9. The main coherent structures of the glottal flow, including formation of a starting vortex followed by a trailing jet and also flapping of the glottal jet, are observed in all the models. The rebound vortex structures are also formed in these models, due to interaction between starting vortex and the FVFs. The strength of these rebound vortices is similar, and they move similar distances in the laryngeal ventricle toward the TVFs, although they do not reach the TVFs during the simulation. Furthermore, the influence of the size of Wlv on the Strouhal number for these laryngeal models is negligible (this value for L1, C1, and L2 is 0.152, 0.151, and 0.155, respectively).
Fig. 9.
Nondimensional vorticity contours for the laryngeal models with different sizes of Wlv at nondimensional time (t *) of (a) 0.128 and (b) 0.304
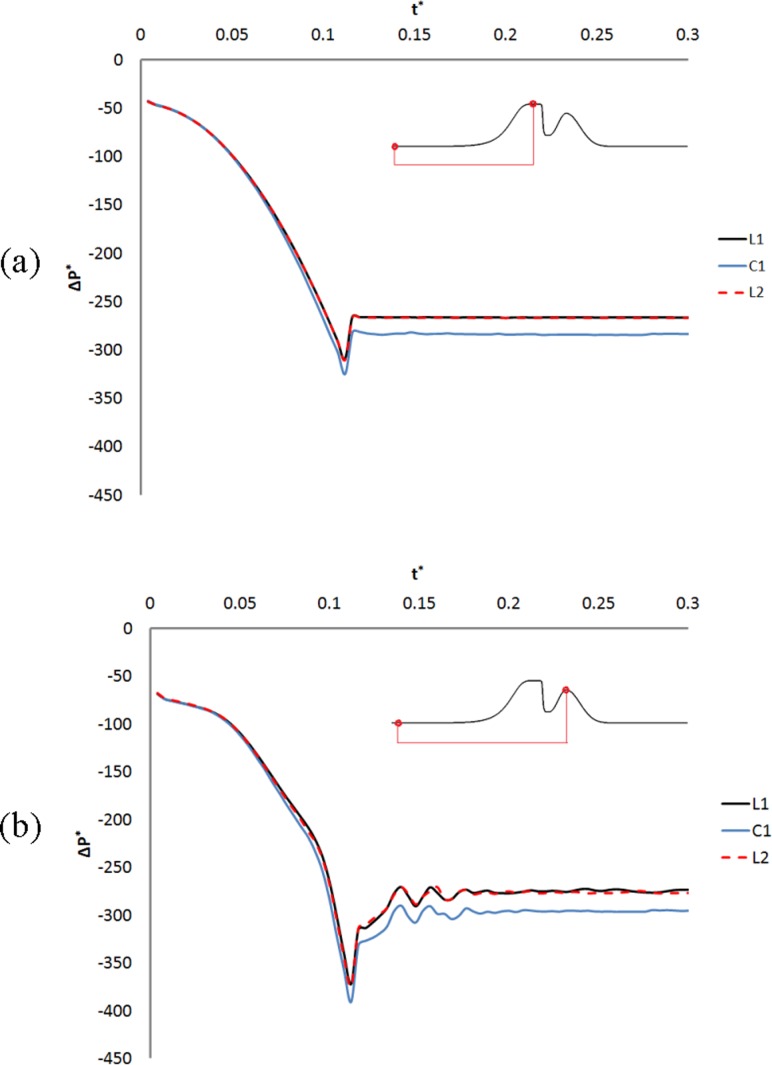
The nondimensional differential pressure history on the surface of the TVFs is plotted in Fig. 10(a). The differential pressure drops while the starting vortex is forming and moving at the laryngeal ventricle. The differential pressure then recovers partially and reaches a plateau during the rest of the simulations. The greatest pressure drop is observed for the control model, while the pressure for smaller and larger Wlv are approximately similar. A similar pattern is observed for the nondimensional differential pressure on the surface of the laryngeal ventricle (figure omitted). Moreover, the value of the differential pressure at the laryngeal ventricle is slightly more negative compared to its values on the TVFs.
Fig. 10.
Nondimensional differential pressure history on the surface of TVFs and FVFs for models with different sizes of Wlv
The variations of the nondimensional differential pressure with time on the surface of the FVFs are illustrated in Fig. 10(b). The highest pressure drop at this region is also observed in the control model. Moreover, variation of the differential pressure is almost identical for the models. Some pressure fluctuations are observed at this region. These fluctuations occur as small vortices at the glottal jet flow are passing the FVFs gap. The scale and pattern of these fluctuations are approximately identical for the laryngeal models, which is consistent with the similar Strouhal numbers found for these models.
The results also show that the nondimensional translaryngeal resistance is highest in the control model compared to other laryngeal models of this group. This value for L1, C1, and L2 is 271, 286, and 273, respectively.
5. Conclusion
The effect of the size of the FVF gap, the height between the TVFs and FVFs, and the width of the laryngeal ventricle was studied computationally. Moreover, pressure distributions were measured in a low-speed wind tunnel for the models with different sizes of the FVFs gap. The results show that the size of the FVFs gap was the main geometrical parameters affecting the glottal flow dynamics.
The coherent structures of the glottal flow observed in the computational simulations, including the formation of the starting vortex, the trailing jet flow, and its flapping was in good agreement with previous experimental flow visualizations. Formation of the starting vortex created a pressure drop on the surface of the TVFs, laryngeal ventricle, and FVFs, and as this vortex structure passed the FVF gap, pressure recovered partially. Moreover, the interaction between the starting vortex and the FVFs created rebound vortices in the laryngeal ventricle. These vortices moved in the laryngeal ventricle toward the TVFs, and it was shown that they could collide with the glottal jet flow in the laryngeal ventricle and reach the surface of the TVFs in models with narrow FVF gap in a time period comparable with one cycle of phonation.
The numerical experiments indicate that a smaller FVF gap size (smaller than the ratio of 0.65 for the simulations in this study) has the potential to destabilize the glottal jet as a result of a strong interaction between the starting vortex and the FVFs as well as creation of complex vortical structures in the laryngeal ventricle. The vortex shedding from the TVFs created pressure fluctuations on the surface of the larynx, and it was shown that the small size of the FVF gap can considerably amplify this pressure oscillation.
The nondimensional differential pressure was higher in the models with narrow FVF gap; however, it remained unchanged for the control model and the models with wider FVF gap. The results also suggest that the nondimensional differential pressure was smaller in the control model compared to the models with smaller and larger width of the laryngeal ventricle. Moreover, the effect of the height between TVFs and FVFs on the differential pressure was negligible.
The Strouhal number was more sensitive to changes of the FVFs gap and the height between the TVFs and the FVFs, whereas it was almost independent of the width of the laryngeal ventricle. A small FVF gap led to an increased Strouhal number; however, its value for the middle and larger size of the FVF gap was lower and remained in the same range. Furthermore, a large height between the TVFs and the FVFs compared to the control model decreased the value of the Strouhal number, but it remained unchanged for the model with small height between the TVFs and the FVFs.
The results showed that the nondimensional translaryngeal resistance was smaller in models with narrow FVF gap. Moreover, its value was smaller in the control model compared to the models with smaller and larger width of the laryngeal ventricle. The value of the translaryngeal resistance was, however, independent of the changes of the height between the TVFs and FVFs.
Acknowledgment
The project described was partially supported by Award Number R01DC009567 from the National Institute on Deafness and other Communication Disorders.
Contributor Information
Mehrdad H. Farahani, Department of Biomedical Engineering, The University of Iowa, Iowa City, IA 52242, e-mail: mehrdad-hosniehfarahani@uiowa.edu
John Mousel, Department of Mechanical and, Industrial Engineering, The University of Iowa, Iowa City, IA 52242, e-mail: john-mousel@uiowa.edu .
Fariborz Alipour, Department of Communication, Science and Disorders, The University of Iowa, Iowa City, IA 52242, e-mail: alipour@iowa.uiowa.edu .
Sarah Vigmostad, Department of Biomedical Engineering, The University of Iowa, Iowa City, IA 52242, e-mail: sarah-vigmostad@uiowa.edu .
References
- [1]. Stager, S. , 2011, “The Role of the Supraglottic Area in Voice Production,” Otolaryngol., 2(S), pp. 1–7. [Google Scholar]
- [2]. Agarwal, M. , Scherer, R. C. , and Hollien, H. , 2003, “The False Vocal Folds: Shape and Size in Frontal View During Phonation Based on Laminagraphic Tracings,” J. Voice, 17(2), pp. 97–113. 10.1016/S0892-1997(03)00012-2 [DOI] [PubMed] [Google Scholar]
- [3]. Chan, R. W. , Fu, M. , and Tirunagari, N. , 2006, “Elasticity of the Human False Vocal Fold,” Ann. Otol. Rhinol. Laryngol., 115(5), pp. 370–381. [DOI] [PubMed] [Google Scholar]
- [4]. Haji, T. , Mori, K. , Omori, K. , and Isshiki, N. , 1992, “Mechanical-Properties of the Vocal Fold -Stress-Strain Studies,” Acta Oto-Laryngol., 112(3), pp. 559–565. 10.3109/00016489209137440 [DOI] [PubMed] [Google Scholar]
- [5]. Fuks, L. , Hammarberg, B. , and Sundberg, J. , 1998, “A Self-Sustained Vocal-Ventricular Phonation Mode: Acoustical, Aerodynamic and Glottographic Evidences,” KTH TMH-QPSR, 3, pp. 49–59. [Google Scholar]
- [6]. Sakakibara, K. I. , Imagawa, H. , Konishi, T. , Kondo, K. , Murano, E. Z. , Kumada, M. , and Niimi, S. , 2001, “Vocal Fold and False Vocal Fold Vibrations in Throat Singing and Synthesis of Khöömei,” Proceedings of the International Computer Music Conference, Havana, Cuba, pp. 135–138. [Google Scholar]
- [7]. Henrich, N. , Lortat-Jacob, B. , Castellengo, M. , Bailly, L. , and Pelorson, X. , 2006, “Period-Doubling Occurrences in Singing: The ‘Bassu’ case in Traditional Sardinian ‘a Tenore’ singing,” ICVPB (2006), Tokyo. [Google Scholar]
- [8]. Borch, D. Z. , Sundberg, J. , Lindestad, P. Å. , and Thalen, M. , 2004, “Vocal Fold Vibration and Voice Source Aperiodicity In ‘Dist’ Tones: A Study of a Timbral Ornament in Rock Singing,” Logoped. Phoniatr. Vocol., 29(4), pp. 147–153. 10.1080/14015430410016073 [DOI] [PubMed] [Google Scholar]
- [9]. Lindestad, P.-Å. , Blixt, V. , Pahlberg-Olsson, J. , and Hammarberg, B. , 2004, “Ventricular Fold Vibration in Voice Production: A High-Speed Imaging Study With Kymographic, Acoustic and Perceptual Analyses of a Voice Patient and a Vocally Healthy Subject,” Logoped. Phoniatr. Vocol., 29(4), pp. 162–170. 10.1080/14015430410020339 [DOI] [PubMed] [Google Scholar]
- [10]. Nasri, S. , Jasleen, J. , Gerratt, B. R. , Sercarz, J. A. , Wenokur, R. , and Berke, G. S. , 1996, “Ventricular Dysphonia: A Case of False Vocal Fold Mucosal Traveling Wave,” Am. J. Otolaryngol., 17(6), pp. 427–431. 10.1016/S0196-0709(96)90080-0 [DOI] [PubMed] [Google Scholar]
- [11]. Maryn, Y. , De Bodt, M. S. , and Van Cauwenberge, P. , 2003, “Ventricular Dysphonia: Clinical Aspects and Therapeutic Options,” Laryngoscope, 113(5), pp. 859–866. 10.1097/00005537-200305000-00016 [DOI] [PubMed] [Google Scholar]
- [12]. Stager, S. , Bielamowicz, S. , Regnell, J. , Gupta, A. , and Barkmeier, J. , 2000, “Supraglottic Activity: Evidence of Vocal Hyperfunction or Laryngeal Articulation?,” J. Speech Lang. Hear. Res., 43(1), pp. 229–238. [DOI] [PubMed] [Google Scholar]
- [13]. Brunelle, M. , Nguyên, D. D. , and Nguyên, K. H. , 2010, “A Laryngographic and Laryngoscopic Study of Northern Vietnamese Tones,” Phonetica, 67(3), pp. 147–169. 10.1159/000321053 [DOI] [PubMed] [Google Scholar]
- [14]. Kelchner, L. N. , Weinrich, B. , Brehm, S. B. , Tabangin, M. E. , and De Alarcon, A. , 2010, “Characterization of Supraglottic Phonation in Children After Airway Reconstruction,” Ann. Otol. Rhinol. Laryngol., 119(6), pp. 383–390. [DOI] [PubMed] [Google Scholar]
- [15]. Bielamowicz, S. , Kapoor, R. , Schwartz, J. , and Stager, S. V. , 2004, “Relationship Among Glottal Area, Static Supraglottic Compression, and Laryngeal Function Studies in Unilateral Vocal Fold Paresis and Paralysis,” J. Voice, 18(1), pp. 138–145. 10.1016/j.jvoice.2003.11.005 [DOI] [PubMed] [Google Scholar]
- [16]. Chisari, N. , Artana, G. , and Sciamarella, D. , 2011, “Vortex Dipolar Structures in a Rigid Model of the Larynx at Flow Onset,” Exp. Fluids, 50(2), pp. 397–406. 10.1007/s00348-010-0941-x [DOI] [Google Scholar]
- [17]. Drechsel, J. S. , and Thomson, S. L. , 2008, “Influence of Supraglottal Structures on the Glottal Jet Exiting a Two-Layer Synthetic, Self-Oscillating Vocal Fold Model,” J. Acoust. Soc. Am., 123(6), pp. 4434–4445. 10.1121/1.2897040 [DOI] [PMC free article] [PubMed] [Google Scholar]
- [18]. Mittal, R. , Erath, B. D. , and Plesniak, M. W. , 2013, “Fluid Dynamics of Human Phonation and Speech,” Ann. Rev. Fluid Mech., 45(1), pp. 437–467. 10.1146/annurev-fluid-011212-140636 [DOI] [Google Scholar]
- [19]. Kucinschi, B. R. , Scherer, R. C. , Dewitt, K. J. , and Ng, T. T. M. , 2006, “Flow Visualization and Acoustic Consequences of the Air Moving Through a Static Model of the Human Larynx,” ASME J. Biomech. Eng., 128(3), pp. 380–390. 10.1115/1.2187042 [DOI] [PubMed] [Google Scholar]
- [20]. Li, S. , Wan, M. , and Wang, S. , 2008, “The Effects of the False Vocal Fold Gaps on Intralaryngeal Pressure Distributions and Their Effects on Phonation,” Sci. China Ser. C: Life Sci., 51(11), pp. 1045–1051. 10.1007/s11427-008-0128-3 [DOI] [PubMed] [Google Scholar]
- [21]. Triep, M. , and Brücker, C. , 2010, “Three-Dimensional Nature of the Glottal Jet,” J. Acoust. Soc. Am., 127, pp. 1537–1547. 10.1121/1.3299202 [DOI] [PubMed] [Google Scholar]
- [22]. Zheng, X. , Bielamowicz, S. , Luo, H. , and Mittal, R. , 2009, “A Computational Study of the Effect of False Vocal Folds on Glottal Flow and Vocal Fold Vibration During Phonation,” Ann. Biomed. Eng., 37(3), pp. 625–642. 10.1007/s10439-008-9630-9 [DOI] [PMC free article] [PubMed] [Google Scholar]
- [23]. Alipour, F. , Jaiswal, S. , and Finnegan, E. , 2007, “Aerodynamic and Acoustic Effects of False Vocal Folds and Epiglottis in Excised Larynx Models,” Ann. Otol. Rhinol. Laryngol., 116(2), pp. 135–144. [DOI] [PubMed] [Google Scholar]
- [24]. Alipour, F. , and Scherer, R. C. , 2002, “Pressure and Velocity Profiles in a Static Mechanical Hemilarynx Model,” J. Acoust. Soc. Am., 112(6), pp. 2996–3003. 10.1121/1.1519540 [DOI] [PubMed] [Google Scholar]
- [25]. Cattafesta, L. , Williams, D. , Rowley, C. , and Alvi, F. , 2003, “Review of Active Control of Flow-Induced Cavity Resonance,” AIAA Paper No. 2003-3567. [Google Scholar]
- [26]. Zhang, C. , Zhao, W. , Frankel, S. H. , and Mongeau, L. , 2002, “Computational Aeroacoustics of Phonation, Part II: Effects of Flow Parameters and Ventricular Folds,” J. Acoust. Soc. Am., 112, pp. 2147–2154. 10.1121/1.1506694 [DOI] [PubMed] [Google Scholar]
- [27]. Mcgowan, R. S. , and Howe, M. S. , 2010, “Influence of the Ventricular Folds on a Voice Source With Specified Vocal Fold Motion,” J. Acoust. Soc. Am., 127, pp. 1519–1527. 10.1121/1.3299200 [DOI] [PMC free article] [PubMed] [Google Scholar]
- [28]. Faure, T. , Adrianos, P. , Lusseyran, F. , and Pastur, L. , 2007, “Visualizations of the Flow Inside an Open Cavity at Medium Range Reynolds Numbers,” Exp. Fluids, 42(2), pp. 169–184. 10.1007/s00348-006-0188-8 [DOI] [Google Scholar]
- [29]. Ozalp, C. , Pinarbasi, A. , and Sahin, B. , 2010, “Experimental Measurement of Flow Past Cavities of Different Shapes,” Exp. Therm. Fluid Sci., 34(5), pp. 505–515. 10.1016/j.expthermflusci.2009.11.003 [DOI] [Google Scholar]
- [30]. Sethian, J. A. , 1999, Level Set Methods and Fast Marching Methods: Evolving Interfaces in Computational Geometry, Fluid Mechanics, Computer Vision, and Materials Science, Cambridge University, Cambridge, England. [Google Scholar]
- [31]. Udaykumar, H. , Krishnan, S. , and Marella, S. V. , 2009, “Adaptively Refined, Parallelised Sharp Interface Cartesian Grid Method for Three-Dimensional Moving Boundary Problems,” Int. J. Comput. Fluid Dyn., 23(1), pp. 1–24. 10.1080/10618560802660379 [DOI] [Google Scholar]
- [32]. Orlandi, P. , 1990, “Vortex Dipole Rebound From a Wall,” Phys. Fluids A, 2(8), pp. 1429–1436. 10.1063/1.857591 [DOI] [Google Scholar]
- [33]. Chu, C.-C. , Wang, C.-T. , and Hsieh, C.-S. , 1993, “An Experimental Investigation of Vortex Motions Near Surfaces,” Phys. Fluids A, 5(3), pp. 662–676. 10.1063/1.858650 [DOI] [Google Scholar]
- [34]. Schwarze, R. , Mattheus, W. , Klostermann, J. , and Brücker, C. , 2011, “Starting Jet Flows in a Three-Dimensional Channel With Larynx-Shaped Constriction,” Comput. Fluids, 48(1), pp. 68–83. 10.1016/j.compfluid.2011.03.016 [DOI] [Google Scholar]
- [35]. Zheng, X. , Mittal, R. , Xue, Q. , and Bielamowicz, S. , 2011, “Direct-Numerical Simulation of the Glottal Jet and Vocal-Fold Dynamics in a Three-Dimensional Laryngeal Model,” J. Acoust. Soc. Am., 130(1), pp. 404–415. 10.1121/1.3592216 [DOI] [PMC free article] [PubMed] [Google Scholar]
- [36]. Neubauer, J. , Zhang, Z. , Miraghaie, R. , and Berry, D. A. , 2007, “Coherent Structures of the Near Field Flow in a Self-Oscillating Physical Model of the Vocal Folds,” J. Acoust. Soc. Am., 121, pp. 1102–1118. 10.1121/1.2409488 [DOI] [PubMed] [Google Scholar]
- [37]. Xue, Q. , Mittal, R. , Zheng, X. , and Bielamowicz, S. , 2012, “Computational Modeling of Phonatory Dynamics in a Tubular Three-Dimensional Model of the Human Larynx,” J. Acoust. Soc. Am., 132(3), pp. 1602–1613. 10.1121/1.4740485 [DOI] [PMC free article] [PubMed] [Google Scholar]
- [38]. Gharib, M. , Rambod, E. , and Shariff, K. , 1998, “A Universal Time Scale for Vortex Ring Formation,” J. Fluid Mech., 360, pp. 121–140. 10.1017/S0022112097008410 [DOI] [Google Scholar]
- [39]. Link, G. , Kaltenbacher, M. , Breuer, M. , and Döllinger, M. , 2009, “A 2D Finite-Element Scheme for Fluid–Solid–Acoustic Interactions and Its Application to Human Phonation,” Comput. Methods Appl. Mech. Eng., 198(41), pp. 3321–3334. 10.1016/j.cma.2009.06.009 [DOI] [Google Scholar]
- [40]. Steinecke, I. , and Herzel, H. , 1995, “Bifurcations in an Asymmetric Vocal-Fold Model,” J. Acoust. Soc. Am., 97(3), pp. 1874–1884. 10.1121/1.412061 [DOI] [PubMed] [Google Scholar]
- [41]. Agarwal, M. , Scherer, R. , and Witt, K. D. , 2001, “Effects of False Vocal Fold Width on Translaryngeal Flow Resistance,” Proceedings of the International Conference on Voice Physiology and Biomechanics: Modeling Complexity, Marseille, France, August 2004. [Google Scholar]
- [42]. Scherer, R. C. , Shinwari, D. , De Witt, K. J. , Zhang, C. , Kucinschi, B. R. , and Afjeh, A. A. , 2001, “Intraglottal Pressure Profiles for a Symmetric and Oblique Glottis With a Divergence Angle of 10 Degrees,” J. Acoust. Soc. Am., 109(4), pp. 1616–1630. 10.1121/1.1333420 [DOI] [PubMed] [Google Scholar]
- [43]. Alipour, F. , and Scherer, R. C. , 2001, “Effects of Oscillation of a Mechanical Hemilarynx Model on Mean Transglottal Pressures and Flows,” J. Acoust. Soc. Am., 110(3), pp. 1562–1569. 10.1121/1.1396334 [DOI] [PubMed] [Google Scholar]


