

Abstract
Purpose: To present a computer-aided detection tool for identifying, quantifying, and evaluating tuberculosis (TB) cavities in the infected lungs from computed tomography (CT) scans.
Methods: The authors’ proposed method is based on a novel shape-based automated detection algorithm on CT scans followed by a fuzzy connectedness (FC) delineation procedure. In order to assess interaction between cavities and airways, the authors first roughly identified air-filled structures (airway, cavities, esophagus, etc.) by thresholding over Hounsfield unit of CT image. Then, airway and cavity structure detection was conducted within the support vector machine classification algorithm. Once airway and cavities were detected automatically, the authors extracted airway tree using a hybrid multiscale approach based on novel affinity relations within the FC framework and segmented cavities using intensity-based FC algorithm. At final step, the authors refined airway structures within the local regions of FC with finer control. Cavity segmentation results were compared to the reference truths provided by expert radiologists and cavity formation was tracked longitudinally from serial CT scans through shape and volume information automatically determined through the authors’ proposed system. Morphological evolution of the cavitary TB were analyzed accordingly with this process. Finally, the authors computed the minimum distance between cavity surface and nearby airway structures by using the linear time distance transform algorithm to explore potential role of airways in cavity formation and morphological evolution.
Results: The proposed methodology was qualitatively and quantitatively evaluated on pulmonary CT images of rabbits experimentally infected with TB, and multiple markers such as cavity volume, cavity surface area, minimum distance from cavity surface to the nearest bronchial-tree, and longitudinal change of these markers (namely, morphological evolution of cavities) were determined precisely. While accuracy of the authors’ cavity detection algorithm was 94.61%, airway detection part of the proposed methodology showed even higher performance by 99.8%. Dice similarity coefficients for cavitary segmentation experiments were found to be approximately 99.0% with respect to the reference truths provided by two expert radiologists (blinded to their evaluations). Moreover, the authors noted that volume derived from the authors’ segmentation method was highly correlated with those provided by the expert radiologists (R2 = 0.99757 and R2 = 0.99496, p < 0.001, with respect to the observer 1 and observer 2) with an interobserver agreement of 98%. The authors quantitatively confirmed that cavity formation was positioned by the nearby bronchial-tree after exploring the respective spatial positions based on the minimum distance measurement. In terms of efficiency, the core algorithms take less than 2 min on a linux machine with 3.47 GHz CPU and 24 GB memory.
Conclusion: The authors presented a fully automatic method for cavitary TB detection, quantification, and evaluation. The performance of every step of the algorithm was qualitatively and quantitatively assessed. With the proposed method, airways and cavities were automatically detected and subsequently delineated in high accuracy with heightened efficiency. Furthermore, not only morphological information of cavities were obtained through the authors’ proposed framework, but their spatial relation to airways, and longitudinal analysis was also provided to get further insight on cavity formation in tuberculosis disease. To the authors’ best of knowledge, this is the first study in computerized analysis of cavitary tuberculosis from CT scans.
Keywords: cavitary tuberculosis, airway tree, computer aided detection, segmentation, fuzzy connectedness
INTRODUCTION
Tuberculosis (TB), a bacterial disease due to Mycobacterium tuberculosis, still remains one of the leading causes of morbidity and mortality globally. According to the 2012 WHO report,1 there were 8.7 × 10⁶ new cases of active TB and 1.4 × 10⁶ deaths related to TB in 2011 alone. In addition, drug-resistant forms of TB are on the rise and treatment of these patients is even more challenging.
TB granulomas are the hallmark of human TB, and the main abnormalities are a progressive extension of inflammation and necrosis.2 Inflammation of lung tissues can liquefy and communicate with the airway leading to lung cavitation.3 The process of cavity formation is not well understood, but cavities contribute to morbidity, mortality, transmission, and antibiotic failure.4 Patients with cavitary disease have high mycobacterial burden and are also highly infectious. It is thought that the cavity is the principal site in which antibiotic resistance arises.5 Cavities occur in multiple lung pathologies, but are a useful marker of TB infection for diagnostic and prognostic purposes.6 While new treatments for TB are being developed,7 tools needed to monitor patients on TB treatments and to quantify the disease remain limited and antiquated, in both preclinical and clinical settings.
In general, quantification of TB disease and cavities is performed by expert radiologists using manual measurements, often on a 2D plane.8, 9 However, manual analysis is time consuming and it suffers from limited reproducibility due to inter- and intraobserver variability. Moreover, extracting spatial information of the cavities, especially with regard to airways is difficult with manual methods. In this study, we hypothesize that this information, the spatial distance between cavities and airway tree can be helpful to distinguish a cavity formation from other air- or fluid-filled lung structures with different disease pathophysiologies. However, identifying airways, particularly in pathological lungs, is an extremely challenging task due to increased difficulty in separating airway structures from diseased tissues. As an example, Fig. 1 shows a typical cavitation from a computed tomography (CT) scan of a rabbit infected with TB. Red blocks show magnified view of local regions containing cavities and airways in the second row. Dashed and solid arrows point to the airways and cavities, respectively. Note that some cavities (b) and (c) indicate the coexistence of consolidations. Because of dense distortion of consolidations, airway identification can be quite challenging (c). Given these difficulties, a computer-aided detection and quantification tool is of great importance for reliable and accurate assessment of lung cavitation in TB and help radiologists to aid diagnostic process.10
Figure 1.

Cavitation examples from CT scans. (a) Cavity without surrounding consolidation; (b) cavity surrounded by consolidation; (c) dense pathologies with airway and cavities. Airways and cavities are pointed out by dashed and solid arrows, respectively.
Relevant literature regarding computerized methods for cavity detection and segmentation is limited to the automatic or semiautomatic analysis of chest radiography scans.11, 12, 13 To the best of our knowledge, our study is the first attempt to develop a computer-aided tool for qualitative and quantitative analysis of TB cavities from CT scans. In this paper, we proposed a novel shape-based airway and cavity detection method, followed by fuzzy connectedness (FC) image delineation algorithms14 for automatic airway tree extraction and cavity segmentation. We performed longitudinal evaluation of TB cavities using volume, surface, and shape information, and also investigated relative positioning of cavities with respect to airways, providing a broader analysis platform for clinicians.
Figure 2 illustrates the flowchart representation of our proposed methodology. To avoid potential false positives outside the lungs, we first roughly estimated the lung region from the original CT images. This procedure was based on conventional CT image thresholding for the lung organ followed by morphological operations as commonly utilized in the clinical settings.15, 16 Although a rough identification of lung regions is often satisfactory for this step, more advanced lung segmentation algorithms can instead be used. Second, for automatic cavity and airway detection, a strict threshold was applied to lung fields to exclude all nonair voxels from lungs. Then, connected component analysis was performed over the binary image, forming local groups among which the largest ones were expected to be either airways or cavities (distinct in shapes: tree-like vs bulb-like, respectively). Third, a support vector machine (SVM) classifier was further trained with cavity and airway structures so that cavity and airway locations were automatically detected for any given test image and those regions were used as initial seed locations for initiating FC based delineation procedure for both airway and cavities. Fourth, while intensity based FC delineation was used to segment out cavity regions from detected voxel groups using SVM process, we developed a hybrid approach for airway tree extraction by combining two well-known airway extraction techniques in a single segmentation engine: gray-scale morphological reconstruction17 and multiscale vesselness.18 For this integration, we created a new affinity function for FC segmentation because airway tree extraction in small animals is more challenging than human subject due to (i) lower image resolution, (ii) presence of large imaging artifacts, and (iii) dense pathologies spread over the lungs such as consolidations. With the proposed strategy, we improved the final airway tree with a high sensitivity and a low amount of leakage. The details of each step of the proposed framework are explained in Sec. 2.
Figure 2.

Flowchart of the cavity analysis algorithm.
THEORY AND ALGORITHMS
In this section, we first present the proposed shape-based method for airway and cavity detection. Then, the basic theory of FC (Ref. 14) is explained in detail, followed by the FC based cavity segmentation method and airway tree extraction algorithm with novel affinity relations.
Shape-based airway and cavity detection using SVM
Our airway and cavity detection algorithm includes four steps: (i) preprocessing CT scans to identify candidate airway and cavity regions, (ii) refinement of candidate regions by morphological operations, (iii) feature extraction from refined regions, and (iv) SVM classification based on the extracted structures. Since cavitary TB presents as air-filled regions with approximately spherical shapes (Fig. 1), in step (i), we used a strict thresholding method with a Hounsfield unit (HU) < − 950 to indicate air-filled regions. This process was reliable given that the HU for air is −1000 and this value is consistent with the observation from the experimental data. The connected component algorithm was then used to group the different regions, and morphological closing was performed next to fill the local holes within each region in step (ii). By this process, the large air-filled structures within the lung regions, airway segments, and cavities were approximately identified. In order to further distinguish cavities and airways from other structures, several shape features were extracted in step (iii). As illustrated in Fig. 3, several candidate groups were first formed by thresholding and the connected component analysis. Note that the esophagus (tube without branching) running parallel with the airway (1) and a air-filled region (3), which could be a possible false positive cavity, were also included at initial step. The latter one may occur if segmentation of lungs are not conducted prior to computer-aided detection and quantification system for cavities. An accurate lung segmentation in the preprocessing step can avoid such false positives.
Figure 3.

Example of the airway and cavity detection algorithm. (a) Roughly identified candidate groups, generated by thresholding and connected component analysis, with bounding boxes. (b) and (c) Two views showing locations of different structures within the body region. (d) Detected airway (1) and cavities (2) are rendered. Note that a possible false positive (3) can be seen if lung segmentation is not conducted as a preprocessing step.
For the purpose of SVM classification, each connected binary group g was used to extract the following features: the volume V(g), eigenvectors and eigenvalues λ1(g), λ2(g), λ3(g) corresponding to principal axis of g, the smallest bounding box B(g) enclosing the binary group g, and the oriented smallest bounding box along major axis OB(g). We also used the statistics of B(g) and OB(g) to enhance the feature vector: volumes VB(g) and VOB(g), lengths lB1(g), lB2(g), lB3(g) and lOB1(g), lOB2(g), lOB3(g). Finally, we combined all these extracted features in a way to reflect relative feature resemblance within the same model. For this, our feature vector was designed to include the features in the following combination to have a comprehensive cavity SVM likelihood model: (i) volume ratios V(g)/VB(g) and V(g)/VOB(g), (ii) bounding box length ratios lB1(g)/lB2(g), lB1(g)/lB3(g), and lB2(g)/lB3(g), (iii) oriented bounding box ratios lOB1(g)/lOB2(g), lOB1(g)/lOB3(g), and lOB2(g)/lOB3(g), and (iv) eigenvalue proportions λ1(g)/λ2(g), λ1(g)/λ3(g), λ2(g)/λ3(g), and λ1(g)/λ2(g)λ3(g) [as λ1(g) ⩽ λ2(g) ⩽ λ3(g)]. The motivation for using eigenvalues is to include oriented shape information in the analysis.
After SVM classification,19, 20 the likelihood score of airway and cavity candidates from test images were estimated by assessing their feature vector compatibility with the model as complied with the mostly used CAD systems.15, 21, 22 Based on the likelihood scores resulted from SVM, airway (1) and cavities (2) were distinguished from other structures, and labeled accordingly.
Fuzzy connectedness image segmentation
In the FC framework, a fuzzy topological construct characterizes how voxels of an image hang together to form an object through a predefined function called affinity.23 Assuming denotes a 3D cubic grid representing the image space, where each element of V is called a voxel, a topology on an image is given in terms of an adjacency relation (μα) such that the adjacency relation is a binary relation on the image and determines which pair of voxels are close enough to be considered connected: . Theoretically, if voxels p and q are α-adjacent to each other, then μα(p, q) = 1; otherwise, μα(p, q) = 0. While affinity is intended to be a local relation, a global fuzzy relation, called fuzzy connectedness, is induced on the image domain by the affinity functions. This is done by considering all possible paths between any two voxels, p and q, in the image domain, and then assigning a strength of fuzzy connectedness to each path. The level of the fuzzy connectedness between any two voxels p and q is considered to be the maximum of the strengths of all paths between p and q.
An affinity relation κ is the most fundamental measure of local hanging togetherness of nearby voxels. For a path π, which is a sequence of voxels ⟨p1, p2, …, pl⟩ with every two successive voxels being adjacent, and given the fuzzy affinity function μκ(pi, pi+1), the strength of the path is defined as the minimum affinity along the path
| (1) |
Using the strength of the path formulation, the strength of connectedness between any two voxels p and q is the strength of the strongest path between them, and formulated as
| (2) |
where denotes the set of all paths between p and q. Subsequently, a fuzzy connected object O in an image can be defined for a predetermined set of seeds S. Since the level of FC between any two voxels p and q is considered to be the maximum of the strengths of all paths between them, for multiple seeds, the fuzzy object membership function for O or the strength of connectedness of O is defined as follows:
| (3) |
For given κ, S, and an image, an efficient computational solution for computing , segmenting O is presented in Ref. 14. As a last step, the binary segmentation is created by automatic thresholding over the fuzzy image O from the histogram analysis.14 In addition, we presented the FC algorithm below to make this paper self-contained.
| Algorithm Delineation of objects through FC. |
| Input: Image I, threshold θ < 1, affinity κ defined on the image space , a set of seeds S indicating the object of interest (it comes from cavity detection algorithm). |
| Output: Delineated object CS, θ. |
| Auxiliary Data Structures: A characteristic function of CS, θ and a queue Q of voxels. |
| 1: Begin |
| 2: Set g(s) = 1 for all s ∈ S and g(c) = 0 for all |
| 3: Push to Q all voxels for which κ(c, s) > θ for some s ∈ S; |
| 4: WhileQ is not empty Do |
| 5: Remove a voxel c from Q; |
| 6: Ifg(c) = 0 Then |
| 7: Set g(c) = 1; |
| 8: Push to Q all voxels for which κ(d, c) > θ; |
| 9: EndIf; |
| 10: EndWhile; |
| 11: Create PS, θ as a set of all voxels c with g(c) = 1; |
| 12: End |
In general FC, the most prominent affinities used for image segmentation so far are (i) adjacency-based μα, (ii) homogeneity-based μψ, and (iii) object feature-based μϕ affinities such that fuzzy affinity is defined as
| (4) |
where μψ(p, q) captures the homogeneity between p and q, with a higher value for similar pairs. Object feature-based affinity μϕ(p, q) defines the hanging-togetherness of p and q in the target object, which is based on the likeliness of their feature values with respect to the expected feature distribution of the target object. The general forms of μψ(p, q) and μϕ(p, q) are
| (5) |
| (6) |
where σψ and σϕ are two different standard deviation parameters used for homogeneity and object feature distribution, m is the mean object feature value, and f denotes the image intensity function: .
Automatic cavity segmentation
Segmentation for cavity and airway faces different image characteristics. For airway segmentation, due to the weak boundary and low contrast characteristic of airways in CT image with noise, imaging artifacts, and partial volume effect, we have chosen FC to combine complementary information provided by different airway enhancing techniques. For cavity segmentation on the other hand, since cavities appear homogeneous region with well-defined boundaries, it is an easier problem as compared with airway segmentation that we have a broader selection of methods. Hence, it is expected that any region based segmentation algorithms such as region growing, graph-cut, or random walk can be used for the cavity segmentation. In that sense, FC has been proven in many studies that it is a robust, accurate, and efficient method; therefore, FC is well suited for this task, and intensity I(x) information alone is sufficient for generalized FC segmentation. Furthermore, given the seed points detected by SVM, it is most direct to segment both airway and cavity under the same FC framework without switching to a different method for cavity segmentation. Hence, we set fcavity(x) = I(x), and the affinity κ is defined using formulation in Sec. 2B.
Image enhancement for airway extraction
Airway extraction is a more challenging task compared to cavity segmentation. Noise, imaging artifacts, and partial volume effect can lead the segmentation algorithm to leak into nonobject territories or failure by breaking the airway wall boundaries as well as the continuity of the airway structure within the image. Therefore, image enhancement is often necessary for airway tree extraction because of local intensity variations. And here, we first applied two methods for image enhancement for higher accuracy. In pulmonary CT images, it has been shown previously that airways can be regarded as local minima of intensity in a 2D slice I that can be enhanced by applying grayscale morphological reconstruction,17 and tubular structures that can be enhanced by multiscale vesselness.18 Therefore, we aim to use these two methods to reduce false positives and increase accuracy.
Gray-scale morphological reconstruction: The morphological reconstruction technique enhances airways of different diameters from the perspective of appearance using a range of morphological structuring elements (SE) SEn by successive dilation on the basis four-connected binary SE (i.e., SE0), so that in the resulting image J, the local minima smaller than SEn is filled in with a value proportional to the difference between max and min values within neighborhood SEn. Therefore, the difference image, i.e., D = J − I, infers potential airway locations. The algorithm is then completed by combining maximum responses from different SEs. Figure 4 third column shows typical images with enhanced airways through gray-scale morphological reconstruction of the original CT images (shown in the first column); emphasized airways by this method are shown with red arrows.
Figure 4.

The result of grayscale morphological reconstruction (right column) and vesselness computation (middle column) for a CT scan (left column) from a rabbit infected with TB.
Vesselness filtering: Alternative to the gray-scale morphological reconstruction, the vesselness algorithm is often employed to improve vascular structure identification and delineation by analyzing the second-order information of a Gaussian convoluted image (i.e., Hessian).18 This technique enhances airway structure from the shape perspective. Specifically, eigenvalue decomposition is performed over the Hessian matrix and the resulting ordered eigenvalues, i.e., (|λ1| ⩽ |λ2| ⩽ |λ3|), representing the approximate shape of local structure, are examined. The vesselness filter Vσ can conventionally be formulated as
| (7) |
for a bright vessel on dark background. Parameters of the vesselness filter are as follows: RA = |λ2|/|λ3|, RB = |λ1|/|λ2λ3|, and . The vesselness measure above is calculated at different scales (σ) and the maximum response is achieved at a scale that matches the size of the vessel. Therefore, by using a multiscale approach, one can cover a range of vessel widths and find the maximum response by V = max (Vσ), σmin ⩽ σ ⩽ σmax . Moreover, with this technique, we obtain the vesselness measure as well as the approximate local vascular structure scale for each voxel in the image. Second column in Fig. 4 shows the results of vesselness computation for a CT scan of a rabbit infected with TB. Airway locations determined by this filtering are emphasized by red arrows.
A new affinity function definition for airway tree extraction
In Sec. 2D, we showed that both vesselness filtering V(x) and gray-scale morphological reconstruction D(x) can help identify airway structures and provide continuity of the airway boundary. In this section, we propose a new affinity function based on a novel integration of these methods within a single FC platform. Since both methods have their unique strength and drawbacks, and effectiveness of the FC algorithm depends on the choice of the affinity function, we synergistically integrated these features in addition to the standard intensity information of the voxels through an appropriate affinity function design. In mathematical notation, we devise a new feature vector fAirway for a given voxel x as fAirway(x) = {I(x), D(x), V(x)}.
Let I(x), D(x), V(x) features be represented in the FC segmentation algorithm with corresponding affinities , , and . Once intensity, vesselness, and gray-scale morphological features are represented with these affinities successfully, then the segmentation can be conducted precisely. For this purpose, we revisit the advantages of the features I(X), D(x), and V(x): (1) pure intensity information is reliable often when large airways are extracted, (2) small airways are extracted when gray-scale or vesselness feature are used. Thus, it is of interest to combine V(x) and D(x) for small airway analysis. Furthermore, because it is evident that the local scale information [S(x)], provided by multiscale vesselness computation, gives additional control over the size of airways, one may use S(x) as a binary decision operator to decide whether it is appropriate to use I(x) or combined D(x) and V(x). That is, the design of the affinity function can be derived by S(x) as intensity is reliable only for large airways while the other two features yield support for smaller ones. Hence, the three features are further combined in a new affinity function with a weight parameter k as
| (8) |
where ST is the threshold, which is useful for determining large airways, and k is the factor to control the intensity ratio when compared with the other two features in computing the final affinity function . It is expected that intensity plays a less important role for finer structures, so k can be formulated as k = S/Smax . Further investigation of the parameter selection is explained in Sec. 3. Although blurred and soft boundaries of airways can often cause leakage into neighboring structures, our proposed multiscale hybrid algorithm adapts the local hanging-togetherness principle of the FC to overcome this difficulty.
Local refinement of segmentation results and distance computation
Once cavities and airways were segmented, we performed a local refinement of the segmentation results with finer control within the region where cavities met the airways. A local ROI was extracted first by roughly identifying the regions where cavities met airways, and then, FC was initialized with the already segmented airway as a seed set. Note that, small airways can be recovered by this local refinement if they are missed by the global settings of the FC segmentation during the whole airway tree extraction. The results of the local refinement can be seen in Fig. 5, which depicts that local refinement process (b) can find small airways which were missed in global airway tree extraction (a).
Figure 5.

Airway extraction result (a) without and (b) with local refinement.
After the final step of the proposed detection and delineation strategy, the relative positioning of airways and cavities, and their morphometric features can be studied quantitatively. This quantification may bring certain insights into cavity evolution, which is rarely studied in the literature and often based on qualitative measurement of expert radiologists. Since manual measurements are often based on 2D and do not fully appreciate 3D structural analysis of two nearby objects, there is a strong need to compute relative spatial position and the shortest distance between these two structures. In our computational evaluation framework, spatial positions of the airways and cavities were analyzed through distance transform (DT). We used Maurer's algorithm24 to achieve this goal in linear time. In practice, the minimum distance between the cavity boundary and the airways was automatically found by finding the minimum value of the DT map within the airways mask (i.e., extracted airway tree). Sample representations of this computation are given in Sec. 3D.
RESULTS
In this section, we first present the data acquisition process for our study. Subsequently, the cavity and airway detection results are provided. Next, the airway and cavity segmentation results are presented, and the accuracy of the cavity segmentation algorithm is evaluated in comparison with manual references provided by two expert observers who have extensive experience with TB.
Data and imaging
In this study, we constructed small animal models to explore cavitary TB disease in a longitudinal manner. After injection of the TB, CT images of the rabbits were collected at multiple time points to observe cavity formation longitudinally. Although CT images usually provide high resolution structural information of the live subjects, in our experience, breathing artifacts were much more severe for small animals than human subjects, limiting the amount of quantitative data that we could potentially extract from these images. Techniques such as respiratory gating and mechanical ventilation could be used to reduce respiratory artifact. However, implementation of these techniques requires costly equipment, which is challenging to safely use and maintain in a BSL-3 environment. (BSL stands for biosafety level. BSL-2 is suitable for work involving agents that pose moderate hazards to personnel and the environment. BSL-3 is applicable to clinical, diagnostic, teaching, research, or production facilities in which work is done with indigenous or exotic agents, which may cause serious or potentially lethal disease through the inhalation route of exposure.25) Therefore, we built a chamber with a simple valve-controlled breathing circuit to control (i) inspiration and expiration, (ii) pulmonary pressure, and (iii) regulated anesthetic delivery. With this approach, the breathing artifacts were significantly reduced. Figure 6 shows an example CT slice with reduced breathing artifacts (approximately same anatomical slice were chosen to demonstrate the effect of the breathing artifacts).
Figure 6.

CT scan and a zoomed region for a rabbit without (a) and with (b) the breathing controlled mechanism. Breathing artifact was significantly reduced in (b).
We performed serial CT scans on 12 rabbits infected with M. tuberculosis H37Rv. Image acquisition was utilized in a Neurologica CereTom eight slice CT scanner. Pressure controlled breath-holding was used to minimize motion artifacts, and it standardized pulmonary pressures for all scans (i.e., baseline and at week's 3, 4, 5, and 7 postinfection). Nonanesthetized scans were performed at weeks 1 and 2 prior to the development of cavities in this model, in a break-proof sealed container with HEPA-filtered gas exchange ports. For breath-hold scans, rabbit anesthesia was induced in BSL-3 environment using intramuscular ketamine (20 mg/kg) and xylazine (5–10 mg/kg as required) and rabbits were maintained on 1% isoflurane in 3 l min−1 of medical Oxygen. The animals were intubated and transferred to a custom built chamber, in which all joints were sealed and gas exchange occurs through HEPA grade filters. Animals were then transported in this sealed chamber to a BSL-2 environment where CT scanning was performed. Set pressure breath-holds were achieved by closing the expiratory loop of the respiratory circuit to allow the pressure to increase until displacement of a column of water at the relevant depth was achieved and then we closed the circuit during acquisition. In total 54 images were generated in breath-holding condition as six of the rabbits are sacrificed before week 7. The image size is 512 × 512 × 318 with spacing 0.3 × 0.3 × 0.7 mm.
Evaluation of airway and cavity detection
As a result of thresholding and connected component analysis performed on 54 pulmonary CT images, a total of N = 178 objects were identified. These objects were labeled as “airway,” “cavity,” or “others” (all identified air-filled regions other than cavities and airways such as esophagus) by visual inspection of expert observers. Shape feature vectors were extracted for every identified object. In order to test the effectiveness of extracted features, we repeated our experiments using a different combination of individual feature types to select the best set of features that identify cavities in high accuracy. As stated in Sec. 2A, shape features were from four categories: volume based (SubVol), bounding box based (SubBox), oriented bounding box based (SubOriBox), and eigenvalue based (SubEigen); therefore, a total of five experiments were performed for a feature ranking test.
After extracting the feature vectors for each object, the data set was separated randomly by selecting t% of the whole data set for training purpose and the rest as a testing reference. Using the training set, a SVM classifier was trained that further labels the objects in a testing set based on the feature vectors. The resulting outputs were subsequently compared with reference truth and the number of false positive cases FPA, FPC and false negative cases FNA, FNC were calculated for airway (“A”) and cavity (“C”), respectively. Consequently, the accuracy (i.e., Ω) for a specific sample case at t% was calculated as
| (9) |
For every t% setting, a bootstrapping approach was employed to better estimate the accuracy of the proposed SVM system at different size of training data. That is, the whole data set was randomly resampled 100 000 times for a fixed t%, and the estimation of accuracy at t% was the average of 100 000 repeated experiments. We selected 81 settings for and the results are shown in Fig. 7. As can be seen from the figure that, as expected, the detection accuracy is consistently higher with more training data, and the increase is more pronounced at small training sizes. In the same figure, the effectiveness of different subsets of the features were illustrated in different colors, and the best performance was achieved when we used full set of features.
Figure 7.

Accuracy of the SVM airway and cavity detection algorithm with different feature sets.
Note also that for airway detection, a further constraint was used to refine the result for airway detection (“airway refined”). For every 3D chest CT image, it is expected that among the roughly identified candidate region, one and only one region should be detected as the main airway structure. Therefore, for a specific image, the candidate group achieving the highest score in the SVM system was selected as airway, while all others were labeled as nonairway. This process greatly promoted the performance of airway detection. It can be observed that this constraint is especially effective for the subset “SubVol” of the whole feature set. “SubVol” represents two features: ratio between volume of candidate subject and volume of its bounding box, and ratio between volume of candidate subject and volume of its oriented bounding box. Without reinforcing the single airway rule, these two features are not strong and stable enough because there can be multiple regions approximately satisfying the constraints (although not better than the true airway candidate). As shown in Fig. 7, if 50% of the data are selected as training set and the other 50% as testing set, the accuracy of airway detection was found to be 95.7% without constraint, and 99.8% with constraint. The accuracy of the cavity detection was obtained as 94.61%. Therefore, it is evident that the automatic algorithm is capable of capturing cavities from 3D shape information.
Evaluation of the proposed segmentation algorithm for airway and cavity delineation
For small animal CTs, since it is subjective and time consuming to create ground truth for airway structures, participating expert radiologists visually verified the airway segmentation results. Some examples of airway extraction are given in Fig. 8 for a qualitative inspection. As it can be simply seen from the figure, the boundary of the cavity and nearby airway structures were identified successfully. Furthermore, we tested the proposed airway segmentation algorithm quantitatively on publicly available human CT scans (EXACT09 challenge26) and obtained promising results. Based on the evaluation metric provided by the challenge organizers,26 we obtained a second best detection rate with a low false positive rate (<1%). Extended evaluation metrics of the segmentation challenge and results of the dataset from human CT scans is outside the scope and aim of this paper. Nevertheless, all relevant results can be accessed from our recent conference publication.27
Figure 8.

(a)–(d) Examples for airway and cavity extraction.
To evaluate the accuracy of our cavity segmentation algorithm, manual delineations provided by two expert observers (blinded to their evaluations) were used as reference standards. Figures 910 show the volume agreement of the proposed method, compared with reference standards. The linear regression lines were found to be y = 1.0301x + 43.273 and y = 1.0109x + 33.52, with a correlation coefficient of R2 = 0.9926 and R2 = 0.9966, respectively. We also computed the Dice similarity coefficient (DSC) for overlap measure of segmented objects. In addition, interobserver agreement was also calculated through DSC. The overall DSC rates for segmentation evaluation and observer agreement are given in Fig. 11.
Figure 9.

Quantitative evaluation of cavity segmentation as compared with observer 1.
Figure 10.

Quantitative evaluation of cavity segmentation as compared with observer 2.
Figure 11.

DSC results for proposed method with regard to manual segmentations.
Surface area may also have the potential to be used as a reliable marker for longitudinal evaluation of cavities; therefore, it is of interest to compute surface area information accurately and efficiently. However, its measurement through manual assessment is almost intractable. On the other hand, automatic surface area computation is relatively simpler once cavities are segmented. After the cavity boundary was obtained as a result of the FC delineation, we used Crofton formula28 to estimate the surface area. Simply, estimated surface of the cavity c is
| (10) |
where S is the computed surface area, is the set of all lines in the 3D space, and χ is the Euler-Poincare characteristics and is equal to the number of connected components of the intersection of c with a line L. The equation above is approximated for discrete cases too, where Lk is the set of 3D discrete lines parallel to the direction k, wk is the discretization weight associated to 3D direction k, and ωk is the density of discrete lines in direction k. The details of the surface area computation and the algorithm are given in Ref. 28. Note that all segmentation experiments and computations in this study were conducted on 3D.
Finally, longitudinal assessment of cavity volumes and surface areas for three example subjects, as qualitatively illustrated in Fig. 15, are shown in Fig. 12. Volume and surface area changes obtained by the proposed methods were illustrated, and volume results were compared with manual reference (left column). As shown, the cavities grow most rapidly in the first week after formation, then the speed of growth decreases toward the maximum cavity volume/surface area (Rabbit I) or starts to shrink (Rabbits H and C). At the final stage, the air-filled region collapses in some instances. Notably, changes in surface area (right column) demonstrate the same trend as volume change.
Figure 15.

Examples for airway extraction. Week 3, 4, 5 for Rabbits C and D; week 3, 4, 5, 7 for Rabbit I; and week 4 for Rabbit A are shown in the figure. As illustrated, cavities are within close vicinity for Rabbits C, D, and I; while it is away from segmented airway for Rabbit A due to broken structure caused by imaging artifacts.
Figure 12.

Longitudinal change in cavity volume and surface area for three example subjects.
Computational cost: With our method, any CT scan with longitudinal points can be analyzed both qualitatively and quantitatively within seconds. For airway and cavity detection using SVM, the trained system takes less than 1 s to process a new case. For FC segmentation, our approach takes an average of 50 s to segment airways and 40 s to segment cavities per scan on a Linux machine with 3.47 GHz CPU and a 24 GB memory. In total, the core algorithms takes less than 2 min. Other computational time involves generating grayscale reconstruction and vesselness, standard computational complexity was reported in the literature.18, 29
Distance between airway and cavity with radiological interpretations
Figure 13 illustrates the procedure of measuring the minimum distance between cavity and airway. Binary regions defining the cavity (red) and the airway (green) are overlaid on the DT map of the cavity, and the minimum value of DT within the airway region is identified. Figure 14 shows how the distance is measured manually by expert observers. Manual measurement appeared to be less accurate than automatic computation even if ideal segmentation was provided because automatic results were measured in 3D with subvoxel accuracy but manual measurement was restricted within the 2D slice plane.
Figure 13.

Automated distance measurement. (a), (c), and (e) DT overlaid by cavity (bulb structure) and airway (tubular structures pointed by arrows) segmentations from three views; (b), (d), and (f) are magnified display of (a), (c), and (e) showing the nearest airway location to cavity.
Figure 14.

Manual distance measurements for two images (a) and (b) with magnified display where the minimum distance is measured.
Figure 15 shows the qualitative results for example cases of four rabbits where the minimum distance between cavities and the airway is minor (<1 mm, Rabbit D), small (2–3 mm, Rabbits C and I), and large (14 mm, Rabbit A). Quantitative longitudinal results for individual rabbits are shown in Fig. 16. As illustrated, the distance is relatively stable for individual rabbits.
Figure 16.

Minimum distance to airway measurements for four rabbits along time. As illustrated, the distance is relatively stable for an individual rabbit while different between rabbits.
Figure 17 shows the histogram of minimum distance for all 36 cases with cavitation. It can be noted that three of the cases had the problem of a missed branch. The minimum distance to the nearby airways for the rest 33 cases was 1.59 ± 1.07 mm. The result confirms quantitatively that the cavity is closely related with the bronchial tree. Hence, for most cases (33/36 = 92%) in our study, cavities and airways were shown to be adjacent with strong/weak connection under small/medium distances. Nevertheless, a failure happened due to broken continuity of airways caused by imaging artifacts, and it resulted in a large distance (Rabbit A). Figure 18 qualitatively illustrated the robustness of the method under severe motion artifacts using rabbit images without the breathing controlled mechanism. As shown, the proposed method is robust even in presence of motion artifacts and pathologies (a)–(c), while it may fail to fully extract the airway structure for some cases where airway (pointed by solid arrow) appears similar to surrounding tissues (pointed by dashed arrow) in (d)–(f).
Figure 17.

Histogram of minimum distances between cavity and airway in 36 cases.
Figure 18.

Airway segmentation under motion artifact on rabbit images without the breathing controlled mechanism. (a) and (d) Two rabbit images under motion artifacts and blurring with zoomed view shown in (b) and (e). (c) 3D rendering of a successful segmentation showing airway with surrounding consolidation in (a) and (b). (f) 3D rendering of a broken case where the airway structure is not fully extracted as pointed by the yellow arrow due to motion artifacts and blurring, in which case the appearances of airway (pointed by solid arrow) and nonairway (pointed by dashed arrow) are similar.
DISCUSSION
Inarguably, more data will be valuable for further evaluation of the performance of our system, as well as better training of the detection system. Moreover, the proposed method can be used for other cavity formation studies based on different lung diseases.
One may wonder the feasibility of our proposed system for human subjects. Differences between images of small animals and humans are that human CT scans suffer less from motion artifacts with lower contrast between airway lumen and surrounding tissues and that the bronchial tree is much more complex than small animal subjects. It turns out that our algorithm also works on human CT scans by adjusting parameters for the image. Figure 19 shows a preliminary result on human CT scan that presents the feasibility of the algorithm for potential applications. In this example, the spatial resolution was 0.8 × 0.8 × 2.5 mm.
Figure 19.
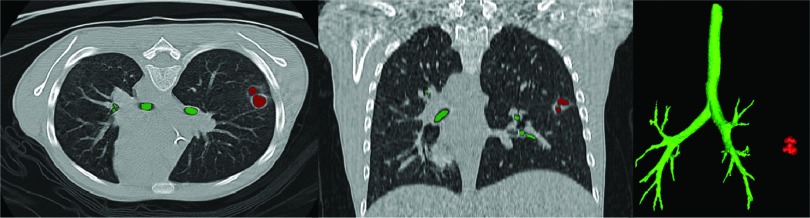
Airway and cavity segmentation of a human CT scan.
Having demonstrated the potential efficacy of such a strategy, one must consider the ethics of studies such as this in clinical trials: Without treatment, TB carries a mortality of approximately 50%. Sputum smear microscopy, the most common method of TB diagnosis, only detects 1/3 of clinical cases.30 Attempts to generate diagnostic algorithms from multiple factors including chest x ray have proved fruitless due to their individual and combined lack of sensitivity.31 Clinicians are therefore left to make the decision of treatment empirically, and individuals (many without TB) are often given a complex drug regimen which carries not only the risk of side effects (including fatal hepatitis), but also increases population exposure to antibiotics and the emergence of drug resistance. Cavitary TB, carries a risk of treatment failure of 15% (the biggest cause for the emergence of MDR and XDR-TB), against normal rates of approximately 2%.32 In the clinic, the physician would always be wise to consider the potential risks of radiation exposure. The potential benefit of CT scanning as a diagnostic/monitoring tool must be weighed carefully against radiation risk (a chest CT is equivalent in exposure to 1 year of background radiation in the United States).33, 34, 35, 36, 37 Newer CT scanners and protocols also allow for lower doses of radiation exposure and continued improvements could allow even lower radiation exposure in the future.38, 39 However, with the impact of undiagnosed TB on global mortality and the need to improve our knowledge about the efficacy of novel therapeutic agents, it would seem careful investigation of this strategy is warranted both for research and clinical application.
CONCLUSION
In this paper, a system for computerized analysis of cavitary tuberculosis from CT scans was proposed. Specifically, a novel shape-based cavity detection algorithm integrated within FC segmentation was developed. Moreover, airway tree was extracted and delineated using a hybrid multiscale method based on a novel fuzzy connectedness affinity function, enabling quantification of the interaction between cavitation and the bronchial tree. The proposed methodology is fully automated and the performance of the proposed method was qualitatively and quantitatively evaluated on pulmonary CT images from longitudinal study of rabbits. It was shown qualitatively and quantitatively that cavities are in the vicinity of the airway tree and longitudinal change of volume and surface area are indicative of disease progress. As an extension of this work, we are currently developing a full pipeline for integrating quantification results from functional images (i.e., positron emission tomography) to create a new scope on the functional characterization of cavities and nearby structures as a complementary to structural characterization.
ACKNOWLEDGMENTS
This research is supported by CIDI, the intramural research program of the National Institute of Allergy and Infectious Diseases (NIAID) and the National Institute of Biomedical Imaging and Bioengineering (NIBIB). W. R. Bishai acknowledges R01 AI 079590 and the support of Howard Hughes Medical Institute (HHMI). S. Jain acknowledges the Grant No. DP2 OD006492-01. A. Kubler is funded by internal grant from Imperial College London, and acknowledges Dr. J. S. Friedland and Dr. P. T. G. Elkington.
References
- Global Tuberculosis Report 2012 (World Health Organization, Geneva, 2012), p. 273. [Google Scholar]
- Hunter R. L., “Pathology of post primary tuberculosis of the lung: An illustrated critical review,” Tuberculosis 91, 497–509 (2011). 10.1016/j.tube.2011.03.007 [DOI] [PMC free article] [PubMed] [Google Scholar]
- Yoder M. A., Lamichhane G., and Bishai W. R., “Cavitary pulmonary tuberculosis: The holy grail of disease transmission,” Curr. Sci. 86, 74–81 (2004). [Google Scholar]
- Elkington P. T., D'Armiento J. M., and Friedland J. S., “Tuberculosis immunopathology: The neglected role of extracellular matrix destruction,” Sci. Transl. Med. 3, 71ps6 (2011). 10.1126/scitranslmed.3001847 [DOI] [PMC free article] [PubMed] [Google Scholar]
- Canetti G., The Tubercle Bacillus in the Pulmonary Lesion of Man: Histobacteriology and its Bearing on the Therapy of Pulmonary Tuberculosis (Springer, New York, 1955). [Google Scholar]
- Visser M. E., Stead M. C., Walzl G., Warren R., Schomaker M., Grewal H. M. S., Swart E. C., and Maartens G., “Baseline predictors of sputum culture conversion in pulmonary tuberculosis: Importance of cavities, smoking, time to detection and w-beijing genotype,” PLoS ONE 7, e29588 (2012). 10.1371/journal.pone.0029588 [DOI] [PMC free article] [PubMed] [Google Scholar]
- Zumla A., Raviglione M., Hafner R., and Fordham von Reyn C., “Tuberculosis,” N. Engl. J. Med. 368, 745–755 (2013). 10.1056/NEJMra1200894 [DOI] [PubMed] [Google Scholar]
- Primack S. L., Logan P. M., Hartman T. E., Lee K. S., and Muller N. L., “Pulmonary tuberculosis and Mycobacterium avium-intracellulare: A comparison of CT findings,” Radiology 194, 413–417 (1995). [DOI] [PubMed] [Google Scholar]
- Jeong Y. J., Lee K. S., Koh W. J., Han J., Kim T. S., and Kwon O. J., “Nontuberculous mycobacterial pulmonary infection in immunocompetent patients: Comparison of thin-section CT and histopathologic findings,” Radiology 231, 880–886 (2004). 10.1148/radiol.2313030833 [DOI] [PubMed] [Google Scholar]
- Bagci U., Bray M., Caban J., Yao J., and Mollura D. J., “Computer-assisted detection of infectious lung diseases: A review,” Comput. Med. Imaging Graph. 36, 72–84 (2012). 10.1016/j.compmedimag.2011.06.002 [DOI] [PMC free article] [PubMed] [Google Scholar]
- Xu T., Cheng I., and Mandal M., “An improved fluid vector flow for cavity segmentation in chest radiographs,” in Proceedings of the International Conference on Pattern Recognition 2010, Istanbul, Turkey (IEEE Computer Society, Washington, DC, 2010), pp. 3376 –3379.
- Vidal C., Hewitt J., Davis S., Younes L., Jain S., and Jedynak B., “Template registration with missing parts: Application to the segmentation of M. tuberculosis infected lungs,” in Proceedings of the IEEE International Symposium on Biomedical Imaging 2009, Boston, MA (IEEE Press, Piscataway, NJ, 2009), pp. 718–721. [DOI] [PMC free article] [PubMed]
- Vidal C., Beggs D., Younes L., Jain S., and Jedynak B., “Incorporating user input in template-based segmentation,” in Proceedings of the IEEE International Symposium on Biomedical Imaging 2011, Chicago, IL (IEEE Press, Piscataway, NJ, 2011), pp. 1434–1437. [DOI] [PMC free article] [PubMed]
- Udupa J. K. and Samarasekera S., “Fuzzy connectedness and object definition: Theory, algorithms, and applications in image segmentation,” CVGIP: Graph. Models Image Process. 58, 246–261 (1996). 10.1006/gmip.1996.0021 [DOI] [Google Scholar]
- Bagci U., Yao J., Wu A., Caban J., Palmore T. N., Suffredini A. F., Aras O., and Mollura D. J., “Automatic detection and quantification of tree-in-bud (TIB) opacities from CT scans,” IEEE Trans. Biomed. Eng. 59, 1620–1632 (2012). 10.1109/TBME.2012.2190984 [DOI] [PMC free article] [PubMed] [Google Scholar]
- Hu S., Hoffman E., and Reinhardt J., “Automatic lung segmentation for accurate quantitation of volumetric x-ray CT images,” IEEE Trans. Med. Imaging 20, 490–498 (2001). 10.1109/42.929615 [DOI] [PubMed] [Google Scholar]
- Aykac D., Hoffman E. A., McLennan G., and Reinhardt J. M., “Segmentation and analysis of the human airway tree from three-dimensional x-ray CT images,” IEEE Trans. Med. Imaging 22, 940–950 (2003). 10.1109/TMI.2003.815905 [DOI] [PubMed] [Google Scholar]
- Frangi A., Niessen W., Vincken K., and Viergever M., “Multiscale vessel enhancement filtering,” Medical Image Computing and Computer Assisted Intervention 1998 (Springer, Berlin Heidelberg, 1998), Vol. 1496, pp. 130–137. [Google Scholar]
- Cortes C. and Vapnik V., “Support-vector networks,” Mach. Learn. 20, 273–297 (1995). 10.1023/A:1022627411411 [DOI] [Google Scholar]
- Yao J., Dwyer A., Summers R. M., and Mollura D. J., “Computer-aided diagnosis of pulmonary infections using texture analysis and support vector machine classification,” Acad. Radiol. 18, 306–314 (2011). 10.1016/j.acra.2010.11.013 [DOI] [PMC free article] [PubMed] [Google Scholar]
- Sluimer I., Schilham A., Prokop M., and Van Ginneken B., “Computer analysis of computed tomography scans of the lung: A survey,” IEEE Trans. Med. Imaging 25, 385–405 (2006). 10.1109/TMI.2005.862753 [DOI] [PubMed] [Google Scholar]
- Katsuragawa S. and Doi K., “Computer-aided diagnosis in chest radiography,” Comput. Med. Imaging Graph. 31, 212–223 (2007). 10.1016/j.compmedimag.2007.02.003 [DOI] [PubMed] [Google Scholar]
- Saha P. K. and Udupa J. K., “Fuzzy connected object delineation: Axiomatic path strength definition and the case of multiple seeds,” Comput. Vis. Image Underst. 83, 275–295 (2001). 10.1006/cviu.2001.0927 [DOI] [Google Scholar]
- C. R.Maurer, Jr., Qi R., and Raghavan V., “A linear time algorithm for computing exact euclidean distance transforms of binary images in arbitrary dimensions,” IEEE Trans. Pattern Anal. Mach. Intell. 25, 265–270 (2003). 10.1109/TPAMI.2003.1177156 [DOI] [Google Scholar]
- Biosafety in Microbiological and Biomedical Laboratories (Centers for Disease Control and Prevention, Atlanta, 2009), p. 30. [Google Scholar]
- Lo P., van Ginneken B., Reinhardt J., and de Bruijne M., “Extraction of airways from CT (EXACT'09),” in Proceedings of the Second International Workshop on Pulmonary Image Analysis, London, UK (2009), pp. 175–189.
- Xu Z., Bagci U., Foster B., and Mollura D., “A hybrid multi-scale approach to automatic airway tree segmentation from CT scans,” in Proceedings of the IEEE International Symposium on Biomedical Imaging 2013, San Francisco, CA (IEEE Press, Piscataway, NJ, 2013), pp. 1308–1311.
- Legland D., Kieu K., and Devaux M.-F., “Computation of Minkowski measures on 2D and 3D binary images,” Image Anal. Stereol. 26, 83–92 (2007). 10.5566/ias.v26.p83-92 [DOI] [Google Scholar]
- Robinson K. and Whelan P. F., “Efficient morphological reconstruction: A downhill filter,” Pattern Recogn. Lett. 25, 1759–1767 (2004). 10.1016/j.patrec.2004.07.002 [DOI] [Google Scholar]
- Steingart K. R., Ng V., Henry M., Hopewell P. C., Ramsay A., Cunningham J., Urbanczik R., Perkins M. D., Aziz M. A., and Pai M., “Sputum processing methods to improve the sensitivity of smear microscopy for tuberculosis: A systematic review,” Lancet Infect. Dis. 6, 664–674 (2006). 10.1016/S1473-3099(06)70602-8 [DOI] [PubMed] [Google Scholar]
- Davis J. L. et al. , “Clinical and radiographic factors do not accurately diagnose smear-negative tuberculosis in HIV-infected inpatients in Uganda: A cross-sectional study,” PloS ONE 5, e9859 (2010). 10.1371/journal.pone.0009859 [DOI] [PMC free article] [PubMed] [Google Scholar]
- Benator D. et al. , “Rifapentine and isoniazid once a week versus rifampicin and isoniazid twice a week for treatment of drug-susceptible pulmonary tuberculosis in HIV-negative patients: A randomised clinical trial” Lancet 360, 528–534 (2002). 10.1016/S0140-6736(02)09742-8 [DOI] [PubMed] [Google Scholar]
- Im J. G., Itoh H., Shim Y. S., Lee J. H., Ahn J., Han M. C., and Noma S., “Pulmonary tuberculosis: CT findings–early active disease and sequential change with antituberculous therapy,” Radiology 186, 653–660 (1993). [DOI] [PubMed] [Google Scholar]
- Demura Y., Tsuchida T., Uesaka D., Umeda Y., Morikawa M., Ameshima S., Ishizaki T., Fujibayashi Y., and Okazawa H., “Usefulness of 18f-fluorodeoxyglucose positron emission tomography for diagnosing disease activity and monitoring therapeutic response in patients with pulmonary mycobacteriosis,” Eur. J. Nucl. Med. Mol. Imaging 36, 632–639 (2009). 10.1007/s00259-008-1009-5 [DOI] [PubMed] [Google Scholar]
- Lee J.-J., Chong P.-Y., Lin C.-B., Hsu A.-H., and Lee C.-C., “High resolution chest CT in patients with pulmonary tuberculosis: Characteristic findings before and after antituberculous therapy,” Eur. J. Radiol. 67, 100–104 (2008). 10.1016/j.ejrad.2007.07.009 [DOI] [PubMed] [Google Scholar]
- Long R., Maycher B., Dhar A., Manfreda J., Hershfield E., and Anthonisen N., “Pulmonary tuberculosis treated with directly observed therapy serial changes in lung structure and function,” Chest 113, 933–943 (1998). 10.1378/chest.113.4.933 [DOI] [PubMed] [Google Scholar]
- Lee H., Oh J., Lee J., Yoo C., Lee C.-T., Kim Y., Han S., Shim Y.-S., and Yim J., “Response of pulmonary tuberculomas to anti-tuberculous treatment,” Eur. Respir. J. 23, 452–455 (2004). 10.1183/09031936.04.00087304 [DOI] [PubMed] [Google Scholar]
- Ohno Y., Takenaka D., Kanda T., Yoshikawa T., Matsumoto S., Sugihara N., and Sugimura K., “Adaptive iterative dose reduction using 3D processing for reduced-and low-dose pulmonary CT: Comparison with standard-dose CT for image noise reduction and radiological findings,” Am. J. Roentgenol. 199, W477–W485 (2012). 10.2214/AJR.11.8275 [DOI] [PubMed] [Google Scholar]
- Fanous R., Kashani H., Jimenez L., Murphy G., and Paul N. S., “Image quality and radiation dose of pulmonary CT angiography performed using 100 and 120 kVp,” Am. J. Roentgenol. 199, 990–996 (2012). 10.2214/AJR.11.8208 [DOI] [PubMed] [Google Scholar]