

Abstract
Objective:
To analyse trends in under-five mortality rate in South Africa (1990–2011), particularly the contribution of AIDS deaths.
Methods:
Three nationally used models for estimating AIDS deaths in children were systematically reviewed. The model outputs were compared with under-five mortality rate estimates for South Africa from two global estimation models. All estimates were compared with available empirical data.
Results:
Differences between the models resulted in varying point estimates for under-five mortality but the trends were similar, with mortality increasing to a peak around 2005. The three models showing the contribution of AIDS suggest a maximum of 37–39% of child deaths were due to AIDS in 2004–2005 which has since declined. Although the rate of progress from 1990 is not the 4.4% needed to meet Millennium Development Goal 4 for child survival, South Africa's average annual rate of under-five mortality decline between 2006 and 2011 was between 6.3 and 10.2%.
Conclusion:
In 2005, South Africa was one of only four countries globally with an under-five mortality rate higher than the 1990 Millennium Development Goal baseline. Over the past 5 years, the country has achieved a rate of child mortality reduction exceeded by only three other countries. This rapid turnaround is likely due to scale-up of prevention of mother-to-child transmission of HIV, and to a lesser degree, the expanded roll-out of antiretroviral therapy. Emphasis on these programmes must continue, but failure to address other aspects of care including integrated high-quality maternal and neonatal care means that the decline in child mortality could stall.
Keywords: AIDS models, child mortality, epidemiology, Millennium Development Goals, neonatal mortality, prevention of mother-to-child transmission, South Africa
Introduction
South Africa remains the country with the largest number of people living with HIV/AIDS. This epidemic led to South Africa being one of only four countries worldwide where the under-five mortality rate (U5MR) was higher in 2005 than in 1990, the Millennium Development Goal (MDG) baseline [1]. Major political and programme changes are believed to have recently reversed this trend, yet there has been a lack of empirical data, particularly for child deaths due to AIDS. [2–5] Effective implementation was hampered by denial of the HIV epidemic and weak political leadership but also by uncertainty around the numbers and causes of deaths [6–8]. This led to the Department of Health declaring the country ‘on course’ for meeting all MDGs [9] at the same time that United Nation sources stated that the country was making ‘no progress’ towards MDG 4 for child survival [10].
There has been limited nationally representative data to assess progress towards the MDGs. Like many emerging economies, South Africa has made efforts to improve completeness of vital registration, making the shift from poor quality vital registration data to medium quality [2,11]. However, deaths due to AIDS at all ages have been poorly identified through vital registration [2–4]. The mortality estimates obtained by the most recent population-based household survey which directly measured birth history are regarded as inaccurate due to data quality concerns [12]. Other sources of data exist to triangulate with vital registration and other household survey estimates but each have particular weaknesses with respect to population coverage and/or quality [3]. Although the quality of vital registration continues to improve, modelled estimates still play an important role in guiding policy priorities and promoting accountability for improving child survival including HIV prevention and treatment.
Several models have been used to estimate national and provincial population demographics and evaluate a wide range of HIV prevention and treatment programmes (Table 1) [13–15]. Spectrum, a modular computer programme designed to examine the impact of interventions on health outcomes, was developed by Futures Institute in collaboration with other organizations, including USAID, UNAIDS, WHO and UNICEF. Spectrum's AIDS Impact Module (AIM) can be used to assess the impact of HIV/AIDS at national and subnational level [15]. The Actuarial Society of South Africa's (ASSA) models have also been widely used to estimate AIDS deaths nationally and provincially [14]. A model developed by the Centre for Infectious Disease Epidemiology and Research at the University of Cape Town (UCT), based on ASSA demographic assumptions, simulates paediatric HIV transmission and survival [13]. The United Nations Interagency Group for Mortality Estimation (UN-IGME), comprised of representatives from UNICEF, WHO, the World Bank, and the United Nations Population Division, publishes annual estimates of national neonatal, infant and under-five mortality rates [1] which are adjusted for bias due to AIDS [16,17]. In addition, the Institute of Health Metrics and Evaluation (IHME) have modelled national-level trends in mortality rates with methods recently updated for the Global Burden of Disease Study 2010 [18,19].
Table 1.
Models estimating childhood deaths due to AIDS for South Africa.
| Model name | Version | Childhood mortality assumptions | Brief description | PMTCT and childhood HIV interventions modelled | |
| Non-AIDS mortality | AIDS mortality | ||||
| Spectrum UNAIDS model [15] | v. 4.50 beta 5, May 2012 | UN Population Division 2010 non-AIDS revision based on UN East Asia life table | Mortality is distributed evenly across 1–11 months with 1% allocated to 0–1 month | Spectrum is a modular computer programme designed to examine the impact of interventions on health outcomes. The core of Spectrum is a demographic projection model, called DemProj, which projects the population by age and sex | PMTCT including single dose nevirapine (sd NVP), dual prevention, maternal HAART), paediatric HAART, cotrimoxozole, breastfeeding |
| Neonatal mortality not linked to AIDS projections | Median survival time if infected perinatally: 1.1 years | The AIDS Impact Module (AIM) projects the consequences of the AIDS epidemic including: the number of people infected with HIV, AIDS deaths, the number of people needing treatment, and the number of orphans | |||
| Median survival time if infected postnatally: 9.4 years | The PMTCT module examines the impact of different programmes intended to reduce the transmission of HIV from mothers to their newborn children | ||||
| Mortality per year is 0.15 in the first year on ART, 0.07 in subsequent years | |||||
| University of Cape Town paediatric HIV model [13] | December 2010 with programme data updated to May 2013 | Based on ASSA2003 model | HIV mortality is distributed across different monthly intervals based on a convolution of 2 Makeham distributions (leading to peak in HIV deaths in the 3rd month of life) | Model simulates mother-to-child transmission of HIV, disease progression and death of HIV-infected children <15 years of age | sd NVP, ZDV, ZDV + sd NVP, maternal HAART, maternal HAART, exclusive breastfeeding, replacement feeding |
| Models neonatal mortality as a constant fraction of non-AIDS infant mortality | Median survival time if infected perinatally: 3.6 years | Fitted to South African data sources including age-specific paediatric HIV prevalence data from two national household surveys from 2005 and 2008, as well as PMTCT programme coverage data, pre-ART survival data, and ART programme statistics | |||
| Median survival time if infected postnatally: 14.6 years | |||||
| ART mortality per year varies in relation to age at ART initiation, time since ART initiation and disease stage at time of ART initiation | |||||
| ASSA2008 model [14] | March 2011 | Mortality rates trend downward from 1985 base rates [20] | Median survival time if infected perinatally: 2.3 years | Combined cohort component projection model and epidemiological model, which dynamically models heterosexual HIV transmission between adults and mother-to-child HIV transmission. Calibrated to be consistent with prevalence surveys and registered deaths (corrected for incomplete registration) | Paediatric HAART, PMTCT including sd NVP, ZDV+NVP, formula feeding |
| Neonatal mortality not considered | Median survival time if infected postnatally: 11.2 years | ||||
| ART mortality per year is 0.127 in first year of ART and 0.037 in subsequent years | |||||
NVP, nevirapine, PMTCT, prevention of mother-to-child transmission; UCT, University of Cape Town; ZDV, zidovudine. More details on the model inputs are included as Supplemental Digital Content 1.
In this analysis, we compare national estimates for all-cause neonatal, postneonatal, and under-five mortality as well as the proportion of under-five child deaths due to AIDS between 1990 and 2011 to assess South Africa's rate of progress towards MDG 4 for child survival to 2015 and beyond.
Methods
Comparison of models and estimated trends in under-five deaths due to AIDS
We compared the three models used to estimate child deaths due to AIDS in South Africa: ASSA2008, the UCT paediatric HIV model, and Spectrum. Comparisons were made across three dimensions: (1) demographic assumptions (base year; base population and age distribution; migration; non-AIDS mortality); (2) HIV epidemiological assumptions (HIV prevalence amongst pregnant and lactating women; time to death without ART, rates of mortality with ART; perinatal transmission rates; postnatal transmission rates; heterosexual transmission rates); and (3) prevention and treatment interventions [infant feeding; condom usage; effectiveness, type and coverage of prevention of mother-to-child transmission (PMTCT) of HIV regimens; cotrimoxazole, status of ART rollout]. Each model was run using the most recent version available at the time of analysis (Spectrum 4.50 beta 5, May 2012; ASSA 2008, March 2011; UCT model, May 2013) to generate the trend in U5MR and the number of deaths in children under-five due to AIDS from 1990 to 2011. All estimates were converted to reflect calendar years.
The model inputs and structure contain notable differences (Table 1, with more detail included in Supplemental Digital Content 1). HIV survival time was assumed to be significantly shorter in Spectrum than in the ASSA2008 and UCT models. Spectrum assumes higher mortality among those on ART, which includes the mortality of those lost to follow-up. Spectrum assumes a 33% reduction in mortality for those children receiving cotrimoxazole and ART while UCT and ASSA2008 models do not allow for the effect of cotrimoxazole. The assumed transmission rates according to PMTCT regimen were similar across the models but the coverage levels were different. Spectrum assumed close to 100% of HIV-positive women received some sort of prophylaxis while the ASSA2008 model and UCT model assumed 75 and 95% of HIV-positive women received prophylaxis, respectively. The number of children starting ART (Spectrum) or becoming eligible for ART (ASSA2008 and UCT model) differs across the three models, with the UCT model higher than both Spectrum and ASSA2008. Finally, coverage of breastfeeding also varied across models. Spectrum used data from the 2003 Demographic and Health Survey [12] to estimate breastfeeding patterns and applied those patterns to all HIV-positive women while the ASSA2008 and UCT models assumed that 50% of women who are HIV-diagnosed were formula feeding.
Assumptions around non-AIDS mortality differ across the models. Non-AIDS mortality is accounted for in the ASSA2008 and the UCT models by assuming that rates trend monotonically downward from base rates in 1985 set equal to those estimated by Dorrington et al.[20] in such a way that the all-cause rates from the ASSA2008 model was consistent with those estimated from national population-based surveys [14]. The Spectrum model uses South Africa-specific non-AIDS mortality from the 2010 World Population Prospects which assumes the mortality derives from a model life table, on the assumption that non-AIDS life expectancy increases at a steady rate over time [21].
The annual under-five mortality rate (U5MR) estimated by each of the AIDS models was compared with two national estimates of trends produced by global models developed by IHME [19] and UN-IGME [1]. The input data used for the UN-IGME trend includes national household surveys from 1990, 1998, and 2007 [1]. For settings with HIV prevalence in the general population greater than 5% at any point from 1980 onwards, UN-IGME adjusted estimates to account for selection bias resulting from AIDS deaths [16]. The estimates from IHME used the same input sources as UN-IGME and the 1996 Census, the 2003 Demographic and Health Survey, the 1993 World Bank Living Standards and Measurement Study, and vital registration from 1998 to 2009 [22].
Given the increasing importance of deaths in the first month of life to overall child survival [1], neonatal mortality was compared between the UCT model (the only AIDS model which also estimated NMR), IHME and UN-IGME.
Comparison of modelled estimates with empirical data
We compiled available data on national neonatal, postneonatal, and child mortality rates and created a database of all sources identified according to year. The mortality levels and proportion of estimated under-five deaths due to AIDS from the models were compared with all the identified data, including vital registration as well as estimates derived from the national Rapid Mortality Surveillance database maintained by the South African Medical Research Council which enables monthly monitoring of the number of deaths recorded on the National Population Register [23]. Child mortality data from household surveys, health and demographic surveillance sites (HDSS), the district health information system, and facility-based audit systems were also considered (Table 2). In particular, information on 55 402 newborn deaths between 2000 and 2011 captured in the Perinatal Problem Identification Programme (PPIP) [24] database and 28 837 deaths amongst children under 5 between 2005 and 2011 from the Child Healthcare Problem Identification Programme (Child PIP) [25] database were extracted.
Table 2.
Overview of South African child mortality data sources.
| Data source | Description | Population coverage | Limitations | Steps to improve |
| Vital registration | Continuous, permanent, compulsory, and universal recording of the occurrence and characteristics of live births and deaths | Over 90% coverage of adult deaths, improving quality especially for neonates | Mortality trend over time is not realistic due to rising completeness rates | Training on death certificates and coding |
| AIDS deaths captured but misclassified | Verbal autopsy for community deaths | |||
| At least a two-year lag before results released | Adjustment efforts | |||
| Household surveys – direct | Detailed birth or pregnancy histories collected from a sample of women aged 15–49 produce direct estimates of under-five mortality rates | Nationally representative surveys include: | Time and resource intensive | Full pregnancy history to capture stillbirths and early neonatal deaths |
| 1990 Human Sciences Research Council survey | Infrequent | Validation studies | ||
| 1998 Demographic and Health Survey | Mortality estimates from 2003 DHS were not plausible | Verbal autopsy | ||
| 2003 Demographic and Health Survey | Unknown adjustment required for maternal survivor bias | |||
| Household surveys – indirect | Summary birth histories, which provide information on the proportion of the total number of children ever born to women aged 15–49 who have survived produce indirect estimates of under-five mortality. | Nationally representative surveys include: | Summary birth history | Increase frequency |
| 1993 World Bank Living Standards Measurement Study | Infrequent | Validation studies | ||
| 2007 Community Survey | Adjustment required for maternal survivor bias | |||
| Census – indirect and direct | Summary birth histories collected for all women present at the time of the census plus deaths in households in past year | 1996, 2001 and 2011 censuses | Time and resource intensive | Validation studies |
| Infrequent | ||||
| Indirect as above, direct of unknown accuracy | ||||
| Facility-based mortality audit | The Perinatal Problem Identification Programme (PPIP) and the Child Healthcare Problem Identification Programme (Child PIP) record the number, cause and avoidable factors associated with perinatal and child deaths. PPIP captures information on mother's HIV status for babies who die in maternity and neonatal wards. Child PIP reviews in-hospital paediatric deaths and assigns a cause of death as well as records the HIV-lab status and clinical staging for each child who dies. | PPIP captures data from 275 sites which comprise over 70% of the country's births | Is not representative of the overall population as only facility deaths are captured and the proportion of sites participating by province varies | Increase coverage of participating facilities |
| Child PIP captures data from more than 100 sites with over 28 800 U5 deaths audited | Link to vital registration and capture of deaths that occur in the community to estimate the bias | |||
| Health and Demographic Surveillance Sites (HDSS) | HDSS sites use routine surveillance to collect vital events data for defined populations. Numbers and causes of death are captured through health facilities and verbal autopsies conducted by interviewing family members | Sites in rural Mpumalanga and KwaZulu-Natal provinces cover approximately 70 000 and 80 000 people respectively | HDSS populations is not representative of the national or even provincial population | Improve frequency of surveillance rounds to more effectively capture birth outcomes |
| Outcomes around the time of birth including neonatal deaths are often poorly captured | Further analysis into classification of AIDS deaths |
Results
Comparison of estimated trends in AIDS-related under-five deaths
Despite the different assumptions and input data in the three AIDS models, the trend since the start of the HIV epidemic followed a similar pattern. The estimated proportion of child deaths due to AIDS reached a peak of 37–39% around 2005–2006 with a sharp decline towards the end of the decade (Fig. 1). There is less consistency between models in recent years; the estimated proportion of deaths in children under-five due to AIDS in 2011 ranged from 11.2% (plausibility bounds 9.3–14.3%) in Spectrum and 19.8% in ASSA2008, to 24.3% (95% confidence interval 19.9–28.0%) in the UCT model. The Spectrum and ASSA2008 models predict a faster decline in child deaths due to AIDS than the UCT model.
Fig. 1.
Trend in percentage of under-five deaths in South Africa due to AIDS in South Africa.
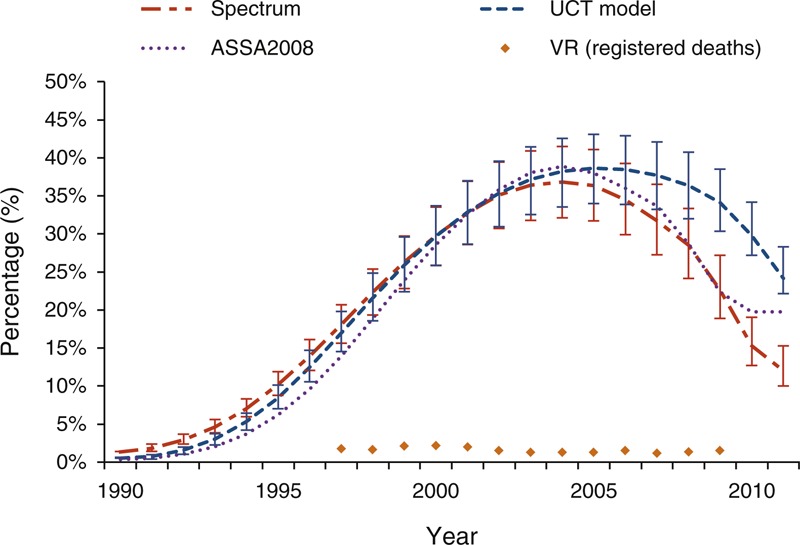
ASSA, Actuarial Society of South Africa; UCT, University of Cape Town; VR, vital registration.
Reporting of AIDS as a cause of death in vital registration is highlighted in Figure 1 and follows a very different trend than the modelled estimates. Amongst children less than 5 years of age, only 778 (1.5%) deaths in 2009 were attributed to AIDS, with no significant change since the start of the HIV epidemic. This proportion rises to 6.8% when common pseudonyms for AIDS are included.
The national audit programmes are not designed to provide population-representative mortality data but the large number of births and deaths provide important information on the causes of death over time. The Child PIP mortality audit data confirms the trend in childhood AIDS deaths seen in the modelled estimates. Although 26.2% of over 4300 deaths captured through Child PIP in 2011 had an unknown HIV lab status, this is a decline from 43.0% in 2005 and demonstrates increasing rates of HIV testing and reporting. The proportion of HIV-infected children who died (either with a positive lab status or a clinical staging of III or IV if lab diagnosis was not available) has decreased from 52.8% in 2005 to 25.2% in 2011. The trend followed a similar rate of decline as the modelled estimates but remains significantly higher, perhaps due to the concentration of health facilities participating in Child PIP in KwaZulu-Natal province (37.6% of all deaths audited) and Mpumalanga province (23.6% of all deaths audited) which have the highest rates of HIV prevalence in the country. The audit data did not show substantial changes in other causes of child death over this time period.
Verbal autopsy has been used to identify AIDS-related mortality using either physician coding or probabilistic modelling to derive cause of death [26]. At the Africa Centre for Health and Population Studies in KwaZulu-Natal, HIV-related deaths contributed 41% of all deaths amongst children under-five at first measurement in 2000, peaking in 2002 at 46%, and then declining to a low of 19% in 2010. Of 1035 under-five deaths captured between 2000 and 2010, 367 (35.5%) were attributed to HIV (M.-L. Newell and K. Herbst, personal communication). Similarly, childhood AIDS deaths at the Agincourt HDSS site in Mpumalanga province peaked at 38.7% of all child deaths in 2005 with a subsequent decline to 9.1% in 2010 (P. Byass and K. Kahn, personal communication).
Under-five mortality trends
The trends in under-five mortality rates are consistent across sources with the U5MR increasing through the 1990s, peaking between 2004 and 2005 across all estimates, and thereafter declining rapidly (Fig. 2). All estimates of U5MR are within the uncertainty range of the UN-IGME estimates. The average rate of reduction (ARR) of U5MR between 1990 and 2011 was slow across all estimates, ranging from a low of 0.8% per year according to Spectrum to 1.4% per year according to ASSA2008 and UN-IGME (Table 3). The ARR across the two decades masks the increasing mortality rate in the first part of the past decade and the rapid decline since 2006. Between 2000 and 2005, all estimates suggest an increase in mortality, but the ARR between 2006 and 2011 demonstrate an extremely rapid turnaround. Data from vital registration and the Rapid Mortality Surveillance system echo this recent decline with the U5MR falling from 68.9 in 2006 to 42.2 in 2011, resulting in an ARR of 10.3% per year [23].
Fig. 2.
Under-five mortality rate trends in South Africa, 1990–2011.
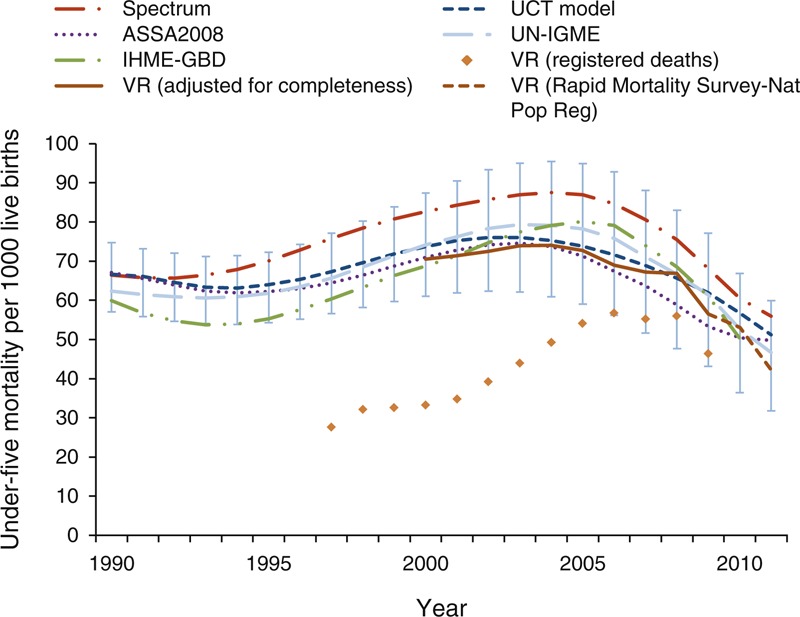
ASSA, Actuarial Society of South Africa; IHME, Institute of Health Metrics and Evaluation; Nat Pop Reg, National Population Register; UCT, University of Cape Town; UN-IGME, United Nations Interagency Group for Mortality Estimation; VR, vital registration.
Table 3.
Average rate of reduction per year for U5MR, NMR and children aged 1–59 months.
| Spectrum | UCT model | ASSA2008 | UN-IGME | IHME* | |
| Under-five mortality rate reduction | |||||
| 1990–2011 | 0.8% | 1.3% | 1.4% | 1.4% | 0.9% |
| 2006–2011 | 8.6% | 7.0% | 6.3% | 10.2% | 12.2% |
| 1–59 month mortality rate reduction | |||||
| 1990–2011 | – | 0.9% | – | 1.3% | 1.1% |
| 2006–2011 | – | 8.1% | – | 14.7% | 14.7% |
| Neonatal mortality rate reduction | |||||
| 1990–2011 | – | 2.3% | – | 1.5% | 0.5% |
| 2006–2011 | – | 3.4% | – | 2.0% | 7.2% |
IHME, Institute of Health Metrics and Evaluation; UCT, University of Cape Town; UN-IGME, UN Interagency Group for Mortality Estimation
*Column reflects average annual rate of reduction to 2010.
Neonatal mortality trends
Of the three AIDS models reviewed, only the UCT paediatric HIV model estimates NMR. This output was compared against UN-IGME and IHME estimates and vital registration data. The UN-IGME NMR trend remains higher than the trend from the UCT model but both show minimal decline over the past two decades (Fig. 3). The IHME NMR estimates follow the IHME U5MR trend with a peak in 2005. The rate of decline for neonatal mortality is significantly slower than under-five mortality after the neonatal period (Table 3). The ARR for NMR between 1990 and 2011 is 2.3% per year predicted by the UCT model, compared to 1.5% per year predicted by UN-IGME (Table 3). Data from vital registration combined with data from the District Health Information System confirms slow progress and suggests that the NMR has been virtually stagnant over the past decade [23]. Contrary to other estimates and empirical data, the neonatal ARR according to IHME between 1990 and 2010 is 7.2% per year.
Fig. 3.
Neonatal mortality rate trends in South Africa, 1990–2011.
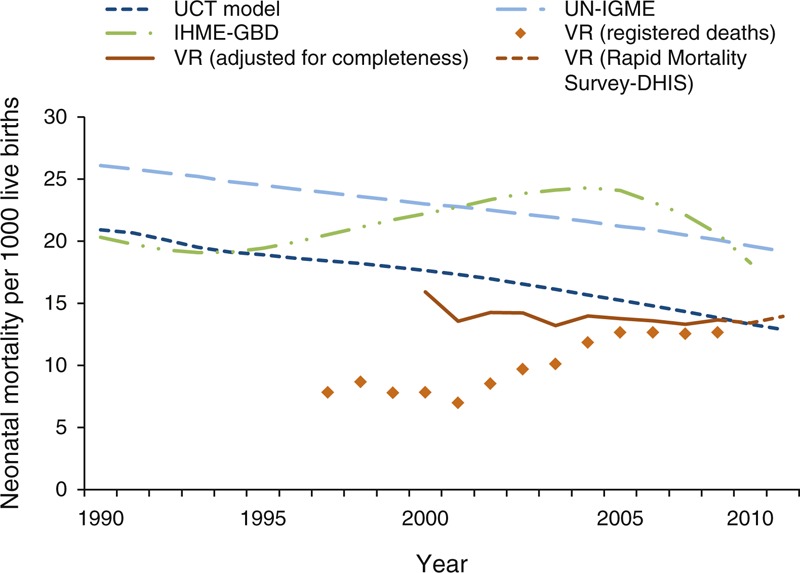
DHIS, District Health Information System; IHME, Institute of Health Metrics and Evaluation; UCT, University of Cape Town; UN-IGME, United Nations Interagency Group for Mortality Estimation; VR, vital registration.
Discussion
To our knowledge this is the first analytical comparison of AIDS models estimates and national and global data for the under-five mortality trends and child deaths due to AIDS in South Africa over this critical time period. In 2005, South Africa was one of only four countries globally with an under-five mortality rate higher than the 1990 baseline for the Millennium Development Goals. Over the past 5 years, all models and data sources agree that the nation has achieved one of the fastest rates of child mortality reduction in the world. This rapid decline is likely due to reduction in AIDS deaths through the scale up of PMTCT and expanded roll-out of ART services.
Given the different assumptions across the three AIDS models we expected wider variation in the mortality output estimates. Yet in terms of the overall trajectory since the start of the HIV epidemic there is consistency across the three AIDS models (Figs. 1 and 2). The rate at which AIDS deaths declined as a proportion of all child deaths was fastest in Spectrum. The UCT model predicted the highest proportion of child deaths due to AIDS in the most recent years. This could be due to the fact that the UCT model assumes a greater proportion of deaths in children infected vertically occur after the first year of life, with the result that AIDS deaths take longer to respond to changes in perinatal transmission rates compared with the other models. Additionally, the younger age distribution of paediatric ART initiation in the Spectrum and ASSA2008 models would lead to a faster decline in deaths in children under 5 years of age compared with the UCT model. In light of new programme data since the ASSA2008 release [27], ASSA has cautioned users to be aware that the model is likely to overstate the extent of recent AIDS mortality. AIDS deaths in ASSA2008 begin to level off after 2010 reflecting the absence of any allowance for new strategies in ASSA2008 (e.g. triple-drug prophylaxis in pregnant women, nevirapine prophylaxis in breastfed children and early ART initiation in infants). Furthermore, the ASSA2008 model assumes a lower percentage of women received HIV testing than recent data suggest, and neither ASSA2008 nor the UCT model allows for low rates of transmission amongst mothers who were on ART prior to conception.
The UN-IGME and IHME Global Burden of Disease Study 2010 estimates follow the same U5MR trend as the AIDS models, with levels peaking mid-decade followed by a rapid decline. The Global Burden of Disease Study 2010 estimates for South Africa address the increase in completeness in registration over the past decade, a problem that plagued previous IHME estimates [28]. This concurrence across sources is new and may serve to minimize confusion among health planners and programmers. An ongoing collaborative and country-driven process defined by these criteria will further improve existing models as well as the quality of empirical data.
Given the accelerated pace of programmatic change, there is an increased urgency for frequent, reliable empirical data at national, provincial, and ideally, district level for rational health planning. Misclassification of AIDS deaths is still a major cause for concern in the vital registration data. Improvements in South Africa's death registration data systems include strengthening of the current vital registration system as well as regular household surveys with full pregnancy histories and sibling survival histories. In order to improve the quality of vital registration data, training in accurate completion of death certificates is critical, particularly the identification of AIDS as the underlying cause of death when appropriate. There is also scope to consider a verbal autopsy system for child deaths, which are reported outside health facilities and certified by someone other than a medical practitioner [2].
Officially, South Africa remains one of the countries making ‘insufficient progress’ to achieve the Millennium Development Goal 4 U5MR target of 21 by 2015 [1]. Between 1990 and 2005 South Africa's rate of progress was worse than conflict-ridden countries of Iraq, Somalia and the Democratic Republic of the Congo. However, mortality has declined significantly since the middle of the last decade and South Africa's average annual rate of decline between 2006 and 2011 (10.3% according to UN-IGME) is the fourth fastest globally, with Rwanda being the only country in the region to achieve faster progress [1]. The recent rate of decline is similar to improvement in other middle-income countries lauded for progress in reducing child mortality such as Brazil (ARR of 8.1%) and China (ARR of 8.5%).
Although interventions to address HIV/AIDS have been undertaken in the broader context of the district health system, mortality audit data and sample sites across the country also indicate that these interventions have reduced AIDS deaths without a significant knock-on effect for other causes of child death. The trajectory for child survival has shifted as PMTCT services and ART have become more widely available (Fig. 4) [13]. Access to treatment and improved survival rates have meant that the overall HIV prevalence amongst women attending antenatal care has not changed significantly nationally since 2005 [29]. Uptake of PMTCT services is high, with more than 98% of women getting tested for HIV during pregnancy and 92% of HIV-positive mothers receiving peripartum ART or prophylaxis in 2010 [27]. The decline in the rate of vertical transmission before 6 weeks has exceeded expectations and has led to calls for the elimination of perinatal HIV transmission, but there is more work to be done. Significant variability remains in PMTCT service coverage and quality across the country and the scale-up of child ART has been slower than PMTCT services [13]. In addition, the potential of postnatal transmission through breastfeeding must continue to be addressed in light of the welcome policy shift towards exclusive breastfeeding since 2010.
Fig. 4.
Antenatal HIV prevalence and prevention of mother-to-child transmission (PMTCT) scale up in South Africa, 1990–2010.
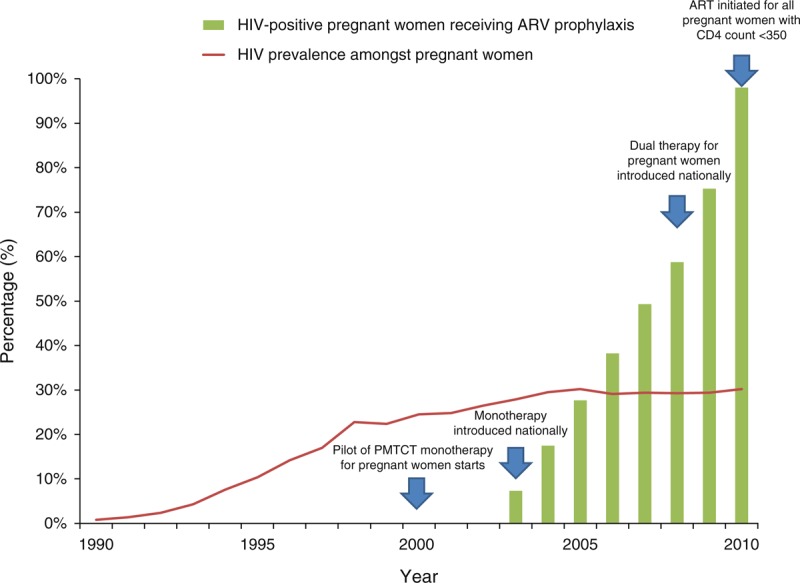
Data sources: HIV prevalence amongst pregnant women [29]; HIV-positive pregnant women receiving ART estimates from Spectrum. ARV, antiretroviral; PMTCT, prevention of mother-to-child transmission.
As non-AIDS deaths contribute an increasing proportion of under-five deaths, addressing these with a similar fervour to that shown to HIV/AIDS is a vital next step for the national child survival agenda. Over the past decade, the evidence does not point to large changes in other leading causes of death such as diarrhoea or pneumonia, or neonatal deaths [30]. The 2009 introduction of the rotavirus and pneumococcal conjugate vaccines have likely contributed to subsequent mortality decline but the full impact likely would not be seen during the period under analysis due to a slow start to rollout and low coverage. South Africa's rates of immediate (within the first hour after birth) and exclusive breastfeeding are amongst the lowest in the world [10] and suggest a need for increased attention to this important intervention. The confusion around appropriate breastfeeding messages at the height of the HIV/AIDS epidemic may have led to poorer outcomes for HIV-negative children. An intersectoral approach to address water and sanitation, food security and improved access to social grants though a continuum of care that links care during pregnancy, childbirth, the postnatal period and childhood is required to target the country's remaining preventable deaths.
Both the data and programmatic action remains a challenge for neonatal deaths in particular (Panel 1). Although the UCT model and national data show NMR levels low and stagnant, UN-IGME suggests a higher level of NMR with slow progress. IHME estimates suggest rapid recent change in line with the U5MR trend but this is not based on the non-AIDS U5MR [28,31–35]. Across all available data the ARR for NMR over the second half of the last decade is slower than the reduction in deaths amongst children aged 1–59 months. The proportion of under-five deaths that occur in the neonatal period is increasing, making causes of death in the first month of life even more important to consider.
After years of rising mortality rates, the mortality picture for South Africa's children has shifted drastically. Opaque and conflicting messages have been replaced by data that can be used for action and accountability. It is unlikely that South Africa will achieve the MDG 4 target by the 2015 deadline but at the current pace, the target would be met before the end of the decade. Continued efforts to eliminate paediatric HIV transmission are essential, but failure to address other aspects of care including integrated high quality maternal and neonatal care means that child survival progress could stall even before 2015.
Fig. 1.
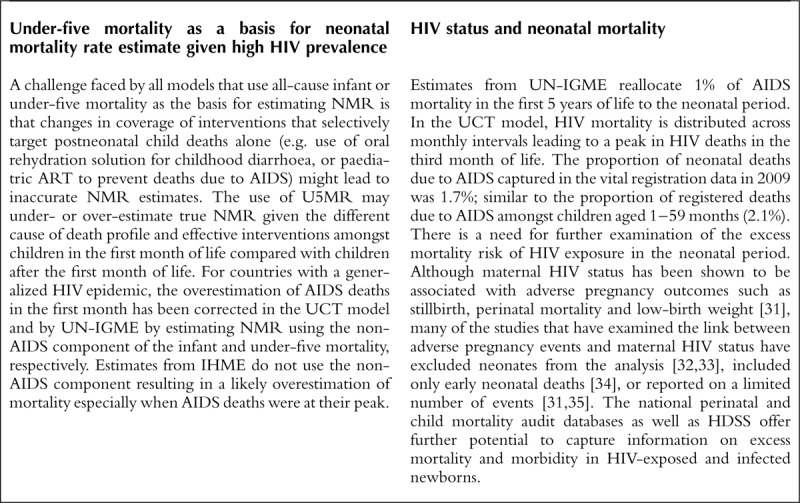
Panel 1: Challenges in assessing neonatal mortality in settings with high HIV-prevalence
Acknowledgements
The authors acknowledge the helpful inputs from the South African Neonatal and Child Epidemiology Reference Group (SANCHERG) including Debbie Bradshaw, Tanya Doherty, Pam Groenwald, Debra Jackson, Leigh Johnson, Kate Kerber, Lori Lake, Ria Laubscher, Joy Lawn, Wondwassen Lerebo, Neil McKerrow, William Msemburi, Mphele Mulaudzi, Nadine Nannan, Edward Nicol, Mark Patrick, Bob Pattinson, Heston Phillips, Victoria Pillay-van Wyk, Roz Prinsloo, David Sanders, Cindy Stephen, Maletela Tuoane-Nkhasi, Sithembiso Velaphi. We thank Dr Kobus Herbst and Prof Marie-Louise Newell of the Africa Centre for Health and Population Studies surveillance funded by the Wellcome Trust and Africa Centre as well as Kathleen Kahn, Sam Clark, and Benn Sartorius of the Agincourt Health and Demographic Surveillance Site for providing data and comments.
K.J.K and J.E.L. conceived the analysis. K.J.K. wrote the first draft of the article. D.S. and D.J. were involved in the inception, design and supervised the project. R.E.D., L.J., M.M., H.P., W.M., N.P.W., M.O., N.N. and D.B. contributed the latest data from the models and empirical sources and compared outputs. All authors contributed to revisions of the article, approved the final article and take responsibility for the content.
Funding received: We acknowledge funding from the Bill & Melinda Gates Foundation through Saving Newborn Lives—a programme of Save the Children (K.J.K., J.E.L.), the Child Health Epidemiology Reference Group (K.J.K., J.E.L., D.J.), the South African National Research Foundation (D.J.).
Conflicts of interest
There are no conflicts of interest.
Supplementary Material
Footnotes
Correspondence to Kate Kerber, 2A King Street, Woodstock 7925, South Africa. E-mail: kjkerber@gmail.com
References
- 1.UNICEF Levels and trends in child mortality report 2012: estimates developed by the UN Inter-agency group for child mortality estimation. 2012; New York:UNICEF, the World Health Organization, the World Bank, and the United Nations Population Division, http://www.childinfo.org/files/Child_Mortality_Report_2012.pdf (Accessed 6 June 2013) [Google Scholar]
- 2.Bradshaw D, Pillay-Van Wyk V, Laubscher R, Nojilana B, Groenwald P, Nannan N, et al. Cause of death statistics for South Africa: challenges and possibilities for improvement. 2010; Cape Town:Medical Research Council, www.mrc.ac.za/bod/cause_death_statsSA.pdf (Accessed 22 May 2013) [Google Scholar]
- 3.Nannan N, Dorrington R, Laubscher R, Zinyakatira N, Prinsloo M, Darikwa TB, et al. Under-5 mortality statistics in South Africa: shedding some light on the trends and causes 1997–2007. 2012; Cape Town:South African Medical Research Council, http://www.mrc.ac.za/bod/MortalityStatisticsSA.pdf (Accessed 22 May 2013) [Google Scholar]
- 4.Birnbaum JK, Murray CJ, Lozano R. Exposing misclassified HIV/AIDS deaths in South Africa. Bull World Health Organ 2011; 89:278–285 [DOI] [PMC free article] [PubMed] [Google Scholar]
- 5.Mayosi BM, Lawn JE, van Niekerk A, Bradshaw D, Abdool Karim SS, Coovadia HM, et al. Health in South Africa: changes and challenges since 2009. Lancet 2012; 380:2029–2043 [DOI] [PubMed] [Google Scholar]
- 6.Chopra M, Daviaud E, Pattinson R, Fonn S, Lawn JE. Saving the lives of South Africa's mothers, babies, and children: can the health system deliver?. Lancet 2009; 374:835–846 [DOI] [PubMed] [Google Scholar]
- 7.Kahn T. South Africa: Experts Defy Minister Over Death Figures. Business Day. Cape Town: AllAfrica Global Media; 2008. http://allafrica.com/stories/200803120453.html (Accessed 6 June 2013) [Google Scholar]
- 8.Schneider H, Fassin D. Denial and defiance: a socio-political analysis of AIDS in South Africa. AIDS 2002; 15:S45–S51 [DOI] [PubMed] [Google Scholar]
- 9.Department of Health South Africa: Millennium Development Goals 2005 Country Report. Pretoria: Government of South Africa; 2005. http://www.parliament.gov.za/content/millennium%20development%20goals%20country%20report%202005.pdf (Accessed 22 May 2013) [Google Scholar]
- 10.Bryce J, Daelmans B, Dwivedi A, Fauveau V, Lawn JE, Mason E, et al. Countdown to 2015 for maternal, newborn, and child survival: the 2008 report on tracking coverage of interventions. Lancet 2008; 371:1247–1258 [DOI] [PubMed] [Google Scholar]
- 11.Mathers CD, Fat DM, Inoue M, Rao C, Lopez AD. Counting the dead and what they died from: an assessment of the global status of cause of death data. Bull World Health Organ 2005; 83:171–177 [PMC free article] [PubMed] [Google Scholar]
- 12.Department of Health, Inc. MI South Africa Demographic and Health Survey 2003. Calverton, MD:Macro International Inc; 2008 [Google Scholar]
- 13.Johnson LF, Davies MA, Moultrie H, Sherman GG, Bland RM, Rehle TM, et al. The effect of early initiation of antiretroviral treatment in infants on pediatric AIDS mortality in South Africa: a model-based analysis. Pediatr Infect Dis J 2012; 31:474–480 [DOI] [PubMed] [Google Scholar]
- 14.ASSA AIDS committee ASSA2008. Cape Town:Actuarial Society of South Africa; 2011 [Google Scholar]
- 15.Stover J, Johnson P, Hallett T, Marston M, Becquet R, Timaeus IM. The Spectrum projection package: improvements in estimating incidence by age and sex, mother-to-child transmission, HIV progression in children and double orphans. Sex Transm Infect 2010; 86 Suppl 2:ii16–ii21 [DOI] [PMC free article] [PubMed] [Google Scholar]
- 16.Walker N, Hill K, Zhao F. Child mortality estimation: methods used to adjust for bias due to aids in estimating trends in under-five mortality. PLoS Med 2012; 9:e1001298. [DOI] [PMC free article] [PubMed] [Google Scholar]
- 17.Stover J, Johnson P, Zaba B, Zwahlen M, Dabis F, Ekpini RE. The Spectrum projection package: improvements in estimating mortality, ART needs, PMTCT impact and uncertainty bounds. Sex Transm Infect 2008; 84 Suppl 1:i24–i30 [DOI] [PMC free article] [PubMed] [Google Scholar]
- 18.Lozano R, Wang H, Foreman KJ, Rajaratnam JK, Naghavi M, Marcus JR, et al. Progress towards Millennium Development Goals 4 and 5 on maternal and child mortality: an updated systematic analysis. Lancet 2011; 378:1139–1165 [DOI] [PubMed] [Google Scholar]
- 19.Wang H, Dwyer-Lindgren L, Lofgren KT, Rajaratnam JK, Marcus JR, Levin-Rector A, et al. Age-specific and sex-specific mortality in 187 countries, 1970–2010: a systematic analysis for the Global Burden of Disease Study 2010. Lancet 2012; 380:2071–2094 [DOI] [PubMed] [Google Scholar]
- 20.Dorrington RE, Bradshaw D, Wegner T. Estimates of the level and shape of mortality rates in South Africa around 1985 and 1990 derived by applying indirect demographic techniques to reported data. Cape Town:South African Medical Research Council; 1999 [Google Scholar]
- 21.UN Population Division World Population Prospects, the 2010 Revision. New York:United Nations Department of Economic and Social Affairs Population Division; 2011 [Google Scholar]
- 22.Lozano R, Wang H, Dwyer-Lindgren L. Progress towards Millennium Development Goal 4: authors’ reply. Lancet 2012; 379:1194–1195 [DOI] [PubMed] [Google Scholar]
- 23.Bradshaw D, Dorrington R, Laubscher R. Rapid Mortality Surveillance Report 2011. 2012; Cape Town:South African Medical Research Council, http://www.mrc.ac.za/bod/RapidMortality2011.pdf (Accessed 22 May 2013) [Google Scholar]
- 24.Pattinson R. Saving Babies: 2008–2009 report. 2010; Pretoria:MRC Research Unit for Maternal and Infant Healthcare Strategies, PPIP Users and the Saving Babies Technical Task Team, www.ppip.co.za/downloads/Saving%20Babies%202008-9.pdf (Accessed 30 May 2013) [Google Scholar]
- 25.Stephen C, Bamford L, Patrick M, Wittenberg DF. Saving Children 2009: Five years of data. A sixth survey of child healthcare in South Africa. 2011; Pretoria:MRC Unit for Maternal and Infant Healthcare Strategies, CDC, www.childpip.org.za/documents/saving_children_2009.pdf (Accessed 30 May 2013) [Google Scholar]
- 26.Byass P, Kahn K, Fottrell E, Mee P, Collinson MA, Tollman SM. Using verbal autopsy to track epidemic dynamics: the case of HIV-related mortality in South Africa. Population Health Metrics 2011; 9:46. [DOI] [PMC free article] [PubMed] [Google Scholar]
- 27.Goga AE, Dinh TH, Jackson DJ. for the SAPMTCTE study group Evaluation of the Effectiveness of the National Prevention of Mother-to-Child Transmission (PMTCT) Programme measured at six weeks postpartum in South Africa, 2010. 2012; Cape Town:South African Medical Research Council, National Department of Health of South Africa, and PEPFAR/US Centers for Disease Control and Prevention, http://www.doh.gov.za/docs/reports/2012/pmtcteffectiveness.pdf (Accessed 6 June 2013) [Google Scholar]
- 28.Kerber K, Tuoane-Nkhasi M, Dorrington R, Nannan N, Bradshaw D, Jackson D, et al. Progress towards Millennium Development Goal 4. Lancet 2012; 379:1193. [DOI] [PubMed] [Google Scholar]
- 29.National Department of Health The National Antenatal Sentinel HIV and Syphilis Prevalence Survey, South Africa. Pretoria:National Department of Health; 2011 [Google Scholar]
- 30.Liu L, Johnson HL, Cousens S, Perin J, Scott S, Lawn JE, et al. Global, regional, and national causes of child mortality: an updated systematic analysis for 2010 with time trends since 2000. Lancet 2012; 379:2151–2161 [DOI] [PubMed] [Google Scholar]
- 31.Brocklehurst P, French R. The association between maternal HIV infection and perinatal outcome: a systematic review of the literature and meta-analysis. Br J Obstet Gynaecol 1998; 105:836–848 [DOI] [PubMed] [Google Scholar]
- 32.Bourne DE, Thompson M, Brody LL, Cotton M, Draper B, Laubscher R, et al. Emergence of a peak in early infant mortality due to HIV/AIDS in South Africa. AIDS 2009; 23:101–106 [DOI] [PubMed] [Google Scholar]
- 33.Lallemant C, Halembokaka G, Baty G, Ngo-Giang-Huong N, Barin F, Le Coeur S. Impact of HIV/Aids on child mortality before the highly active antiretroviral therapy era: a study in Pointe-Noire, Republic of Congo. J Trop Med 2010; Epub 2010 Aug 17 [DOI] [PMC free article] [PubMed] [Google Scholar]
- 34.Kennedy D, Fawcus S, Kroon M. The effect of maternal HIV status on perinatal outcome at Mowbray Maternity Hospital and referring midwife obstetric units, Cape Town. SAJOG 2012; 18:6–10 [Google Scholar]
- 35.Rollins NC, Coovadia HM, Bland RM, Coutsoudis A, Bennish ML, Patel D, et al. Pregnancy outcomes in HIV-infected and uninfected women in rural and urban South Africa. J Acquir Immune Defic Syndrom 2007; 44:321–328 [DOI] [PubMed] [Google Scholar]
Associated Data
This section collects any data citations, data availability statements, or supplementary materials included in this article.