

Summary
Sixteen butyrate‐producing bacteria were isolated from the caecal content of chickens and analysed phylogenetically. They did not represent a coherent phylogenetic group, but were allied to four different lineages in the Firmicutes phylum. Fourteen strains appeared to represent novel species, based on a level of ≤ 98.5% 16S rRNA gene sequence similarity towards their nearest validly named neighbours. The highest butyrate concentrations were produced by the strains belonging to clostridial clusters IV and XIVa, clusters which are predominant in the chicken caecal microbiota. In only one of the 16 strains tested, the butyrate kinase operon could be amplified, while the butyryl‐CoA : acetate CoA‐transferase gene was detected in eight strains belonging to clostridial clusters IV, XIVa and XIVb. None of the clostridial cluster XVI isolates carried this gene based on degenerate PCR analyses. However, another CoA‐transferase gene more similar to propionate CoA‐transferase was detected in the majority of the clostridial cluster XVI isolates. Since this gene is located directly downstream of the remaining butyrate pathway genes in several human cluster XVI bacteria, it may be involved in butyrate formation in these bacteria. The present study indicates that butyrate producers related to cluster XVI may play a more important role in the chicken gut than in the human gut.
Introduction
In the chicken gastrointestinal tract, the main sites of bacterial activity are the crop and the caeca and, to a lesser extent, the small intestine. Lactobacillus spp. dominate the crop (Barnes et al., 1972; Watkins and Kratzer, 1983) and small intestinal tract (Lu et al., 2003), while the caecal microbiota are dominated by species of the Clostridiales order, followed by Lactobacillales and Bacteroidales (Dumonceaux et al., 2006). A molecular, culture‐independent study from Zhu and colleagues (2002) on the caecal microbiota of chickens identified 243 different sequences, representing 50 phylogenetic groups or subgroups of bacteria, with the majority of the caecal sequences being near or above 95% identical to their closest relatives in the database. Only about 10% of these sequences corresponded with validly named species, indicating that the knowledge of the intestinal microbiota of poultry is incomplete (Apajalahti et al., 2004; Bjerrum et al., 2006).
The activity and composition of the caecal microbiota is largely influenced by diet‐derived substrates that resist small intestinal digestion. Fermentation of these substrates leads to formation of metabolites such as short‐chain fatty acids (SCFAs) of which the concentration and relative proportion is affected by the type and quantity of the available substrates (Wolin et al., 1999). The quantitatively most important SCFAs are acetic, propionic and butyric acid. Butyrate in particular is known to serve as the direct energy source for the colonic epithelium (Roediger, 1980) and possesses anti‐inflammatory properties resulting from inhibition of the transcription factor NFκB activity (Place et al., 2005). In addition, butyric acid is capable to reinforce the colonic defence barrier by increasing the production of mucins and host antimicrobial peptides (Barcelo et al., 2000; Schauber et al., 2003). Butyric acid also promotes the body weight of broilers and has an inhibitory activity against Salmonella and Clostridium perfringens (Leeson et al., 2005; Van Immerseel et al., 2005; Hu and Guo, 2007; Timbermont et al., 2010). Little is known about the endogenous butyrate‐producing capacity in the lower intestinal tract of chickens, most likely because only limited information is available on the identity and diversity of butyrate‐producing bacteria in the chicken gut microbiota. Therefore the objective of the present study was to isolate butyrate‐producing bacteria colonizing the caecum of chickens and to determine their pathway for butyrate production.
Results
Isolation of butyrate‐producing bacteria
Dilutions of the caecal content were plated on M2GSC agar, since this medium was shown successful for the isolation of different types of butyrate producers from the human gut (Barcenilla et al., 2000). Sixty‐five, 58, 38, 37 and 62 colonies from a 14‐ and a 4‐week‐old layer pullet and from three 4‐week old broilers, respectively, were randomly picked, grown overnight in M2GSC broth and screened for fatty acid production. In accordance with the study of Barcenilla and colleagues (2000), the cut‐off value was set at 2 mM butyrate for consideration as a butyrate producer. Twenty‐six per cent of all tested isolates produced more than 2 mM butyrate, with the proportion of butyrate‐producing isolates varying between 14% and 43% for the five sampled chickens. The highest number of high‐concentration butyrate producers (> 15 mM) was isolated from the chickens, in which the total number of butyrate producers was the lowest (b and e) (Table 1). At least 2 mM of the acetate present in the M2GSC medium was consumed by 41% of all butyrate producers. All isolates from the 14‐week‐old layer and the three 4‐week‐old broiler chickens that consumed acetate proved to be butyrate producers, in contrast with the isolates from the 4‐week‐old layer where only 44% of the acetate consumers were butyrate producers (Table 1).
Table 1.
Number of isolates within a butyrate‐production range per sampled chicken and number of isolates consuming at least 2 mM acetate.
| Butyrate production (mM) | Acetate consumption (≥ 2 mM) among all isolates | ||||||
|---|---|---|---|---|---|---|---|
| Chicken (suffix) | 0–2.0 | 2.1–5.0 | 5.1–10 | 10.1–15 | > 15 | Butyrate producers | Non‐butyrate producers |
| 14‐week‐old layer (a) | 37 | 16 | 8 | 4 | 0 | 12/28 | 0/37 |
| 4‐week‐old layer (b) | 50 | 2 | 0 | 1 | 5 | 7/8 | 9/50 |
| 4‐week‐old broiler (c) | 28 | 3 | 4 | 3 | 0 | 1/10 | 0/28 |
| 4‐week‐old broiler (d) | 23 | 5 | 5 | 3 | 1 | 4/14 | 0/23 |
| 4‐week‐old broiler (e) | 53 | 2 | 2 | 1 | 4 | 4/9 | 0/53 |
Identification of the butyrate producers
Randomly amplified polymorphic DNA (RAPD) and repetitive‐extragenic‐palindromic (REP) PCR fingerprints were determined for the 45 out of the 68 butyrate‐producing isolates that could be recultured. Numerical analysis of both types of fingerprints yielded comparable results (data not shown) and 16 isolates with very distinct RAPD and REP‐PCR fingerprints were selected for further identification through 16S rRNA gene sequence analysis. Approximately 1300 bp of the 16S rRNA genes were determined, compared with all sequence data in public databases using the blast algorithm (Altschul et al., 1990) and used for the construction of a phylogenetic tree (Fig. 1). The 16 isolates were distributed among four clostridial clusters, cluster IV, XIVa, XIVb and XVI (Collins et al., 1994), within the Firmicutes phylum. When considering only validly named bacteria, three cluster IV isolates (53‐4c, 24‐4c and 30‐4c) were most closely related to Flavonifractor plautii (formerly Clostridium orbiscindens) (Carlier et al., 2010) (97.7% and 95.7% 16S rRNA sequence similarity) and Pseudoflavonifractor capillosus (formerly Bacteroides capillosus) (Carlier et al., 2010) (97.5% 16S rRNA sequence similarity) respectively; one cluster IV isolate (40‐4c) was most closely related (97.8% 16S rRNA sequence similarity) to the butyrate‐producing organism Subdoligranulum variabile; and two isolates (7‐4c and 25‐3b) were most closely related (91.5% and 92.7% 16S rRNA sequence similarity) to Eubacterium desmolans. From this cluster, isolate 25‐3b was recently classified into a novel species within a novel genus, Butyricicoccus pullicaecorum (Eeckhaut et al., 2008). Three isolates (35‐7e, 33‐7e and 77‐5d) were most closely related to members of the clostridial cluster XIVa, i.e. Anaerostipes caccae (94.5% 16S rRNA similarity), Eubacterium hallii (95.2% 16S rRNA similarity) and Clostridium populeti (92.5% 16S rRNA similarity) respectively. In this cluster, the highest butyrate concentration was produced by isolate 35‐7e which was recently further characterized and classified into the novel species Anaerostipes butyraticus (Eeckhaut et al., 2010). Isolate 21‐4c was most closely related (99.1% 16S rRNA sequence identity) to Clostridium lactatifermentans, a lactate‐fermenting bacterium of the clostridial cluster XIVb (van der Wielen et al., 2002). All isolates within cluster XIVa and XIVb showed the ability to utilize the lactic acid present in the medium (Table 2). Three of the cluster XVI isolates (20‐2a, 41‐2a and 37‐2a) were most closely related (98.5%, 95.5% and 95.2% 16S rRNA sequence similarity) to the generically misnamed (Täpp et al., 2003) Streptococcus pleomorphus; one cluster XVI isolate (65‐2a) was most closely related to Eubacterium cylindroides (96.5% 16S rRNA sequence identity), and two further isolates (60‐7e and 10‐3b) were remotely (90.4% and 90.6% 16S rRNA sequence identity) related to Eubacterium tortuosum (Fig. 1, Table 2). Given their distinct RAPD and REP‐PCR fingerprints (data not shown) and phylogenetic positions (Fig. 1), these 16 isolates are considered to represent 16 distinct strains in the remainder of the text.
Figure 1.
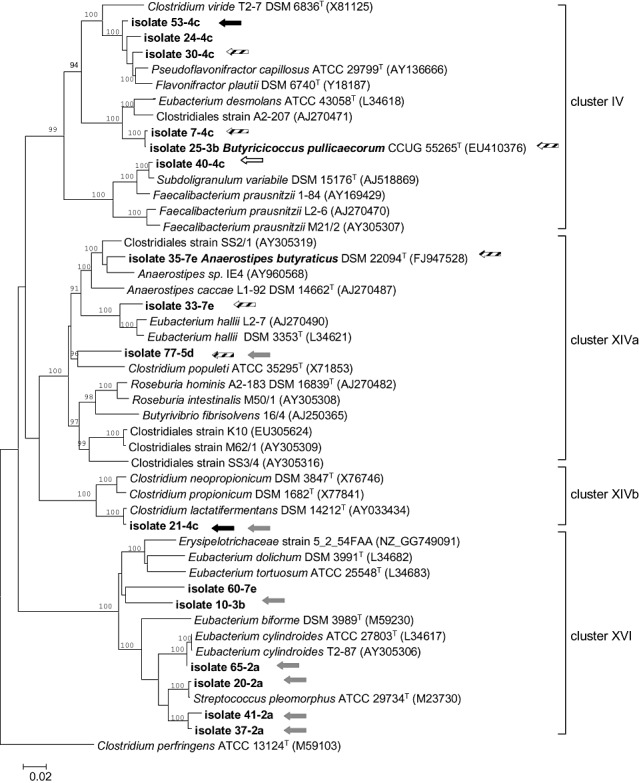
Phylogenetic tree showing the relationship between the different butyrate‐producing chicken isolates based on 16S rRNA gene sequences. The tree was constructed by use of the neighbour‐joining method. The 16S rRNA gene sequence of Clostridium perfringens (ATCC 13124) was used as an outgroup to root the tree. Accession numbers are given in brackets. The numbers shown at the nodes of the tree indicate bootstrap values out of 100 bootstraps resamplings (values under 90% are not shown). The strains isolated in this study are shown in boldface and are labelled with an arrow when possessing a sequence related to the butyryl‐CoA:acetate CoA transferase gene (black arrow: CoATDF1, CoATDR2 primers; striped arrow: CoATDF1, CoATDR2 and BCoATscrF, BCoATscrR primers), the propionate CoA‐transferase gene (grey arrow) or the butyrate kinase gene (white arrow). Scale bar: 0.02 substitutions per nucleotide position.
Table 2.
Acidic fermentation products and relationships of the butyrate‐producing strains.
| Strain | Cluster | Fermentation acids (mM)a,b | Highest 16S rRNA gene sequence similarity | |||||
|---|---|---|---|---|---|---|---|---|
| Butyric acid | Acetic acid | Propionic acid | Lactic acid | Formic acid | Type strain of validly named species (% 16S rRNA sequence similarity) | Accession number | ||
| 53–4c | IV | 10.8 ± 1.4 | −4.6 ± 0.7 | −0.3 ± 0.6 | 5.9 ± 0.8 | 0.1 ± 0.1 | Pseudoflavonifractor capillosus (97.7) | AY136666 |
| 24–4c | IV | 6.7 ± 1.2 | 2.9 ± 0.1 | −0.8 ± 1.8 | 3.7 ± 0.01 | 1.3 ± 0.02 | Pseudoflavonifractor capillosus (95.7) | AY136666 |
| 30–4c | IV | 11.8 ± 0.7 | 0.9 ± 0.3 | 0.6 ± 0.1 | 3.6 ± 0.1 | 0.1 ± 0.1 | Flavonifractor plautii (97.5) | Y18187 |
| 7–4c | IV | 11.6 ± 0.9 | −0.7 ± 0.2 | −0.6 ± 1.1 | −0.4 ± 0.3 | 0.5 ± 0.2 | Butyricicoccus pullicaecorum (97.9) | EU410376 |
| 25–3b | IV | 15.3 ± 0.2 | −4.9 ± 0.5 | −0.6 ± 1.5 | −0.6 ± 0.3 | 1.7 ± 0.3 | Butyricicoccus pullicaecorum (100) | EU410376 |
| 40–4c | IV | 6.8 ± 0.7 | 2.7 ± 0.3 | 0.4 ± 0.2 | 1.8 ± 0.02 | 16 ± 0.2 | Subdoligranulum variabile (98.2) | AJ518869 |
| 35–7e | XIVa | 21.7 ± 0.6 | −5.2 ± 0.2 | −0.4 ± 0.3 | −4.3 ± 0.6 | 1.7 ± 0.2 | Anaerostipes butyraticus (100) | FJ947528 |
| 33–7e | XIVa | 15.1 ± 0.7 | −1.3 ± 0.2 | −4.1 ± 0.4 | −8.1 ± 0.1 | 0 | Eubacterium hallii (95.2) | L34621 |
| 77–5d | XIVa | 9.5 ± 0.8 | 4.8 ± 1.2 | −1.9 ± 1.6 | −2.1 ± 0.9 | 0.3 ± 0.2 | Clostridium populeti (92.5) | X71853 |
| 21–4c | XIVb | 5.7 ± 0.8 | 8.1 ± 1.3 | 10.5 ± 2.1 | −3.3 ± 0.8 | 0.2 ± 0.1 | Clostridium lactatifermentans (99.1) | AY033434 |
| 60–7e | XVI | 3.1 ± 0.8 | 0.2 ± 0.01 | −1.4 ± 0.04 | 6.7 ± 0.5 | 4.7 ± 0.4 | Eubacterium tortuosum (90.4) | L34683 |
| 10–3b | XVI | 2.5 ± 0.9 | 0 | −1.1 ± 0.3 | 4.9 ± 0.01 | 5.6 ± 0.2 | Eubacterium tortuosum (90.6) | L34683 |
| 65–2a | XVI | 3.6 ± 0.3 | −0.2 ± 0.06 | −0.8 ± 0.1 | 8.3 ± 0.2 | 2.9 ± 0.07 | Eubacterium cylindroides (98.7) | L34617 |
| 20–2a | XVI | 2.9 ± 0.8 | −0.4 ± 0.5 | −1.0 ± 0.3 | 8.5 ± 0.4 | 3.6 ± 0.2 | Streptococcus pleomorphus (98.5) | M23730 |
| 41–2a | XVI | 3.9 ± 0.6 | −0.9 ± 0.2 | −1.8 ± 1.7 | 7.1 ± 0.1 | 2.9 ± 0.1 | Streptococcus pleomorphus (95.5) | M23730 |
| 37–2a | XVI | 2.9 ± 0.9 | −0.8 ± 0.4 | −0.8 ± 0.3 | 8.1 ± 0.2 | 2.2 ± 0.2 | Streptococcus pleomorphus (95.2) | M23730 |
Concentrations are averages of results of three replicates ± standard deviations and were calculated by subtracting the values at t0 from these at t24.
Strains were grown overnight in M2GSC medium supplemented with 8 mM dl‐lactate.
Detection of genes encoding enzymes involved in butyrate production
All 16 chicken‐derived butyrate‐producing strains were screened for the presence of the butyrate kinase operon and/or the butyryl‐CoA : acetate CoA‐transferase gene which carry out the final step of butyrate synthesis.
In strain 40‐4c an amplicon of the expected size (about 771 bp) was obtained after PCR using PTBfor1 and BUKrev2 primers targeted against the butyrate kinase operon. The sequence of the amplicon was 98.6% similar to the butyrate kinase gene of the human faecal bacterium S. variabile (DSM 15176), its closest phylogenetic neighbour (Fig. 1, white arrow). The butyrate kinase operon could not be amplified in any of the other strains with the primer set used.
Butyryl‐CoA : acetate CoA‐transferase gene amplicons of the expected size (about 582 bp) using primer pair CoATDF1 and CoATDR2 were found in clostridial cluster IV, XIVa and XIVb strains 53‐4c, 30‐4c, 7‐4c, 25‐3b, 35‐7e, 33‐7e, 77‐5d and 21‐4c. In these isolates (Fig. 1, striped arrows), except for 21‐4c and 53‐4c (Fig. 1, black arrows), an amplicon (about 530 bp) was also obtained using the BCoATscrF and BCoATscrR primers. Cluster IV strain 24‐4c, nor any of the cluster XVI isolates yielded a PCR product with the two primer pairs targeting the butyryl‐CoA : acetate CoA‐transferase gene. All the isolated cluster XVI strains, except 60‐7e, but also isolate 77‐5d and 21‐4c from cluster XIVa and XIVb (Fig. 1, grey arrows), showed an amplicon of the expected size (about 702 bp) after PCR using degenerate primers designed against propionate CoA‐transferases (PCT primers, Table S1). All CoA‐transferase gene amplicons were sequenced and deduced amino acid sequences subjected to database searches using the blastp algorithm. Two phylogenetic trees were constructed based on the gene sequences related to butyryl‐CoA : acetate CoA‐transferase (Fig. 2A) and propionate CoA‐transferases (Fig. 2B). For most strains, the phylogeny of the CoA‐transferase gene sequences agreed well with the 16S rRNA gene‐based phylogeny (strains 33‐7e, 35‐7e, 77‐5d, 30‐4c, 7‐4c, 25‐3b, Fig. 2A, and isolates 37‐2a, 41‐2a, 20‐2a, 65‐2a, 10‐3b, Fig. 2B). However, the CoA‐transferase gene and 16S rRNA gene‐based phylogenies of strains 53‐4c and 21‐4c were discordant, two strains (77‐5d and 21‐4c) carried more than one CoA‐transferase gene and neither a CoA‐transferase gene nor the butyrate kinase operon could be amplified in strains 24‐4c and 60‐7e. Inspection of draft genome sequences from human isolates belonging to cluster XVI revealed that the CoA transferase gene (Fig. 2B) was located directly downstream of the other butyrate pathway genes (Fig. 3), indicating that it may be linked to butyrate metabolism in these bacteria.
Figure 2.
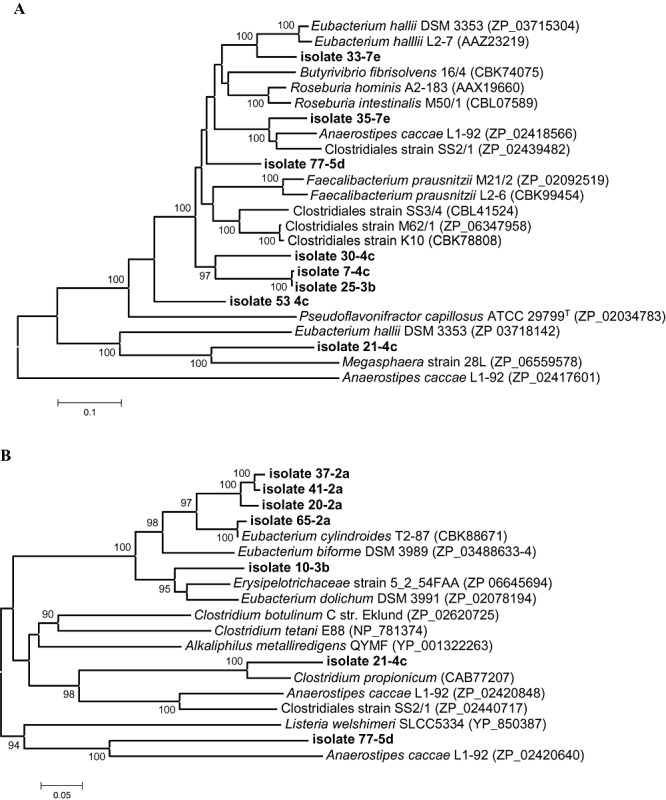
Phylogenetic tree of deduced protein sequences related to butyryl‐CoA : acetate CoA‐transferase (A) and propionate CoA‐transferase (B) respectively. The strains isolated in this study are shown in boldface, while the remaining strains are reference sequences. Accession numbers are given in brackets. The numbers shown at the nodes of the tree indicate bootstrap values out of 100 bootstraps resamplings (values under 90% are not shown). Scale bar: 0.1 (A) or 0.05 (B) substitutions per nucleotide position.
Figure 3.

Arrangement of butyrate pathway genes in human cluster XVI strains. THL, thiolase; BCD, butyryl‐CoA dehydrogenase; ETFβ, electron transfer protein β; ETFα, electron transfer protein α; BHBD, β‐hydroxybutyryl‐CoA dehydrogenase; CRO, crotonase; CoAT, CoA‐transferase. Corresponding genes from draft genome sequences: E. cylindroides T2‐87 (CBK88667–88671; part of BHBD sequence and CRO sequence are missing due to a stretch on N connecting contigs); E. dolichum DSM 3991 (EUBDOL_02008–14); E. biforme DSM 3989 [EUBIFOR_01208–16; two THL genes are present in tandem (EUBIFOR_01208–9), the putative CoA‐transferase (EUBIFOR_01215–16) contains a frameshift].
Discussion
In several molecular‐based studies on broiler gut microbiota using complete caecal as well as mucosa‐associated caecal 16S rRNA clone libraries, the largest set of retrieved sequences represented Clostridium cluster XIVa and Clostridium cluster IV bacteria (Gong et al., 2002; Lan et al., 2002; Zhu et al., 2002; Dumonceaux et al., 2006). Although in the human gut these two phylogenetic lineages contain many butyrate‐producing bacteria (Louis and Flint, 2009), so far from the chicken caecum, only a few Faecalibacterium prausnitzii‐like strains have been cultured and found to produce butyrate (Bjerrum et al., 2006). These butyrate producers were isolated during a study in which the overall microbial community composition in the different intestinal segments was analysed. In the present study we only looked for butyrate producers and found that 69 out of 260 isolates from two layer types and three broiler chickens produced at least 2 mM butyrate. So 26.5% were butyrate producers which is comparable with the 30.9% Barcenilla and colleagues (2000) obtained in the human study. The clonal relatedness of 45 of these isolates (13 isolates could not be recultured after storage) was estimated using RAPD and REP‐PCR fingerprinting; 16 strains with unique RAPD and REP‐PCR fingerprints were selected for further identification using 16S rRNA gene sequence analysis which revealed that they belonged to the clostridial clusters IV, XIVa, XIVb and XVI. Although 16S rRNA gene sequences of F. prausnitzii‐ and S. variabile‐related bacteria within cluster IV are abundant in the lumen as well as in the mucus of the chicken caecum (Gong et al., 2002; Bjerrum et al., 2006), only one S. variabile‐related strain (97% 16S rRNA sequence similarity) was isolated in the present study. Although strains belonging to Roseburia are important butyrate producers in the human colon, none was found in the present study. It remains to be established whether they are also an important component of the chicken microbiota. The 16S rRNA gene sequence similarity of the 16 butyrate‐producing strains towards the type strains of their nearest validly named neighbours varied from 90.4% to 99.1%. As organisms sharing less than 98.5% of their 16S rRNA sequence typically correspond with distinct species (Stackebrandt and Ebers, 2006) these 16 strains most probably represent 14 novel bacterial species.
In the caeca of chickens, lactate is detected during the first 15 days of being live, thereafter only low lactate concentrations are found, presumably as a result of metabolic cross‐feeding from lactate‐producing bacteria such as lactobacilli and bifidobacteria to lactate‐utilizing bacteria (van der Wielen et al., 2000). So far only E. hallii, A. caccae and Clostridiales strain SS2/1 within clostridial cluster XIVa and Megasphaera elsdenii within clostridial cluster IX are known to use lactate as precursor for butyrate synthesis (Soto‐Cruz et al., 2001; Duncan et al., 2004). In the present study, all three clostridial cluster XIVa strains consumed some of the dl‐lactate which was added to the M2GSC medium.
For the production of intracellular butyrate, two distinct pathways are described in clostridia (Gottschalk, 1986). In the human gut, only a few bacterial species, including isolates related to Clostridium nexile and Coprococcus spp., use the butyrate kinase pathway (Louis et al., 2004). Those strains are members of clostridial cluster XIVa, while the strain (40‐4c) carrying the butyrate kinase operon isolated in this study belongs to cluster IV. The majority of the cultured human butyrate‐producing strains are found to carry the butyryl‐CoA : acetate CoA‐transferase gene (Louis et al., 2004; 2010; Charrier et al., 2006) encoding the enzyme which consumes acetate during the process of butyrate formation. The butyryl‐CoA : acetate CoA‐transferase gene was detected in all cluster XIVa and in the majority of the cluster IV strains examined here. Its phylogeny matched the 16S rRNA gene‐based phylogeny for most isolates, except for isolate 53‐4c. The CoA‐transferase gene of strain 21‐4c from cluster XIVb also differed markedly from the other CoA‐transferase sequences and clustered more closely with a second class of CoA‐transferase genes. For both isolates, only one of the degenerate primer sets (CoATDF1 and CoATDR2) led to an amplicon, while the primers amplifying a narrower range of CoA‐transferases, BcoATscrF and BcoATscrR, did not result in an amplicon. Thus these genes may encode CoA‐transferases with a different substrate specificity and it remains to be established whether they are involved in butyrate formation. The butyryl‐CoA : acetate CoA‐transferase gene present in cluster IV, XIVa and XIVb bacteria could not be found in cluster XVI strains by degenerate PCR using primer pairs CoATDF1, CoATDR2 and BCoATscrF, BCoATscrR. Instead, a CoA‐transferase gene more closely related to propionate CoA‐transferases was found in all but one of the cluster XVI isolates. Analysis of draft genome sequences from cluster XVI butyrate producers revealed that this gene is present directly downstream of the central pathway genes for butyrate formation, leading from acetyl‐CoA to butyryl‐CoA. Based on degenerate PCR experiments against several central pathway genes, the arrangement in E. cylindroides strains had previously been assumed to be similar to cluster I strains (Louis and Flint, 2009). However, the evidence from draft genomes shows that cluster XVI strains isolated from human faeces show a different arrangement (Fig. 3) which is also in line with the previous degenerate PCR results. Thus, E. cylindroides in fact carries the same gene arrangement as Eubacterium dolichum rather than the one present in cluster I strains. Many CoA‐transferases that have been examined biochemically have a broad substrate specificity in vitro. The butyryl‐CoA : acetate CoA‐transferase found in many human gut butyrate producers exhibited a similar affinity for propionyl‐CoA as for butyryl‐CoA (Charrier et al., 2006), while the propionate CoA‐transferase from Clostridium propionicum also converts butyrate (Schweiger and Buckel, 1984). It is therefore hypothesized that a CoA‐transferase related to the gene from C. propionicum is responsible for butyrate formation in cluster XVI bacteria, especially as its gene lies directly downstream of the butyrate central pathway genes in the cluster XVI butyrate‐producing bacteria that genome sequence is available for (Fig. 3). Clostridial cluster XIVb isolate 21‐4c is the only isolate found here that produces high amounts of propionate (Table 2) and it carries a CoA‐transferase closely related to the one from C. propionicum, which may be responsible for butyrate production in this strain.
To our knowledge, this is the first study investigating the diversity and phylogenetic relationship of culturable butyrate‐producing bacteria from chicken caeca. It would be useful to confirm the importance of the strains found here on a bigger number of animals using PCR approaches for the detection of the functional genes on the caecal content and clone libraries to see if the same sequences can be retrieved. Although more extensive surveys are likely to reveal additional phylogenetic groups of butyrate‐producing bacteria, the present study indicates that butyrate producers related to cluster XVI may play a more important role in the chicken gut than in the human colon.
Experimental procedures
Chickens
Caecal samples from five chickens were taken. The first two samples were taken from a 14‐week‐old Isa Brown layer type pullet and a 4‐week‐old White Leghorn layer type pullet. For the third, fourth and fifth sampling, the caeca of 4‐week‐old broiler (Ross) chickens, purchased from different commercial farms, were used.
Caecal sampling
Immediately after euthanasia, the caeca were transferred into an anaerobic (84% N2, 8% CO2 and 8% H2) workstation (Ruskinn Technology, Bridgend, UK). One gram of the caecal content was homogenized in 9 ml of anaerobic M2GSC medium pH 6 containing per 100 ml, 30 ml of rumen fluid, 1 g of casitone, 0.25 g of yeast extract, 0.2 g of glucose, 0.2 g of cellobiose, 0.2 g of soluble starch, 0.045 g of K2HPO4, 0.045 g of KH2PO4, 0.09 g of (NH4)2SO4, 0.09 g of NaCl, 0.009 g of MgSO4·7H2O, 0.009 g of CaCl2, 0.1 mg of resazurin, 0.4 g of NaHCO3 and 0.1 g of cysteine hydrochloride (Barcenilla et al., 2000). From this suspension, a 10‐fold serial dilution was made and from each dilution, 0.3 ml was spread onto agar plates containing M2GSC medium with 1.5% agar. Plates were incubated at 41–42°C for 48 h. Single colonies were randomly picked from dilutions 10−7 or 10−8 and grown overnight in 10 ml of M2GSC broth.
SCFA and lactic acid quantification
Quantitative determination of the acidic fermentation products (butyric acid, acetic acid, propionic acid, lactic acid and formic acid) was performed using a validated HPLC‐UV method after 24 h of growth in M2GSC broth or in M2GSC broth supplemented with 8 mM dl‐lactic acid. After centrifugation of the overnight cultures, the supernatant was acidified using concentrated hydrochloric acid and extracted with diethylether for 20 min. After centrifugation, the organic layer was transferred to another extraction tube and extracted again for 20 min with sodium hydroxide. After centrifugation the aqueous phase was transferred to an autosampler vial and concentrated hydrochloric acid was added. An aliquot was injected on the HPLC‐UV instrument. The HPLC instrument consisted of a P1000XR type quaternary gradient pump, an AS3000 type autosampler, a UV1000 type ultraviolet detector and a SN4000 type system controller, all from ThermoFisher Scientific (Breda, the Netherlands). Chromatographic separation was achieved using a PLRP‐S column (250 × 4.6 mm i.d., Varian, Middelburg, the Netherlands). A gradient elution was performed using sodium dihydrogen phosphate in HPLC grade water and HPLC grade acetonitrile as mobile phase A and B respectively. The detector was set at a wavelength of 210 nm. For data processing, the Chromquest software (ThermoFisher Scientific) was used. Quantification was performed using linear calibration curves (calibration range: 0.5–50.0 mM for each compound). Limits of quantification (LOQ) were set at 0.5 mM for formic acid, lactic acid, acetic acid and propionic acid and at 1.0 mM for butyric acid. Limits of detection (LOD) were: 0.19 mM for formic acid, 0.18 mM for lactic acid, 0.19 mM for acetic acid, 0.14 mM for propionic acid and 0.33 mM for butyric acid.
Identification of the butyrate‐producing isolates
RAPD and REP‐PCR were used to investigate the genetic diversity and clonality of the isolates. Genomic DNA was extracted using alkaline lysis as previously described (Scheirlinck et al., 2007). The DNA was used for REP‐PCR with the (GTG)5 primer and RAPD typing using the 10‐nucleotide primer 272 (Table S1) (Versalovic et al., 1994; Coenye et al., 2002). The resulting RAPD and REP‐PCR fingerprints were analysed using the BioNumerics V4.61 software package (Applied Maths, Sint‐Martens‐Latem, Belgium) as described before (Scheirlinck et al., 2007). The similarities among the banding patterns were calculated using Pearson's correlation coefficient (expressed as a percentage‐of‐similarity value) and a dendrogram was constructed based on the UPGMA algorithm (Pearson and Lipman, 1988).
The extracted DNA was further used as target for amplification of 16S rRNA genes using the ‘universal’ eubacterial primers fD1 and rD1 (corresponding to positions 8 and 1541 in the Escherichia coli numbering system) (Table S1) (Weisburg et al., 1991). The purified amplicons were sequenced using the BigDye Terminator sequencing kit with primers pD, γ*, 3 and O* on an ABI PRISM Genetic Analyser (Table S1) (Coenye et al., 1999). The sequences obtained were compared with entries in the EMBL and GenBank database using the blast program (Altschul et al., 1990). The most similar database sequences were aligned with the isolate sequences using the clustalw program (Chenna et al., 2003). To outline the phylogenetic relationship, a neighbour‐joining tree (Saitou and Nei, 1987) was constructed via the phylip package (Felsenstein, 1989), using dnadist for distance analysis (Kimura, 1980) and bootstrap values of 100 replicates.
Amplification and phylogenetic analysis of the genes involved in butyrate formation
The route for butyrate synthesis in the phylogenetically diverse butyrate‐producing strains was determined using degenerate primers PTBfor2 and BUKrev1 for amplification of part of the operon encoding phosphotransbutyrylase and butyrate kinase, via a ramped annealing approach as described previously (Louis et al., 2004). Two degenerate primer pairs were used to amplify part of the butyryl‐CoA : acetyl CoA‐transferase gene. Primer set CoATDF1, CoATDR2 (Table S1) was designed using a broad range of CoA‐transferase‐related sequences and had a non‐degenerate clamp region at the 5′ end, based on the sequence from Roseburia sp. A2‐183 (Charrier et al., 2006). Conserved regions in butyryl‐CoA : acetyl CoA‐transferases but not in 4‐hydroxybutyrate CoA transferase and acetyl‐CoA hydrolase were used for the design of the primers BCoATscrF and BCoATscrR (Table S1) (Louis and Flint, 2007). Degenerate primers PCTfor1 and PCTrev2 (Table S1) were designed against conserved regions of CoA‐transferase genes related to a propionate CoA‐transferase from C. propionicum (AJ276553) (Charrier et al., 2006). PCR products of the expected size were purified and sequenced using the BigDye Terminator sequencing kit. Contigs were generated with Lasergene 6 (DNASTAR) and deduced protein sequences were compared with entries in the GenBank database using blastp (Altschul et al., 1990). The deduced protein sequences and reference sequences were aligned with clustalw (Chenna et al., 2003) and manually inspected. Phylogenetic trees were constructed with MEGA4 (Tamura et al., 2007) using the neighbour‐joining method, 100 times bootstrap, pairwise gap deletion and Poisson correction. Butyrate pathway gene arrangements of clostridial cluster XVI strains E. dolichum, E. biforme and E. cylindroides were examined in draft genome sequences available in the GenBank database by performing blastp analyses with the corresponding genes from human isolate L2‐50 (Louis et al., 2007; accession number of corresponding DNA sequence DQ987697) and the propionate CoA‐transferase gene from C. propionicum (Selmer et al., 2002; Accession No. CAB77207). All hits were between 45% and 79% identical.
Nucleotide sequence accession numbers
The sequences of the 16S rRNA genes and the CoA‐transferase genes used in the construction of the phylogenetic trees are together with the sequence of the butyrate kinase gene deposited under GenBank Accession No. HQ452851–HQ452864, HQ452835–HQ452849 and HQ452850 respectively.
Acknowledgments
DVM Davy Persoons is acknowledged for supplying the chickens. This work was funded by the Belgian Federal Public Service for Health, Food Chain Safety and Environment and the Institute of Science and Technology, Flanders (IWT) (SBO project under contract number 100016). The Rowett Institute of Nutrition and Health receives financial support from the Scottish Government Rural and Environmental Research and Analysis Directorate.
Supporting Information
Additional Supporting Information may be found in the online version of this article:
Sequences of the used primers.
Please note: Wiley-Blackwell are not responsible for the content or functionality of any supporting materials supplied by the authors. Any queries (other than missing material) should be directed to the corresponding author for the article.
References
- Altschul S.F., Gish W., Miller W., Myers E.W., Lipman D.J. Basic local alignment search tool. J Mol Biol. 1990;215:403–410. doi: 10.1016/S0022-2836(05)80360-2. [DOI] [PubMed] [Google Scholar]
- Apajalahti J., Kettunen A., Graham H. Characteristics of the gastrointestinal microbial communities, with special reference to the chicken. World's Poult Sci J. 2004;60:223–232. [Google Scholar]
- Barcelo A., Claustre J., Moro F., Chayvialle J.A., Cuber J.C., Plaisancié P. Mucin secretion is modulated by luminal factors in the isolated vascularly perfused rat colon. Gut. 2000;46:218–224. doi: 10.1136/gut.46.2.218. [DOI] [PMC free article] [PubMed] [Google Scholar]
- Barcenilla A., Pryde S.E., Martin J.C., Duncan S.H., Stewart C.S., Flint H.J. Phylogenetic relationships of dominant butyrate‐producing bacteria from the human gut. Appl Environ Microbiol. 2000;66:1654–1661. doi: 10.1128/aem.66.4.1654-1661.2000. [DOI] [PMC free article] [PubMed] [Google Scholar]
- Barnes E.M., Mead G.C., Barnum D.A., Harry E.G. The intestinal flora of the chicken in the period of 2 to 6 weeks of age, with particular reference to the anaerobic bacteria. Br Poult Sci. 1972;13:311–326. doi: 10.1080/00071667208415953. [DOI] [PubMed] [Google Scholar]
- Bjerrum L., Engberg R.M., Leser T.D., Jensen B.B., Finster K., Pedersen K. Microbial community composition of the ileum and cecum of broiler chickens as revealed by molecular and culture‐based techniques. Poult Sci. 2006;85:1151–1164. doi: 10.1093/ps/85.7.1151. [DOI] [PubMed] [Google Scholar]
- Bond P.L., Hugenholtz P., Keller J., Blackall L.L. Bacterial community structures of phosphate‐removing and nonphosphate‐removing activated sludges from sequencing batch reactors. Appl Environ Microbiol. 1995;61:1910–1916. doi: 10.1128/aem.61.5.1910-1916.1995. [DOI] [PMC free article] [PubMed] [Google Scholar]
- Carlier J.‐P., Bedora‐Faure M., K'ouas G., Alauzet C., Mory F. Proposal to unify Clostridium orbiscindens Winter et al. 1991 and Eubacterium plautii (Séguin 1928) Hofstad and Aasjord 1982, with description of Flavonifractor plautii gen. nov., comb. nov., and reassignment of Bacteroides capillosus to Pseudoflavonifractor capillosus gen. nov., comb. nov. Int J Syst Evol Microbiol. 2010;60:585–590. doi: 10.1099/ijs.0.016725-0. [DOI] [PubMed] [Google Scholar]
- Charrier C., Duncan G.J., Reid M.D., Rucklidge G.J., Henderson D., Young P. A novel class of CoA‐transferase involved in short‐chain fatty acid metabolism in butyrate‐producing human colonic bacteria. Microbiology. 2006;152:179–185. doi: 10.1099/mic.0.28412-0. et al. [DOI] [PubMed] [Google Scholar]
- Chenna R., Sugawara H., Koike T., Lopez R., Gibson T.J., Higgins D.G., Thompson J.D. Multiple sequence alignment with the Clustal series of programs. Nucleic Acids Res. 2003;31:3497–3500. doi: 10.1093/nar/gkg500. [DOI] [PMC free article] [PubMed] [Google Scholar]
- Coenye T., Falsen E., Vancanneyt M., Hoste B., Govan J.R.W., Kersters K., Vandamme P. Classification of Alcaligenes faecalis‐like isolates from the environment and human clinical samples as Ralstonia gilardii sp. nov. Int J Syst Bacteriol. 1999;49:405–413. doi: 10.1099/00207713-49-2-405. [DOI] [PubMed] [Google Scholar]
- Coenye T., Spiker T., Martin A., LiPuma J.J. Comparative assessment of genotyping methods for epidemiologic study of Burkholderia cepacia Genomovar III. J Clin Microbiol. 2002;40:3300–3307. doi: 10.1128/JCM.40.9.3300-3307.2002. [DOI] [PMC free article] [PubMed] [Google Scholar]
- Collins M.D., Lawson P.A., Willems A., Cordoba J.J., Fernandez‐Garayzabel J., Garcia P. The phylogeny of the genus Clostridium: proposal of five new genera and eleven new species combinations. Int J Syst Bacteriol. 1994;44:812–826. doi: 10.1099/00207713-44-4-812. et al. [DOI] [PubMed] [Google Scholar]
- Dumonceaux J.T., Hill J.E., Hemmingsen S.M., Van Kessel A.G. Characterisation of intestinal microbiota and response to dietary virginiamycin supplementation in the broiler chicken. Appl Environ Microbiol. 2006;72:2815–2823. doi: 10.1128/AEM.72.4.2815-2823.2006. [DOI] [PMC free article] [PubMed] [Google Scholar]
- Duncan S.H., Louis P., Flint H.J. Lactate‐utilizing bacteria, isolated from human feces, that produce butyrate as a major fermentation product. Appl Environ Microbiol. 2004;70:5810–5817. doi: 10.1128/AEM.70.10.5810-5817.2004. [DOI] [PMC free article] [PubMed] [Google Scholar]
- Eeckhaut V., Van Immerseel F., Teirlynck E., Pasmans F., Fievez V., Snauwaert C. Butyricicoccus pullicaecorum gen. nov., sp. nov., an anaerobic, butyrate‐producing bacterium isolated from the caecal content of a broiler chicken. Int J Syst Evol Microbiol. 2008;58:2799–2802. doi: 10.1099/ijs.0.65730-0. et al. [DOI] [PubMed] [Google Scholar]
- Eeckhaut V., Van Immerseel F., Pasmans F., De Brandt E., Haesebrouck F., Ducatelle R., Vandamme P. Anaerostipes butyraticus sp. nov., an anaerobic, butyrate producing bacterium from Clostridium cluster XIVa, isolated from broiler chicken caecal content. Int J Syst Evol Microbiol. 2010;60:1108–1112. doi: 10.1099/ijs.0.015289-0. [DOI] [PubMed] [Google Scholar]
- Felsenstein J. phylip– phylogeny inference package (version 3.2) Cladistics. 1989;5:164–166. [Google Scholar]
- Gong J., Forster R.J., Yu H., Chambers J.R., Sabour P.M., Wheatcroft R., Chen S. Diversity and phylogenetic analysis of bacteria in the mucosa of chicken ceca and comparison with bacteria in the cecal lumen. FEMS Microbiol Lett. 2002;208:1–7. doi: 10.1111/j.1574-6968.2002.tb11051.x. [DOI] [PubMed] [Google Scholar]
- Gottschalk G. Springer; 1986. [Google Scholar]
- Hu Z., Guo Y. Effects of dietary sodium butyrate supplementation on the intestinal morphological structure, absorptive function and gut flora in chickens. Anim Feed Sci Technol. 2007;132:240–249. [Google Scholar]
- Kimura M. A simple method for estimating evolutionary rates of base substitutions through comparative studies of nucleotide sequences. J Mol Evol. 1980;16:111–120. doi: 10.1007/BF01731581. [DOI] [PubMed] [Google Scholar]
- Lan P.T., Hayashi H., Sakamoto M., Benno Y. Phylogenetic analysis of cecal microbiota in chicken by the use of 16S rDNA clone libraries. Microbiol Immunol. 2002;46:371–382. doi: 10.1111/j.1348-0421.2002.tb02709.x. [DOI] [PubMed] [Google Scholar]
- Leeson S., Namkung H., Antongiovanni M., Lee E.H. Effect of butyric acid on the performance and carcass yield of broiler chickens. Poult Sci. 2005;84:1418–1422. doi: 10.1093/ps/84.9.1418. [DOI] [PubMed] [Google Scholar]
- Louis P., Flint H.J. Development of a semi‐quantitative degenerate real‐time PCR‐based assay for the estimation of butyryl‐CoA CoA‐transferase genes in complex bacterial samples. Appl Environ Microbiol. 2007;73:2009–2012. doi: 10.1128/AEM.02561-06. [DOI] [PMC free article] [PubMed] [Google Scholar]
- Louis P., Flint H.J. Diversity, metabolism and microbial ecology of butyrate‐producing bacteria from the human large intestine. FEMS Microbiol Lett. 2009;294:1–8. doi: 10.1111/j.1574-6968.2009.01514.x. [DOI] [PubMed] [Google Scholar]
- Louis P., Duncan S.H., McCrae S.I., Millar J., Jackson M.S., Flint H.J. Restricted distribution of the butyrate kinase pathway among butyrate‐producing bacteria from the human colon. J Bacteriol. 2004;186:2099–2106. doi: 10.1128/JB.186.7.2099-2106.2004. [DOI] [PMC free article] [PubMed] [Google Scholar]
- Louis P., McCrae S.I., Charrier D., Flint H.J. Organization of butyrate synthetic genes in human colonic bacteria: phylogenetic conservation and horizontal gene transfer. FEMS Microbiol Lett. 2007;269:240–247. doi: 10.1111/j.1574-6968.2006.00629.x. [DOI] [PubMed] [Google Scholar]
- Louis P., Young P., Holtrop G., Flint H.J. Diversity of human colonic butyrate‐producing bacteria revealed by analysis of the butyryl‐CoA : acetate CoA‐transferase gene. Environ Microbiol. 2010;12:304–314. doi: 10.1111/j.1462-2920.2009.02066.x. [DOI] [PubMed] [Google Scholar]
- Lu J., Idris U., Harmon B., Hofacre C., Maurer J.J., Lee M.D. Diversity and succession of the intestinal bacterial community of the maturing broiler chicken. Appl Environ Microbiol. 2003;69:6816–6824. doi: 10.1128/AEM.69.11.6816-6824.2003. [DOI] [PMC free article] [PubMed] [Google Scholar]
- Pearson W.R., Lipman D.J. Improved tools for biological sequence comparison. Proc Natl Acad Sci USA. 1988;85:2444–2448. doi: 10.1073/pnas.85.8.2444. [DOI] [PMC free article] [PubMed] [Google Scholar]
- Place R.F., Noonan E.J., Giardina C. HDAC inhibition prevents NF‐κB activation by suppressing proteasome activity: down‐regulation of proteasome subunit expression stabilizes IκBα. Biochem Pharmacol. 2005;70:394–406. doi: 10.1016/j.bcp.2005.04.030. [DOI] [PubMed] [Google Scholar]
- Roediger W.E.W. The colonic epithelium in ulcerative colitis: an energy deficient disease? Lancet. 1980;2:712–715. doi: 10.1016/s0140-6736(80)91934-0. [DOI] [PubMed] [Google Scholar]
- Saitou N., Nei M. The neighbor‐joining method: a new method for reconstructing phylogenetic trees. Mol Biol Evol. 1987;4:406–425. doi: 10.1093/oxfordjournals.molbev.a040454. [DOI] [PubMed] [Google Scholar]
- Schauber J., Svanholm C., Termén S., Iffland K., Menzel T., Scheppach W. Expression of the cathelicidin LL‐37 is modulated by short chain fatty acids in colonocytes: relevance of signalling pathways. Gut. 2003;52:735–741. doi: 10.1136/gut.52.5.735. et al. [DOI] [PMC free article] [PubMed] [Google Scholar]
- Scheirlinck I., Van der Meulen R., Van Schoor A., Vancanneyt M., De Vuyst L., Vandamme P., Huys G. Influence of geographical origin and flour type on the diversity of lactic acid bacteria in traditional Belgian sourdoughs. Appl Environ Microbiol. 2007;73:6262–6269. doi: 10.1128/AEM.00894-07. [DOI] [PMC free article] [PubMed] [Google Scholar]
- Schweiger G., Buckel W. On the dehydration of (R)‐lactate in the fermentation of alanine to propionate by Clostridium propionicum. FEBS Lett. 1984;171:79–84. doi: 10.1016/0014-5793(84)80463-9. [DOI] [PubMed] [Google Scholar]
- Selmer T., Willanzheimer A., Hetzel M. Propionate CoA‐transferase from Clostridium propionicum. Cloning of gene and identification of glutamate 324 at the active site. Eur J Biochem. 2002;269:372–380. doi: 10.1046/j.0014-2956.2001.02659.x. [DOI] [PubMed] [Google Scholar]
- Soto‐Cruz O., Chávez‐Rivera R., Saucedo‐Castañeda G. Stimulation of the Megasphaera elsdenii's butyrate production in continuous culture by a yeast additive. Braz Arch Biol Technol. 2001;44:179–184. [Google Scholar]
- Stackebrandt E., Ebers J. Taxonomic parameters revisited: tarnished golden standards. Microbiol Today. 2006;33:152–155. [Google Scholar]
- Tamura K., Dudley J., Nei M., Kumar S. MEGA4: molecular evolutionary genetics analysis (MEGA) software version 4.0. Mol Biol Evol. 2007;24:1596–1599. doi: 10.1093/molbev/msm092. [DOI] [PubMed] [Google Scholar]
- Täpp J., Thollesson M., Herrmann B. Phylogenetic relationships and genotyping of the genus Streptococcus by sequence determination of the RNase P RNA gene, rnpB. Int J Syst Evol Microbiol. 2003;53:1861–1871. doi: 10.1099/ijs.0.02639-0. [DOI] [PubMed] [Google Scholar]
- Timbermont L., Lanckriet A., Dewulf J., Nollet N., Schwarzer K., Haesebrouck F. Control of Clostridium perfringens induced necrotic enteritis in broilers by target released butyric acid, fatty acids and essential oils. Avian Pathol. 2010;39:117–121. doi: 10.1080/03079451003610586. et al. [DOI] [PubMed] [Google Scholar]
- Van Immerseel F., Boyen F., Gantois I., Timbermont L., Bohez L., Pasmans F. Supplementation of coated butyric acid in the feed reduces colonization and shedding of Salmonella in poultry. Poult Sci. 2005;84:1851–1856. doi: 10.1093/ps/84.12.1851. et al. [DOI] [PubMed] [Google Scholar]
- Versalovic J., Scheider M., De Bruijn F.J., Lupski J.R. Genomic fingerprinting of bacteria using repetitive sequence‐based polymerase chain reaction. Methods Mol Cell Biol. 1994;5:25–40. [Google Scholar]
- Watkins B.A., Kratzer F.H. Effect of oral dosing of Lactobacillus strains on gut colonization and liver biotin in broiler chicks. Poult Sci. 1983;62:2088–2094. doi: 10.3382/ps.0622088. [DOI] [PubMed] [Google Scholar]
- Weisburg W.B., Barns S.M., Pelletier D.A., Lane D.J. 16S ribosomal DNA amplification for phylogenetic study. J Bacteriol. 1991;173:697–703. doi: 10.1128/jb.173.2.697-703.1991. [DOI] [PMC free article] [PubMed] [Google Scholar]
- van der Wielen P.W.J., Biesterveld S., Notermans S., Hofstra H., Urlings B.A.P., van Knapen F. The role of volatile fatty acids in development of the caecal microflora in broiler chickens during growth. Appl Environ Microbiol. 2000;66:2536–2540. doi: 10.1128/aem.66.6.2536-2540.2000. [DOI] [PMC free article] [PubMed] [Google Scholar]
- van der Wielen P.W.J., Rovers G.M.L.L., Scheepens J.M.A., Biesterveld S. Clostridium lactatifermentans sp. nov., a lactate‐fermenting anaerobe isolated from the caeca of a chicken. Int J Syst Evol Microbiol. 2002;52:921–925. doi: 10.1099/00207713-52-3-921. [DOI] [PubMed] [Google Scholar]
- Wolin J.M., Miller L.M., Yerry S., Zhang Y., Bank S., Weaver G.A. Changes of fermentation pathways of fecal microbial communities associated with a drug treatment that increases dietary starch in the human colon. Appl Environ Microbiol. 1999;65:2807–2812. doi: 10.1128/aem.65.7.2807-2812.1999. [DOI] [PMC free article] [PubMed] [Google Scholar]
- Zhu X.Y., Zhong Y., Pandya Y., Joerger R.D. 16S rRNA‐based analysis of microbiota from the cecum of broiler chickens. Appl Environ Microbiol. 2002;68:124–137. doi: 10.1128/AEM.68.1.124-137.2002. [DOI] [PMC free article] [PubMed] [Google Scholar]
Associated Data
This section collects any data citations, data availability statements, or supplementary materials included in this article.
Supplementary Materials
Sequences of the used primers.