

Summary
Adequate identification of Salmonella enterica serovars is a prerequisite for any epidemiological investigation. This is traditionally obtained via a combination of biochemical and serological typing. However, primary strain isolation and traditional serotyping is time‐consuming and faster methods would be desirable. A microarray, based on two housekeeping and two virulence marker genes (atpD, gyrB, fliC and fljB), has been developed for the detection and identification of the two species of Salmonella (S. enterica and S. bongori), the five subspecies of S. enterica (II, IIIa, IIIb, IV, VI) and 43 S. enterica ssp. enterica serovars (covering the most prevalent ones in Austria and the UK). A comprehensive set of probes (n = 240), forming 119 probe units, was developed based on the corresponding sequences of 148 Salmonella strains, successfully validated with 57 Salmonella strains and subsequently evaluated with 35 blind samples including isolated serotypes and mixtures of different serotypes. Results demonstrated a strong discriminatory ability of the microarray among Salmonella serovars. Threshold for detection was 1 colony forming unit per 25 g of food sample following overnight (14 h) enrichment.
Introduction
Members of the genus Salmonella are capable of infecting humans and a wide variety of animal species. They are one of the main cause for human food‐borne enteric diseases (Beltran et al., 1988). The genus Salmonella contains two species: Salmonella enterica and Salmonella bongori (Brenner et al., 2000). Salmonella enterica is further subdivided into six subspecies: enterica, salamae, arizonae, diarizonae, houtenae and indica. However, S. enterica ssp. enterica is responsible for the vast majority of Salmonella infections in warm‐blooded hosts (Kingsley and Baumler, 2000).
The Kauffmann–White scheme (Popoff, 2001; Popoff et al., 2003) is widely used as a typing method for classification of Salmonella into serovars, on the basis of antigenic variability in the outer membrane lipopolysaccharide (O antigen), flagellar proteins (H1 and H2 antigens) and capsular polysaccharide (Vi antigen) (Le Minor and Bockemuhl, 1984; 1988). More than 2400 serovars of S. enterica ssp. enterica have been identified to date (Popoff et al., 2000a,b). Despite their close genetic relatedness, some serovars differ in their host range and pathogenicity.
The conventional microbiological method for serotyping Salmonella takes up to 5–7 days, and requires the production of specific antibodies in animal models. Faster DNA‐based alternative approaches would be preferred from an economical and ethical point of view. Robust methods based on multilocus sequence typing and pulse field gel electrophoresis methods are being developed for genotyping of individual isolates (Agron et al., 2001; Echeit et al., 2002; Kotetishvili et al., 2002; Sukhnanand et al., 2005; Torpdahl et al., 2005; Konstantinidis et al., 2006). The applicability of flagellar genes as molecular marker genes for the identification of various serovars has been demonstrated (McQuiston et al., 2004; Mortimer et al., 2004; Herrera‐Leon et al., 2007; Tankouo‐Sandjong et al., 2007). While polymerase chain reaction (PCR) typing methods are limited in the number of serovars which can be addressed in a single reaction, multilocus sequence typing and pulse field gel electrophoresis methods are still relatively time‐consuming and do not readily lend themselves to automation.
Microarrays are powerful tools in microbial diagnostics, enabling high throughput, parallel detection and/or detailed genotyping of microbes (Call et al., 2003; Zhou, 2003; Bodrossy and Sessitsch, 2004; Hashsham et al., 2004; Wagner et al., 2007). DNA microarrays for Salmonella have been developed for isolate genotyping, strain differentiation and the detection of antibiotic resistance genes (Porwollik et al., 2004; van Hoek et al., 2005; Pelludat et al., 2005; Malorny et al., 2007) and, more recently, towards serotyping of isolates (Yoshida et al., 2007; Wattiau et al., 2008).
A microarray‐based Salmonella serotyping method can address hundreds of different serovars in a single reaction and deliver results within 24 h, avoiding the need for strain isolation. Furthermore, it presents the potential for the parallel detection and identification of a limited number of different, coexisting serovars. There are several factors making the development of a Salmonella serotyping array a non‐trivial task. A large number of different genes are involved in the synthesis of the O antigen, thus an O‐based microarray requires multiplex PCR amplification (Yoshida et al., 2007). Lateral gene transfer and recombination of fliC and fljB lead to the existence of polyphyletic serovars (Beltran et al., 1988; Smith et al., 1990; Tankouo‐Sandjong et al., 2007). Correlation between genotyping results and serotypes needs thus be very carefully validated for every geographic region.
In this report, we describe the development and evaluation of a new diagnostic microarray assay for Salmonella serotyping, based on short oligoprobes targeting the atpD, gyrB, fliC and fljB genes. Several approaches were applied to achieve reliable differentiation based on single‐nucleotide differences and the detection threshold was determined. The potential of this microarray to identify 43 serotypes, which represent the most prevalent serotypes in several European countries, is shown.
Results and discussion
Probe design
Previous work has shown the applicability of two bacterial housekeeping genes, gyrB and atpD (encoding subunit B of the DNA gyrase, a type II topoisomerase and the beta subunit of ATP synthase respectively), in combination with two virulence genes, fliC and fljB (encoding the H1 and H2 flagellar antigens respectively), to differentiate closely related Salmonella serovars (Tankouo‐Sandjong et al., 2007). atpD and gyrB compared favourably to the other investigated genes, showing high discrimination power between species, subspecies and S. enterica serovars (Tankouo‐Sandjong et al., 2007). Discrimination at the serovar level was considerably increased if fliC and fljB were used in combination with atpD and gyrB (Fig. 1 and Fig. S1). Thus, probe design was based on atpD, gyrB, fliC and fljB.
Figure 1.
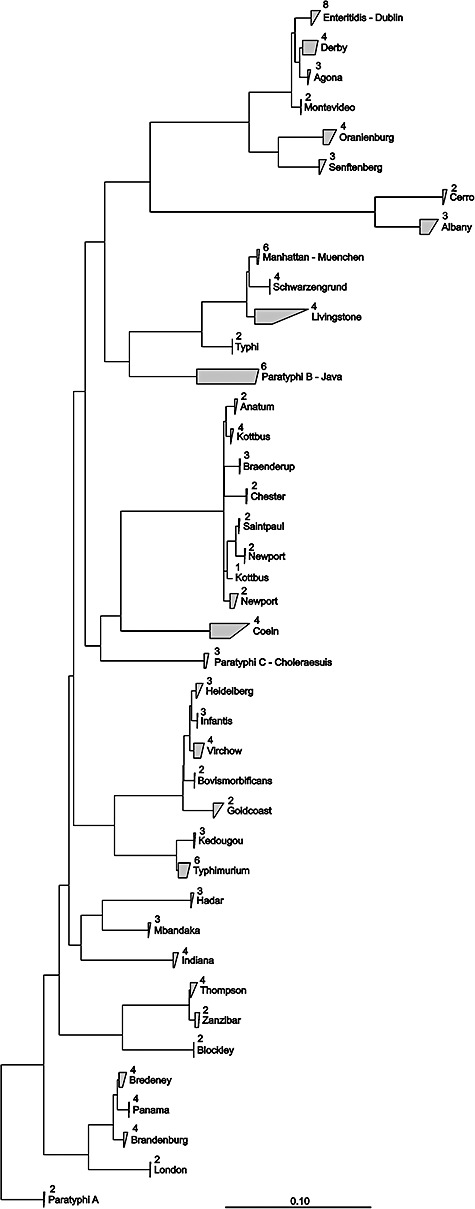
Neighbour‐joining dendrogram based on concatenated nucleotide sequences of the atpD, gyrB, fliC and fljB genes. Sequences belonging to the same clade are grouped. Numbers indicate the number of sequences (strains) comprising the clade. Positions considered to generate the tree are shown in Table 2. The bar represents 10% evolutionary sequence divergence.
Sequence analysis indicated several instances of lateral gene transfer of the fliC gene (assortative recombination) (Li et al., 1994; Tankouo‐Sandjong et al., 2007), transforming one serovar into another one. When such an event occurs, it results in the ‘appearance’ of a new serovar. The relationship between such a new strain and its immediate predecessor is not recognized by serotyping, which, in isolated cases, may potentially lead to erroneous conclusions regarding Salmonella epidemiology. These cases were successfully resolved by the combination of sequence information from housekeeping genes (phylogenetic markers) and flagellar genes.
Limitations were observed in the discriminatory ability of some probes mostly because they contained only one weak weighted mismatch resulting in false‐positive hybridization with non‐target sequences. The strength of mismatches between probe and non‐targeted serovar sequences using sense versus antisense probes was considered and the probe variant with the stronger mismatch was always selected. Where single ('standalone’) probes, perfectly matching their target sequence, failed to provide the necessary specificity, three different approaches were applied (to discriminate between target and non‐target sequences differing only by a single nucleotide). The first approach termed ‘perfect match/mismatch approach’ consisted of designing mismatch probes (perfect match towards non‐target sequences), and using the ratio between the hybridization signal of original (‘perfect match’, PM) probes and mismatch (MM) probes for efficient discrimination (Fig. 2). In the second approach, termed ‘modulation approach’, a weak mismatch was introduced into the probes perfectly matching the target sequences. This modification led to an additional mismatch against non‐target sequences. While the hybridization signal to target sequences decreased slightly but was still clearly detectable, the hybridization signal to non‐target sequences disappeared completely (Fig. 2).
Figure 2.
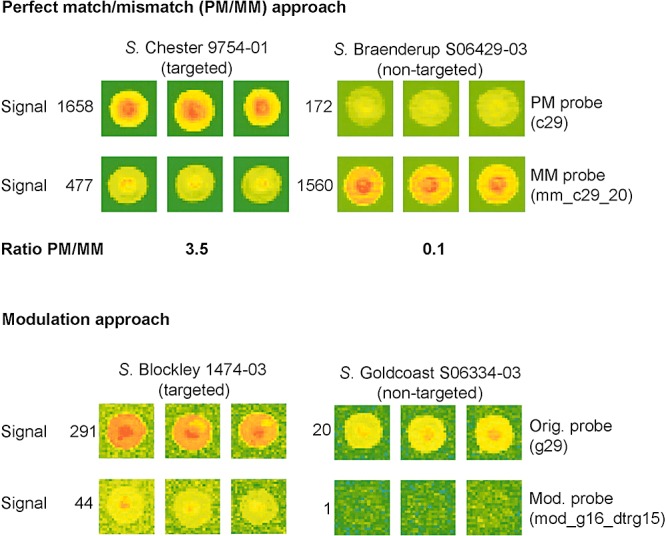
Perfect match/mismatch (PM/MM) and modulation approaches for single‐nucleotide discrimination. The top panel shows the PM/MM approach, comparing the hybridization signal of a PM probe and a MM probe, each against a targeted and a non‐targeted serovar. Signal values represent the mean of normalized values from the three subarrays. Images were scanned at 100% laser power, 550 V PMT and are displayed in rainbow colour mode. Setting for brightness and contrast was 52% and 50%, respectively, in both cases. The bottom panel shows the modulation approach, comparing the hybridization signal of a standalone probe and a modulated probe, each against a targeted and a non‐targeted serovar. Signal values represent the mean of normalized values from the three subarrays. Images were scanned at 100% laser power, 550 V PMT and are displayed in rainbow colour mode. Settings for both brightness and contrast were 97% in both cases. Probe sequences are provided in Table S1.
In total, 240 oligonucleotide probes targeting the four selected marker genes atpD, gyrB, fliC and fljB (17–29 nucleotides in length) were designed using the phylogenetic software package ARB (Ludwig et al., 2004). These probes formed 119 probe units (42 standalone probes, including 5 modulated probes and 77 PM/MM combinations), specific to different serovars, subgroups of serovars or combinations of different serovars (Table S1).
The set of probe units was designed according to the multiple probe concept as far as it was feasible. For example, the serotype S. Choleraesuis is specifically detected by seven probe units, also targeted by another seven probe units specific to S. Choleraesuis and S. Paratyphi C and by four probe units specific to most Salmonella serovars (Fig. 3 and Fig. S2). Altogether, both species and all subspecies of Salmonella as well as the 43 S. enterica ssp. enterica serovars most prevalent in Austria and the UK are covered by the developed set of probe units (Table S1).
Figure 3.
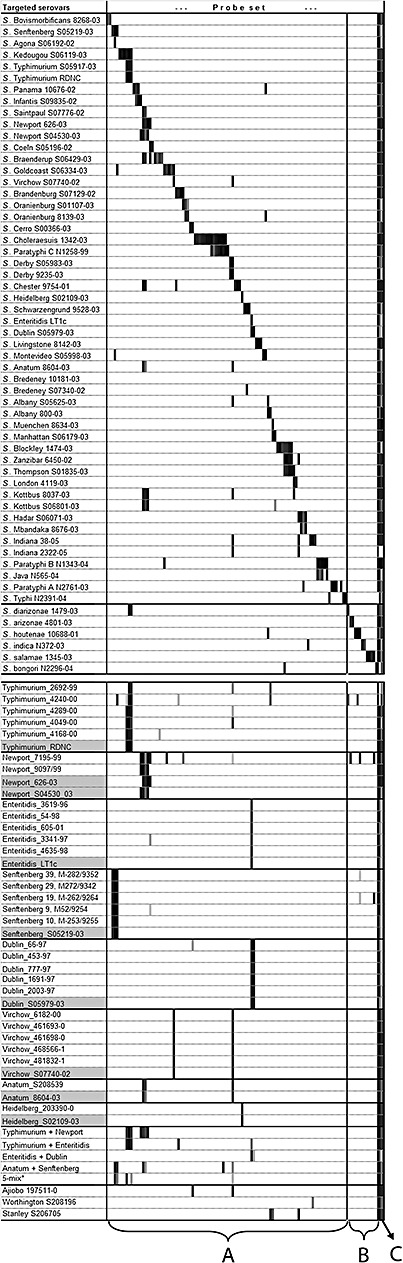
Validation of the microarray with pure cultures (top) and blind samples (bottom). Columns correspond to probe units (see Experimental procedures). A: panel of probes targeting serotypes belonging to S. enterica (I). B: panel of probes targeting S. salamae (II), S. arizonae (IIIa), S. diarizonae (IIIb), S. indica (IV) and S. bongori (V). C: generic probes targeting most serovars of S. enterica and S. bongori. Results are visualized via a continuous grade of shading [based on (Signal – Threshold)/Signal, where white is assigned to the value of 0, light grey to 0.01 and black to 1, see also Experimental procedures]. Serovars highlighted in grey in the second part of the table are the corresponding reference strains for the given serovars from the top part, used to illustrate the expected hybridization patterns. The asterisk (*) indicates mixture consisting of equal amounts of serovars Typhimurium, Enteritidis, Dublin, Senftenberg and Virchow.
Validation with pure cultures
The developed microarray was first validated by hybridization with targets generated from genomic DNA of 57 reference strains representing S. bongori, the six subspecies of S. enterica, and the 43 S. enterica ssp. enterica serovars most prevalent in Austria and the UK (Fig. 3 and Fig. S2). As the diversity of flagellar genes in S. enterica subspecies II, IIIa, IIIb, IV, VI and S. bongori is largely unknown, probes for them were designed based only on atpD and gyrB, not on fliC or fljB. When analysing hybridization results, signals of atpD and gyrB probe units were checked first to establish the presence or absence of Salmonella isolates belonging to subspecies or species, other than S. enterica ssp. enterica. Serovar‐level diagnostic was only attempted when the absence of other subspecies and/or S. bongori was confirmed.
Evaluation using blind samples
Samples containing one to five different Salmonella strains have been analysed in a blind evaluation study. All the 27 Salmonella strains analysed, representing seven different serovars targeted by the array, could be clearly identified (Fig. 3 and Fig. S2). The analysis of three serovars (S. Ajiobo, S. Stanley, S. Worthington), not targeted by the microarray, clearly indicated the presence of non‐targeted serovar(s). None of these analyses led to false identification.
Potential for parallel serotyping
Microarray analysis of the blind samples also allowed for accurate detection of multiple serovars present in mixed samples except for the mixture containing five different serovars where only two serovars (S. Senftenberg, S. Typhimurium) were clearly identified. The parallel serotyping potential of the current microarray is also limited by certain combinations of serovars. For example, Enteritidis will give positive signal with probe unit 62 and Dublin will with probe units 62 and 63; however, a mixture of Dublin and Enteritidis will be positive for probe units 62 and 63 again, being thus indistinguishable from Dublin only. Similar combinations are currently Agona and Senftenberg; Kedougou and Typhimurium; München and Manhattan; Hadar and Mbandaka. Such ambiguities can in the future be resolved by probes specifically designed to exclude the possibility of the presence of, to use the first example, Dublin. Requirement for such a probe is to be positive for Enteritidis and negative for Dublin; positive signal with further serovars will be allowed as the probe will only be assessed in combination with the ‘Dublin‐only’ and the ‘Dublin‐plus‐Enteritidis' probes.
Sensitivity of detection
The sensitivity of the detection is defined by the PCR amplification. In practical terms, detection works as long as PCR products are obtained. Amplification with atpD, gyrB, fliC and fljB primers was more sensitive when purified DNA was used as template. The detection limit was established at 1.1 × 10³ colony‐forming units (cfu) of Salmonella, as defined by the least sensitive PCR reaction, the amplification of fliC. Following 8 h enrichment in 225 ml of buffered peptone water, 103 cfu of Salmonella could be detected from 25 g of spiked food sample (both meat and tomato). Increasing the enrichment to overnight (14 h) decreased the detection limit down to 1 cfu (see also Table S2).
Conclusions
The combination of the phylogenetic markers gyrB, atpD with the flagellin genes fliC and fljB showed good discrimination between a panel of 148 Salmonella isolates covering the two species of Salmonella (S. enterica and S. bongori), the five subspecies of S. enterica (II, IIIa, IIIb, IV, VI) and 43 S. enterica ssp. enterica serovars belonging to the most prevalent ones in several European countries. The microarray represents a powerful tool for fast and reliable serotyping of Salmonella and may have the potential to replace traditional serotyping. Approximately 8000 Salmonella strains are serotyped annually alone in the Austrian Salmonella Reference Center (Austria has a population of eight million people). Conventional serotyping has been performed so far. Currently, the developed microarray is tested for routine application. Due to its potential for multiple serotyping, this microarray constitutes also a useful tool for serotyping samples directly without the need for the isolation of Salmonella strains. This could be particularly helpful in large‐scale epidemiological and environmental investigations.
Experimental procedures
Serovars, bacterial strains and blind samples
Serovars, susbspecies and species targeted by the microarray are: Agona, Albany, Anatum, Blockley, Bovismorbificans, Braenderup, Brandenburg, Bredeney, Cerro, Chester, Choleraesuis, Coeln, Derby, Dublin, Enteritidis, Goldcoast, Hadar, Heidelberg, Indiana, Infantis, Java, Kedougou, Kottbus, Livingstone, London, Manhattan, Mbandaka, Montevideo, Muenchen, Newport, Oranienburg, Panama, Paratyphi A, Paratyphi B, Paratyphi C, Saintpaul, Schwarzengrund, Senftenberg, Thompson, Typhi, Typhimurium, Virchow, Zanzibar; S. enterica spp. salamae, arizonae, diarizonae, houtenae and indica; and S. bongori. Salmonella reference strains and blind samples were of diverse source (including human, food and veterinary), provided by the Department of Food and Environmental Safety, Veterinary Laboratories Agency (Weybridge, UK), the Austrian Agency for Health and Food Safety (Graz, Austria) and the National Center for Enteropathogenic Bacteria (Lucerne, Switzerland) (Table S3). Mixtures in blind samples representing up to five different serovars contained equal amounts of cells grown under identical conditions.
DNA preparation
Cells from overnight cultures were grown aerobically in buffered peptone water (Merck, NJ, USA) at 37°C. Cells were harvested and genomic DNA was prepared using the GenElute Bacterial Genomic DNA kit (Sigma‐Aldrich, MO, USA) according to the manufacturer's instructions.
PCR conditions and primers
Purified genomic DNA was used as template for generating gyrB, atpD, fliC and fljB amplicons. Amplification reactions (50 µl) consisting of 1× PCR buffer, 1.5 mM MgCl2, 50 nM for each of four dNTPs, 15 pmol of both primers, 1 ng of genomic DNA as template and 1 U of Taq DNA polymerase (Invitrogen, Carlsbad, CA, USA) were performed in a Hybaid Combi Thermal Reactor TR2 in accordance with the manufacturer's instructions. Primers gySalm384f and gySalm1402r were developed in this study to enable a more sensitive, Salmonella‐specific amplification of the gyrB gene. Amplification parameters for this primer pair were as follows: 95°C for 5 min, then 30 cycles of 1 min at 95°C, 1 min at 63°C, 1 min at 72°C, followed by a final elongation step of 7 min at 72°C. Amplification parameters for the other PCR primers were those described in the corresponding publications, shown in Table 1. Polymerase chain reaction products were sequenced using the respective primer pairs used for PCR amplification.
Table 1.
Primers used in this study.
| Primer designation | Sequence (5′–3′) | Product size | Reference | Tann |
|---|---|---|---|---|
| atpDF (5737) (atpD fw primer) | TAGTTGACGTCGAATTCCCTCAGG | 888 bp | Christensen and Olsen (1998) | 55°C |
| atpDR (6625) (atpD rev primer) | GGAGACGGGTCAGTCAAGTCATC | |||
| FSa1 (fliC fw primer) | CAAGTCATTAATAC(AC)AACAGCCTGTCGC | 1500 bp | Dauga et al. (1998) | 55°C |
| rFSa1 (fliC rev primer) | TTAACGCAGTAAAGAGAGGACGTTTTGC | |||
| FSa2 (fljB fw primer) | GGCACAAGTAATCAACACTAACAGTCTGT | 1478 bp | 58°C | |
| rFSa2 (fljB rev primer) | CGTAACAGAGACAGCACGTT(CT)TG(CT)G | |||
| gySalm384f (gyrB fw primer) | AAAACTGG(AG)(AG)CTGGTTATCCAGCGAGATGG(CG) | 1018 bp | This study | 63°C |
| gySalm1402r (gyrB rev primer) | CAGCCCAG(CT)GCGGT(AG)ATCAG(AC)GTCGC |
DNA sequencing
Polymerase chain reaction products were purified using the High Pure PCR Product Purification kit (Roche, Basel, Switzerland) according to the manufacturer's instructions. Sequencing of PCR products was performed by the dideoxy chain termination method using an ABI 373A automated DNA sequencer and the ABI PRISM Big Dye terminator Cycle Sequencing Kit (PE Applied Biosystems, Foster City, CA, USA). Primers used for sequencing were the same as used for generating the PCR products.
DNA sequence analysis
Sequences obtained and downloaded from GenBank were aligned using the freely available ARB software package (Ludwig et al., 2004) according to the alignment of translated amino acid sequences. Aligned DNA sequences were trimmed to a uniform length (corresponding to nucleotide positions 105–878 for atpD, 460–1430 for gyrB, 90–1413 for fliC and 62–725 for fljB of the genome of S. enterica Typhimurium LT2 (Accession No. NC_003197) (Table 2). Trimmed sequences were used to construct a concatenated alignment. Trees based on the neighbour‐joining method were built from the individual alignments as well as from the concatenated alignment. Reliability of the tree structure was assessed via bootstrap analysis, using the PHYLIP phylogenetic software package (functions SEQBOOT, DNADIST, NEIGHBOR and CONSENSE) (Felsenstein, 1989). Nucleotide sequence data obtained in this study were deposited in GenBank under Accession No. DQ838098–DQ838466 and EF570059–EF570063. Nucleotide sequence data also considered in this study, but published earlier (Tankouo‐Sandjong et al., 2007), are available in GenBank under Accession No. DQ095313–DQ095611.
Table 2.
Characteristics of the marker genes used in this study.
| Gene | Size for analysis (bp)a | Salmonella Typhimurium LT_2 positionb | G+C%c | No. of sequences analysedd |
|---|---|---|---|---|
| atpD | 774 | 105–878 | 55 | 148 |
| gyrB | 971 | 460–1430 | 55 | 148 |
| fliC | 1363 (1105–1356) | 90–1413 | 47 | 133 |
| fljB | 663 (657–663) | 62–725 | 52 | 133 |
Numbers in parentheses indicate the effective lengths not counting alignment gaps.
Nucleotide positions on the corresponding gene of Salmonella Typhimurium LT_2, Accession No. NC_003197.
Average value of all Salmonella sequences analysed.
The fliC and fljB sequences considered in the analysis were only those of Salmonella enterica ssp. enterica serovars.
Oligonucleotide probe design
Probes based on atpD, gyrB, fliC and fljB were designed using the Probe Design and Probe Match functions in ARB. Output files of the Probe Match function were imported into CalcOligo 2.03 (http://www.calcoligo.org) and used to create an Excel table indicating predicted melting temperatures [based on the nearest‐neighbour model and Santa Lucia parameters (Santalucia et al., 1996), at 250 nM oligonucleotide and 50 mM Na+ concentrations], length and GC content of the probes, as well as the number of weighted mismatches between each probe target pair. Mismatch weight factors in CalcOligo were as follows. Positions: 5′ 1st 0.3; 5′ 2nd 0.6; 5′ 3rd 1.0; 3′ 1st 0.3; 3′ 2nd 0.8; 3′ 3rd 1.1; all other positions 1.2. Basepairs: dArC 1.2; dTrC 1.2; dGrU 0.7; dTrG 0.4; all other mismatched base pairs 1.0. Besides single probes (‘standalone probes’), sets of PM and one or several MM probes were also designed, where a single‐nucleotide mismatch had to be detected. Probes were grouped into probe units, consisting of either a standalone probe or a PM probe and one or more corresponding MM probes.
Array preparation and spotting
Oligonucleotide probes were custom synthesized (Integrated DNA Technologies, Coralville, IA, USA) with a 5′ NH2 group, followed by a C6 spacer and five thymidine residues preceding the probe sequence. A 384‐well flat‐bottom plate was prepared with 30 µl of 50 µM oligonucleotide solutions in 50% DMSO. Samples were spotted with an OmniGrid spotter using a single TeleChem SMP3 pin at 50% relative humidity (using the humidity controller of the spotter) and 22°C, onto silylated slides (with aldehyde chemistry, Cel Associates, Houston, USA).
Arrays were always spotted in triplicate to enable statistical correction for errors. Spotted slides were incubated overnight at room temperature at less than 30% relative humidity. Slides were then rinsed twice in 0.2% (w/v) SDS for 2 min at room temperature with vigorous agitation to remove the unbound DNA, followed by rinsing twice in distilled water (dH2O) for 2 min at room temperature with vigorous agitation, transferred into dH2O, pre‐heated to 95–100°C for 2 min and allowed to cool at room temperature (∼5 min). Slides were treated in a freshly prepared (immediately before use) sodium borohydride solution for 5 min at room temperature to reduce free aldehydes. The sodium borohydride solution was prepared by dissolving 0.5 g of NaBH4 in 150 ml of phosphate‐buffered saline (PBS; 8 g of NaCl, 0.2 g of KCl, 1.44 g of Na2HPO4, 0.24 g of KH2PO4, in 1000 ml of dH2O, pH 7.4, autoclaved), followed by the addition of 44 ml of 100% ethanol to reduce bubbling. Slides were rinsed three times in 0.2% (w/v) SDS and once in dH2O for 1 min each at room temperature. Finally, slides were dried individually using an airgun fitted with a cotton wool filter (to keep oil microdroplets away from the slide surface). Dried slides were stored at room temperature in the dark before use.
Target preparation
The primers used to amplify fragments from gyrB, atpD, fliC and fljB genes are listed in Table 1. The forward primers and the reverse primers contained the T3 (ATAGGTATTAACCCTCACTAAAG) and T7 (5′‐TAATACGACTCACTATAG‐3′) promoter sites respectively at their 5′ end. The T3 and T7 promoter sites enabled T3 and T7 RNA polymerase mediatedin vitro transcription using the PCR products as templates.
For each target, three parallel PCR reactions were performed. Polymerase chain reaction products were pooled and purified using the HighPure PCR product purification kit (Roche, Basel, Switzerland) according to manufacturer's instructions. The purified PCR products were dissolved in ultrapure water to a DNA concentration of 50 ng µl−1 and stored at −20°C.
Working under RNase‐free conditions, in vitro transcription was carried out as follows: 8 µl of purified PCR product (50 ng µl−1) containing 2 µl of each PCR product generated by amplification of the four marker genes atpD, gyrB, fliC and fljB, 4 µl of 5× T7 RNA polymerase buffer or T3 RNA‐polymerase buffer, 2 µl of DTT (100 µM), 0.5 ml of RNasin (40 U µl−1) (Promega, Wisconsin, USA), 1 µl each of ATP, CTP, GTP (10 µM), 0.5 µl of UTP (10 mM), 1 µl of T7 RNA polymerase (40 U µl−1) (Invitrogen) or 1 µl of T3 RNA polymerase (40 U µl−1) (Fermentas International, Burlington, Ontario, Canada) and 1 µl of Cy3‐UTP (5 µM) were added into a 1.5 ml microcentrifuge tube and incubated at 37°C for 4 h. RNA was purified immediately using the Quiagen RNeasy kit (Quiagen GmbH, Hilden, Germany) according to manufacturer's instructions. Purified RNA was eluted into 50 µl of dH2O. Purified RNA was fragmented by incubating with 10 mM ZnCl2 and 20 mM Tris·Cl (pH 7.4) at 60°C for 30 min, yielding an average fragment size of 50 nucleotides (Hughes et al., 2001; Bodrossy et al., 2003). Fragmentation was stopped by the addition of 10 mM EDTA pH 8.0 to the reaction and putting it on ice. RNasin (1 ml 40 U ml−1) (Promega, WI, USA) was added to the fragmented target. Fragmented, labelled RNA targets were stored at −20°C. For each assay, two targets were generated, one with the T3 RNA polymerase (sense) and one with the T7 RNA polymerase (antisense).
Hybridization
Microarrays were not pre‐hybridized. Hybridization was carried out in a custom‐tailored aluminium block used as an insert for a temperature‐controlled Belly Dancer (Stovall Life Sciences, Greensboro, USA) set at maximum bending (about 10°). The hybridization block was pre‐heated to 60°C for at least 30 min to allow the temperature to stabilize. An Eppendorf incubator was also pre‐heated to 65°C. HybriWell (Grace Bio‐Labs, Bend, OR, USA) self‐adhesive hybridization chambers (220 µl in volume) were applied onto the slides containing the arrays. Assembled slides were pre‐heated on top of the hybridization block. For each hybridization, 137 µl of DEPC‐treated water, 2.21 µl of 10% SDS, 4.42 µl of 50× Dennhardt's reagent (Sigma‐Aldrich), 66.9 µl of 20× SSC and 10 µl of target RNA were added into a 1.5 ml Eppendorf tube, centrifuged for 1 min at 13 000 r.p.m. and incubated for 2 min at 65°C. Pre‐heated hybridization mixtures were applied onto assembled slides via the port in the lower position (to minimize risk of air bubbles being trapped within the chamber). Chambers were sealed with seal spots and incubated overnight at 60°C at 30–40 r.p.m. circulation and maximum bending. Following hybridization, HybriWell chambers were removed individually and slides were immersed immediately into 2× SSC, 0.1% (w/v) SDS at room temperature. Slides were washed by shaking at room temperature for 5 min in 2× SSC, 0.1% (w/v) SDS; twice for 5 min in 0.2× SSC and finally for 5 min in 0.1× SSC. Slides were dried individually using an airgun with a cotton wool filter. Slides were stored at room temperature in the dark and scanned the same day. For each assay, two hybridizations were carried out, one with the sense, another one with the antisense target. Sense and antisense RNA targets were not mixed in a single hybridization to avoid the formation of highly stable double‐stranded RNA.
Scanning
Hybridized slides were scanned at three lines to average, 10 mm resolution with a GenePix 4000 A laser scanner (Axon, Foster City, CA, USA) at 532 nm wavelength. Fluorescent images were captured as multilayer tiff images and analysed with the GenePix Pro 6.0 software (Axon).
Data analysis
Microsoft Excel was used for statistical analysis and presentation of results. Results were normalized to positive controls. Reverse complements of the atpD, gyrB and fliC PCR primers were used as positive controls for normalization. The fljB gene is not present in some Salmonella strains. Normalization of very low levels of fljB signals to similarly low signals of positive controls with those strains (i.e. dividing a noise‐level signal with another one) would lead to erroneous and misleading values. Thus the reverse complements of the fliC PCR primers were used as positive controls for the normalization of fljB‐targeting probes as well.
Hybridization signal for each probe was expressed as percentage of the signal (median of background‐corrected signal) of the positive control probes on the same array. Normalized signal intensities of the triplicate spots on a slide were used to determine average results. Normalized signal values lower than 1 were set to 1 for subsequent ratio calculation (to avoid the generation of erroneously high or negative PM/MM ratio values).
Probes were grouped into probe units, consisting of either a standalone probe (i.e. a single probe specific for a given serovar or group of serovars) or of a PM probe and one or several MM probes. Modulated probes (probes where a single mismatch was deliberately introduced to suppress signal with closely related, non‐targeted sequences, while maintaining detectable signal with targeted sequences) were used either as standalone or, in some cases, in combination with MM probes. A probe unit is thus represented by a single probe or a combination of probes, each probe unit being targeted against a defined serovar (or a set of serovars) (Table S1). For each probe unit, results from the applicable hybridization (using sense or antisense target) were considered.
As common to short oligonucleotides, the binding capacity of the probes varied over a range of more than a magnitude. Thus thresholds for positive/negative call were determined individually, based on the results of a thorough validation. A reference value, representing the highest normalized signal obtained during validation with pure cultures, was established for each standalone and PM probe. For probes with low binding capacity (i.e. yielding the highest normalized signal of less than 100), the reference value was artificially set to 100. Normalized signals lower than 20% of these reference values were considered negative and the corresponding probe units were treated accordingly in subsequent steps of data analysis.
For PM/MM probe units a further threshold was established to define positive and negative calls. The threshold was again based on the values obtained during validation with pure cultures, considering the highest real‐positive (HrP) and highest false‐positive (HfP) values for that probe unit (defined as the highest PM/MM ratio obtained for that probe unit with a targeted strain and the highest PM/MM ratio obtained with a non‐targeted strain respectively). The threshold was defined using the following formula:
where a equals HfP or 0.01× HrP (whichever is higher) and b equals HrP. Calculated threshold values are indicated in row 6 of Fig. S2. Values below and above the threshold value were considered negative and positive respectively.
Detection limit determination
From pure cultures. Buffered peptone water (Merck, NJ, USA) medium was inoculated with the strains S. Typhimurium S05917‐03, S. Bredeney S06106‐03, and S. Manhattan S09472‐02 and incubated for 8 h at 37°C. Cell suspension was diluted in ultrapure water to generate 10‐fold dilution series ranging from 106 to 1 cfu ml−1. Aliquots (100 µl) of the dilution of each concentration were plated onto 10% tryptic soil agar (Merck, Darmstadt, Germany) in triplicates and incubated overnight at 37°C. Colony‐forming unit (cfu) values of cell suspensions were determined from the average number of colonies on the three plates.
Purification of DNA was performed from 1 ml of diluted Salmonella culture by using the GenElute Bacterial Genomic DNA kit (Sigma‐Aldrich) according to the manufacturer's instructions. The concentration of the purified DNA was determined by measuring the optical density at 260 nm with a photometer (Nanodrop ND‐1000, Rockland, USA). One microlitre of each dilution was supplied for PCR. Polymerase chain reaction reactions were repeated three times.
From food samples. Tomato and chicken meat samples were minced and spiked with a 10‐fold dilution series of S. Goldcoast strain S06334‐03 and incubated in buffered peptone water (Merck, NJ, USA) at 37°C (Salmonella cells were artificially added to 25 g of samples in 225 ml of medium). Inoculated samples were sampled after 4 h, 8 h and overnight (14 h). DNA was purified as described above. One microlitre of purified DNA from each sample was used as template for PCR. A negative control (unspiked sample) was analysed in parallel with the samples.
Acknowledgments
Work at ARC was supported by the ‘Fonds zur Förderung der wissenschaftlichen Forschung’, Austria (Project No. L70). Funding from the EU towards COST Action 853 (Agricultural Biomarkers for Array Technology) contributed to the results by enhancing the exchange of ideas. L.B. is indebted to Fodor Szilvia for her support and fresh, independent views and ideas.
Supporting Information
Additional Supporting Information may be found in the online version of this article:
Neighbor-joining dendrogram based on concatenated nucleotide sequences of the atpD, gyrB, fliC and fljB genes. Bootstrap values higher, than 50%, from 100 replicates are shown. Positions considered to generate the tree are shown in Table 2. The bar represents 10% evolutionary sequence divergence.
Validation of the microarray with pure cultures (top) and blind samples (bottom). Columns correspond to probe units (see Experimental procedures). The first block contains probes targeting serotypes belonging to S. enterica (I), the second block is composed of probes targeting S. salamae (II), S. arizonae (IIIa), S. diarizonae (IIIb), S. indica (IV), and finally one probe targeting S. bongori (V) and four probes targeting most serovars of S. enterica and bongori. Reference signal values, highest real-positive (HrP) and highest false-positive (HfP) values, obtained with hybridized targets, are indicated (see Experimental procedures). Black fill indicates expected positive results. Black fill with grey numbers (only in the bottom panel) indicates positive results not predicted and thick black framing (only in the bottom panel) indicates negative results where hybridization was predicted. Serovars highlighted in grey in the second part of the table are the corresponding reference strains for the given serovars from the top part, used to illustrate the expected hybridization patterns. The asterisk (*) indicates mixture consisting of equal amounts of serovars Typhimurium, Enteritidis, Dublin, Senftenberg and Virchow.
Set of oligonucleotide probes synthesized and spotted for evaluation. Positions of mismatches and modulation with target sequences are indicated by boldfaced characters and underlined boldfaced characters respectively. Melting temperatures were calculated by the nearest neighbour method.
Sensitivity of detection. Amplification with atpD, gyrB, fliC and fljB primers was more sensitive when purified DNA was used as template. The detection limit was established at 11.2 × 10⁴ cfu of Salmonella, as defined by the least sensitive PCR reaction, the amplification of fliC. Direct PCR with unpurified supernatant of boiled cells exhibited 10- to 100-fold lower sensitivity compared with the PCR performed with purified DNA, resulting in a detection limit of approximately 7.1 × 10⁵ cfu of Salmonella. Polymerase chain reaction amplification of fliC gene with unpurified supernatant of boiled cells was not even possible at a concentration of 7.1 × 10⁸ cfu of Salmonella. This clearly indicated the need for DNA purification before PCR amplification. Following overnight (14 h) enrichment in buffered peptone water, 1 cfu eof Salmonella could be detected from 25 g of spiked food sample (both meat and tomato).
Salmonella strains used in this study. Antigenic formulae were determined by conventional serotyping at the reference laboratories VLA (Veterinary Laboratory Agencies) in the UK, AGES (Österreichische Agentur für Gesundheit und Ernährungssicherheit GmbH) in Austria and NENT (National Centre for Enteropathogenic Bacteria) in Switzerland.
This material is available as part of the online article from http://www.blackwell-synergy.com
Please note: Blackwell Publishing is not responsible for the content or functionality of any supporting information supplied by the authors. Any queries (other than missing material) should be directed to the corresponding author for the article.
References
- Agron P.G., Walker R.L., Kinde H., Sawyer S.J., Hayes D.C., Wollard J., Andersen G.L. Identification by subtractive hybridization of sequences specific for salmonella enterica serovar enteritidis. Appl Environ Microbiol. 2001;67:4984–4991. doi: 10.1128/AEM.67.11.4984-4991.2001. [DOI] [PMC free article] [PubMed] [Google Scholar]
- Beltran P., Musser J.M., Helmuth R., Farmer J.J., III, Frerichs W.M., Wachsmuth I.K. Toward a population genetic analysis of Salmonella: genetic diversity and relationships among strains of serotypes S. choleraesuisS. derbyS. dublinS. enteritidisS. heidelbergS. infantisS. newport, and S. typhimurium. Proc Natl Acad Sci USA. 1988;85:7753–7757. doi: 10.1073/pnas.85.20.7753. et al. [DOI] [PMC free article] [PubMed] [Google Scholar]
- Bodrossy L., Sessitsch A. Oligonucleotide microarrays in microbial diagnostics. Curr Opin Microbiol. 2004;7:245–254. doi: 10.1016/j.mib.2004.04.005. [DOI] [PubMed] [Google Scholar]
- Bodrossy L., Stralis‐Pavese N., Murrell J.C., Radajewski S., Weilharter A., Sessitsch A. Development and validation of a diagnostic microbial microarray for methanotrophs. Environ Microbiol. 2003;5:566–582. doi: 10.1046/j.1462-2920.2003.00450.x. [DOI] [PubMed] [Google Scholar]
- Brenner F.W., Villar R.G., Angulo F.J., Tauxe R., Swaminathan B. Salmonella nomenclature. J Clin Microbiol. 2000;38:2465–2467. doi: 10.1128/jcm.38.7.2465-2467.2000. [DOI] [PMC free article] [PubMed] [Google Scholar]
- Call D.R., Borucki M.K., Loge F.J. Detection of bacterial pathogens in environmental samples using DNA microarrays. J Microbiol Methods. 2003;53:235–243. doi: 10.1016/s0167-7012(03)00027-7. [DOI] [PubMed] [Google Scholar]
- Christensen H., Olsen J.E. Phylogenetic relationships of Salmonella based on DNA sequence comparison of atpD encoding the beta subunit of ATP synthase. FEMS Microbiol Lett. 1998;161:89–96. doi: 10.1111/j.1574-6968.1998.tb12933.x. [DOI] [PubMed] [Google Scholar]
- Dauga C., Zabrovskaia A., Grimont P.A. Restriction fragment length polymorphism analysis of some flagellin genes of Salmonella enterica. J Clin Microbiol. 1998;36:2835–2843. doi: 10.1128/jcm.36.10.2835-2843.1998. [DOI] [PMC free article] [PubMed] [Google Scholar]
- Echeit M.A., Herrera S., Garaizar J., Usera M.A. Multiplex PCR‐based detection and identification of the most common Salmonella second‐phase flagellar antigens. Res Microbiol. 2002;153:107–113. doi: 10.1016/s0923-2508(01)01295-5. [DOI] [PubMed] [Google Scholar]
- Felsenstein J. PHYLIP – Phylogeny Inference Package (Version 3.2) Cladistics. 1989;5:164–166. [Google Scholar]
- Hashsham S.A., Wick L.M., Rouillard J.M., Gulari E., Tiedje J.M. Potential of DNA microarrays for developing parallel detection tools (PDTs) for microorganisms relevant to biodefense and related research needs. Biosens Bioelectron. 2004;20:668–683. doi: 10.1016/j.bios.2004.06.032. [DOI] [PubMed] [Google Scholar]
- Herrera‐Leon S., Ramiro R., Arroyo M., Diez R., Usera M.A., Echeita M.A. Blind comparison of traditional serotyping with three multiplex PCRs for the identification of Salmonella serotypes. Res Microbiol. 2007;158:122–127. doi: 10.1016/j.resmic.2006.09.009. [DOI] [PubMed] [Google Scholar]
- Van Hoek A.H.A., Scholtens I.M.J., Cloeckaert A., Aarts H.J.M. Detection of antibiotic resistance genes in different Salmonella serovars by oligonucleotide microarray analysis. J Microbiol Methods. 2005;62:13–23. doi: 10.1016/j.mimet.2005.01.004. [DOI] [PubMed] [Google Scholar]
- Hughes T.R., Mao M., Jones A.R., Burchard J., Marton M.J., Shannon K.W. Expression profiling using microarrays fabricated by an ink‐jet oligonucleotide synthesizer. Nat Biotechnol. 2001;19:342–347. doi: 10.1038/86730. et al. [DOI] [PubMed] [Google Scholar]
- Kingsley R.A., Baumler A.J. Host adaptation and the emergence of infectious disease: the Salmonella paradigm. Mol Microbiol. 2000;36:1006–1014. doi: 10.1046/j.1365-2958.2000.01907.x. [DOI] [PubMed] [Google Scholar]
- Konstantinidis K.T., Ramette A., Tiedje J.M. Toward a more robust assessment of intraspecies diversity, using fewer genetic markers. Appl Environ Microbiol. 2006;72:7286–7293. doi: 10.1128/AEM.01398-06. [DOI] [PMC free article] [PubMed] [Google Scholar]
- Kotetishvili M., Stine O.C., Kreger A., Morris J.G., Jr, Sulakvelidze A. Multilocus sequence typing for characterization of clinical and environmental Salmonella strains. J Clin Microbiol. 2002;40:1626–1635. doi: 10.1128/JCM.40.5.1626-1635.2002. [DOI] [PMC free article] [PubMed] [Google Scholar]
- Le Minor L., Bockemuhl J. Supplement No. XXVII (1983) to the Kauffmann–White scheme. Ann Microbiol (Paris) 1984;135B:45–51. [PubMed] [Google Scholar]
- Le Minor L., Bockemuhl J. 1987 supplement (no. 31) to the schema of Kauffmann–White. Ann Inst Pasteur Microbiol. 1988;139:331–335. doi: 10.1016/0769-2609(88)90025-7. [DOI] [PubMed] [Google Scholar]
- Li J., Nelson K., McWhorter A.C., Whittam T.S., Selander R.K. Recombinational basis of serovar diversity in Salmonella enterica. Proc Natl Acad Sci USA. 1994;91:2552–2556. doi: 10.1073/pnas.91.7.2552. [DOI] [PMC free article] [PubMed] [Google Scholar]
- Ludwig W., Strunk O., Westram R., Richter L., Meier H., Yadhukumar ARB: a software environment for sequence data. Nucleic Acids Res. 2004;32:1363–1371. doi: 10.1093/nar/gkh293. et al. [DOI] [PMC free article] [PubMed] [Google Scholar]
- McQuiston J.R., Parrenas R., Ortiz‐Rivera M., Gheesling L., Brenner F., Fields P.I. Sequencing and comparative analysis of flagellin genes fliCfljB, and flpA from. J Clin Microbiol. 2004;42:1923–1932. doi: 10.1128/JCM.42.5.1923-1932.2004. , and Salmonella. [DOI] [PMC free article] [PubMed] [Google Scholar]
- Malorny B., Bunge C., Guerra B., Prietz S., Helmuth R. Molecular characterisation of Salmonella strains by an oligonucleotide multiprobe microarray. Mol Cell Probes. 2007;21:56–65. doi: 10.1016/j.mcp.2006.08.005. [DOI] [PubMed] [Google Scholar]
- Mortimer C.K., Peters T.M., Gharbia S.E., Logan J.M., Arnold C. Towards the development of a DNA‐sequence based approach to serotyping of Salmonella enterica. BMC Microbiol. 2004;4:31. doi: 10.1186/1471-2180-4-31. [DOI] [PMC free article] [PubMed] [Google Scholar]
- Pelludat C., Prager R., Tschape H., Rabsch W., Schuchhardt J., Hardt W.D. Pilot study to evaluate microarray hybridization as a tool for Salmonella enterica serovar Typhimurium strain differentiation. J Clin Microbiol. 2005;43:4092–4106. doi: 10.1128/JCM.43.8.4092-4106.2005. [DOI] [PMC free article] [PubMed] [Google Scholar]
- Popoff M.I. Institute Pasteur; 2001. [Google Scholar]
- Popoff M.Y., Bockemuhl J., Brenner F.W. Supplement 1998 (no. 42) to the Kauffmann–White scheme. Res Microbiol. 2000a;151:63–65. doi: 10.1016/s0923-2508(00)00126-1. [DOI] [PubMed] [Google Scholar]
- Popoff M.Y., Bockemuhl J., Brenner F.W. Supplement 1999 (no. 43) to the Kauffmann–White scheme. Res Microbiol. 2000b;151:893–896. doi: 10.1016/s0923-2508(00)01157-8. [DOI] [PubMed] [Google Scholar]
- Popoff M.Y., Bockemuhl J., Gheesling L.L. Supplement 2001 (no. 45) to the Kauffmann–White scheme. Res Microbiol. 2003;154:173–174. doi: 10.1016/S0923-2508(03)00025-1. [DOI] [PubMed] [Google Scholar]
- Porwollik S., Boyd E.F., Choy C., Cheng P., Florea L., Proctor E., McClelland M. Characterization of Salmonella enterica subspecies I genovars by use of microarrays. J Bacteriol. 2004;186:5883–5898. doi: 10.1128/JB.186.17.5883-5898.2004. [DOI] [PMC free article] [PubMed] [Google Scholar]
- Santalucia J., Jr, Allawi H.T., Seneviratne P.A. Improved nearest‐neighbor parameters for predicting DNA duplex stability. Biochemistry. 1996;35:3555–3562. doi: 10.1021/bi951907q. [DOI] [PubMed] [Google Scholar]
- Smith N.H., Beltran P., Selander R.K. Recombination of Salmonella Phase 1 flagelling genes generates new serovars. J Bacteriol. 1990;172:2209–2216. doi: 10.1128/jb.172.5.2209-2216.1990. [DOI] [PMC free article] [PubMed] [Google Scholar]
- Sukhnanand S., Alcaine S., Warnick L.D., Su W.L., Hof J., Craver M.P. DNA sequence‐based subtyping and evolutionary analysis of selected Salmonella enterica serotypes. J Clin Microbiol. 2005;43:3688–3698. doi: 10.1128/JCM.43.8.3688-3698.2005. et al. [DOI] [PMC free article] [PubMed] [Google Scholar]
- Tankouo‐Sandjong B., Sessitsch A., Liebana E., Kornschober C., Allerberger F., Hachler H., Bodrossy L. MLST‐v, multilocus sequence typing based on virulence genes, for molecular typing of Salmonella enterica subsp. enterica serovars. J Microbiol Methods. 2007;69:23–36. doi: 10.1016/j.mimet.2006.11.013. [DOI] [PubMed] [Google Scholar]
- Torpdahl M., Skov M.N., Sandvang D., Baggesen D.L. Genotypic characterization of Salmonella by multilocus sequence typing, pulsed‐field gel electrophoresis and amplified fragment length polymorphism. J Microbiol Methods. 2005;63:173–184. doi: 10.1016/j.mimet.2005.03.006. [DOI] [PubMed] [Google Scholar]
- Wagner M., Smidt H., Loy A., Zhou J. Unravelling microbial communities with DNA‐microarrays: challenges and future directions. Microb Ecol. 2007;53:498–506. doi: 10.1007/s00248-006-9197-7. [DOI] [PubMed] [Google Scholar]
- Wattiau P., Weijers T., Andreoli P., Schliker C., Veken H.V., Maas H.M. Evaluation of the Premi(R)Test Salmonella, a commercial low‐density DNA microarray system intended for routine identification and typing of Salmonella enterica. Int J Food Microbiol. 2008;123(3):293–298. doi: 10.1016/j.ijfoodmicro.2008.01.006. et al. [DOI] [PubMed] [Google Scholar]
- Yoshida C., Franklin K., Konczy P., McQuiston J.R., Fields P.I., Nash J.H. Methodologies towards the development of an oligonucleotide microarray for determination of Salmonella serotypes. J Microbiol Methods. 2007;70(2):261–271. doi: 10.1016/j.mimet.2007.04.018. et al. [DOI] [PubMed] [Google Scholar]
- Zhou J. Microarrays for bacterial detection and microbial community analysis. Curr Opin Microbiol. 2003;6:288–294. doi: 10.1016/s1369-5274(03)00052-3. [DOI] [PubMed] [Google Scholar]
Associated Data
This section collects any data citations, data availability statements, or supplementary materials included in this article.
Supplementary Materials
Neighbor-joining dendrogram based on concatenated nucleotide sequences of the atpD, gyrB, fliC and fljB genes. Bootstrap values higher, than 50%, from 100 replicates are shown. Positions considered to generate the tree are shown in Table 2. The bar represents 10% evolutionary sequence divergence.
Validation of the microarray with pure cultures (top) and blind samples (bottom). Columns correspond to probe units (see Experimental procedures). The first block contains probes targeting serotypes belonging to S. enterica (I), the second block is composed of probes targeting S. salamae (II), S. arizonae (IIIa), S. diarizonae (IIIb), S. indica (IV), and finally one probe targeting S. bongori (V) and four probes targeting most serovars of S. enterica and bongori. Reference signal values, highest real-positive (HrP) and highest false-positive (HfP) values, obtained with hybridized targets, are indicated (see Experimental procedures). Black fill indicates expected positive results. Black fill with grey numbers (only in the bottom panel) indicates positive results not predicted and thick black framing (only in the bottom panel) indicates negative results where hybridization was predicted. Serovars highlighted in grey in the second part of the table are the corresponding reference strains for the given serovars from the top part, used to illustrate the expected hybridization patterns. The asterisk (*) indicates mixture consisting of equal amounts of serovars Typhimurium, Enteritidis, Dublin, Senftenberg and Virchow.
Set of oligonucleotide probes synthesized and spotted for evaluation. Positions of mismatches and modulation with target sequences are indicated by boldfaced characters and underlined boldfaced characters respectively. Melting temperatures were calculated by the nearest neighbour method.
Sensitivity of detection. Amplification with atpD, gyrB, fliC and fljB primers was more sensitive when purified DNA was used as template. The detection limit was established at 11.2 × 10⁴ cfu of Salmonella, as defined by the least sensitive PCR reaction, the amplification of fliC. Direct PCR with unpurified supernatant of boiled cells exhibited 10- to 100-fold lower sensitivity compared with the PCR performed with purified DNA, resulting in a detection limit of approximately 7.1 × 10⁵ cfu of Salmonella. Polymerase chain reaction amplification of fliC gene with unpurified supernatant of boiled cells was not even possible at a concentration of 7.1 × 10⁸ cfu of Salmonella. This clearly indicated the need for DNA purification before PCR amplification. Following overnight (14 h) enrichment in buffered peptone water, 1 cfu eof Salmonella could be detected from 25 g of spiked food sample (both meat and tomato).
Salmonella strains used in this study. Antigenic formulae were determined by conventional serotyping at the reference laboratories VLA (Veterinary Laboratory Agencies) in the UK, AGES (Österreichische Agentur für Gesundheit und Ernährungssicherheit GmbH) in Austria and NENT (National Centre for Enteropathogenic Bacteria) in Switzerland.