

Summary
Nisin A is the best known and most extensively characterized lantibiotic. As it is ribosomally synthesized, bioengineering‐based strategies can be used to generate variants. We have previously demonstrated that bioengineering of the hinge region of nisin A can result in the generation of variants with enhanced anti‐microbial activity against Gram‐positive pathogens. Here we created a larger bank of hinge variant producers and screened for producers that exhibit enhanced bioactivity as assessed by agar‐based assays against a selection of target strains. Further analysis of 12 ‘lead’ variants reveals that in many cases enhanced bioactivity is not attributable to enhanced specific activity but is instead as a consequence of an enhanced ability to diffuse through complex polymers. In the case of two variants, which contain the residues SVA and NAK, respectively, within the hinge region, we demonstrate that this enhanced trait enables the peptides to dramatically outperform nisin A with respect to controlling Listeria monocytogenes in commercially produced chocolate milk that contains carrageenan as a stabilizer.
Introduction
Nisin A is a 3.4 kDa anti‐microbial peptide produced by many strains of Lactococcus lactis (Lubelski et al., 2008; de Juarez et al., 2009). As a lantibiotic, nisin undergoes significant post‐translational modification crucial to the development of its unique structure and potent antibacterial activity (Cotter et al., 2005a; Lubelski et al., 2008). There are at least five naturally occurring variants of nisin A. These are nisin Z (Mulders et al., 1991), Q (Zendo et al., 2003), F (de Kwaadsteniet et al., 2008), U and U2 (Wirawan et al., 2006), although the description of nisin U and U2 as variants is the subject of some debate (Piper et al., 2010).
As a result of their gene encoded nature, lantibiotics, including nisin A and nisin Z, have been the focus of bioengineering with a view to elucidating structure function relationships (Cotter et al., 2005b; Lubelski et al., 2008; Cortés et al., 2009; Field et al., 2010b). In recent years, there has been further progress, resulting in the identification of changes that significantly improve specific activity against target cells (Cortés et al., 2009; Field et al., 2010b). While some enhancements have related to rings A and B of the peptide (Fig. 1; Rink et al., 2007), the majority of enhanced peptides have resulted as a consequence of manipulation of the hinge region. The hinge comprises residues 20 (Asn), 21 (Met) and 22 (Lys) (Fig. 1), which are thought to permit the movement of the N‐ and C‐termini relative to one another during pore formation. The first success in this regard related to the creation of nisin derivatives, N20K and M21K, with enhanced anti‐microbial activity against Gram‐negatives (Yuan et al., 2004). Subsequent investigations have further highlighted the benefits of manipulating the hinge and finally resulted in the identification of nisin derivatives, such as nisin N20P, M21V, K22T and K22S, which possess enhanced specific activity against Gram‐positive pathogens (Field et al., 2008). Indeed, the enhanced specific activity of nisin M21V (or nisin V) against a wide range of food and clinical Gram‐positive pathogens has been highlighted (Field et al., 2010a).
Figure 1.
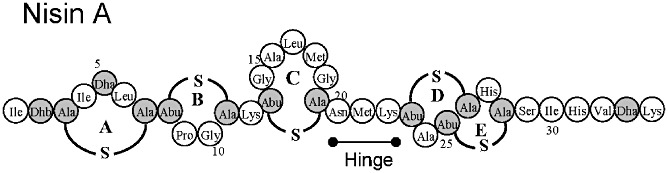
Structure of nisin A. Modified residues are in grey. Ala‐S‐Ala, Lanthionine; Abu‐S‐Ala, β‐methyllanthionine; Dha, dehydroalanine; Dhb, dehydrobutyrine. (β‐methyl)lanthionine rings are labelled A–E. The location of the hinge region, consisting of Asn‐Met‐Lys, is also indicated.
It should also be noted that, while there has been a particular focus on the identification of nisins with enhanced specific activity in recent years, bioengineering has the potential to also generate peptides that are enhanced in other ways, such as possessing increased stability or solubility (Rollema et al., 1995). Here, we carry out a more comprehensive bioengineering of the nisin hinge, through the implementation of saturation mutagenesis at multiple locations, with a view to identifying additional derivatives with enhanced features.
Results
Further mutagenesis of the nisin A hinge
Previously, NNK scanning of the individual residues within the hinge region of nisin A (which naturally consists of the residues Asn‐Met‐Lys) resulted in the identification of amino acid substitutions that bestowed improved specific activity on the resultant peptides compared with the wild‐type equivalent. The most notable of the bioengineered peptides created were those in which respective N20P, M21V and K22T changes had been made (Field et al., 2008). In a bid to further explore the flexibility of the hinge region, we initiated a second round of bioengineering of these enhanced derivatives. To this end, the previously created ‘enhanced’ derivatives were used as the starting point for further saturation mutagenesis of the nisA gene, i.e. randomization of two of the residues within the hinge region while retaining the existing, beneficial alteration. Thus, three separate banks of nisin producing variants were made, which were designated the N20PXX, XM21VX and XXK22T banks (where X is any amino acid). The PCR‐based mutagenesis approach adopted was carried out successfully in all cases and the modified nisin genes were introduced into L. lactis NZ9800, a strain capable of producing the corresponding modified peptides.
Identification of enhanced variants by deferred antagonism assay
The newly created banks of nisin hinge variant producers, as well as 49 variant producers created previously (Field et al., 2008), were screened to identify those with enhanced anti‐microbial activity relative to L. lactis NZ9700. After screening, 12 ‘lead’ nisin variants, other than N20P, M21V and K22T, were selected on the basis of their activity. Activity was assessed by deferred antagonism anti‐microbial activity assays against Streptococcus mitis UCC5001, Streptococcus agalactiae ATCC 13813, L. lactis HP, L. lactis UCC90 and Listeria monocytogenes UCC35. DNA sequencing, followed by confirmation by mass spectrometric confirmation, revealed that the variants contained the following three amino acid residues within their hinge region: NMA, NMV, NMG, NAK, NGK, SVA, GVK, PTL, PAL, HLT, PMC and PMQ (Table 1) and the results from the deferred antagonism assays are presented in Table 2. These reveal that three variant producers (NMA, SVA and NAK) exhibited enhanced bioactivity against all five indicators, one variant producers (NMV) exhibited enhanced bioactivity against four of the indicators, five (NGK, NMG, PMQ, PMC and GVK) exhibited enhanced bioactivity against three of the indicators, two (PTL and PLT) exhibited enhanced bioactivity against two of the indicators and the activity of HLT was enhanced against S. mitis UCC5001 only (Table 2).
Table 1.
Sequence and molecular mass (as determined by mass spectrometry) of enhanced nisin variants
| Nisin variant | MW (Da) |
|---|---|
| NMA (K22A) | 3295.24 |
| NMV (K22V) | 3324.23 |
| NMG (K22G) | 3280.88 |
| NAK (M21A) | 3292.50 |
| NGK (M21G) | 3278.70 |
| GVK | 3262.89 |
| SVA | 3235.84 |
| PTL | 3289.92 |
| PAL | 3259.90 |
| PMC | 3309.99 |
| PMQ | 3335.58 |
| HLT | 3329.94 |
Table 2.
Deferred antagonism agar diffusion based assessment of the bioactivity of the producers of nisin A and nisin variants
| Variant | S. mitis UCC5001 (mm) | S. agalactiae ATCC 13813 (mm) | L. lactis HP (mm) | L. lactis 90869 (mm) | L. monocytogenes UCC35 (mm) |
|---|---|---|---|---|---|
| Nisin A | 9 ± 0.32 | 14.1 ± 0.60 | 17 ± 0.27 | 7.5 ± 0.38 | 12.1 ± 0.57 |
| NMA | 15 ± 0.80 | 18.5 ± 0.50 | 22 ± 0.70 | 13.1 ± 0.81 | 15.7. ± 0.49 |
| NMV | 17 ± 0.95 | 17.1 ± 0.26 | 20.5 ± 0.50 | 6.5 ± 0.15 | 14.7 ± 1.59 |
| NMG | 18.5 ± 0.46 | 18.5 ± 0.55 | 21 ± 0.83 | 8.7 ± 0.75 | 11.9 ± 2.32 |
| NGK | 18 ± 0.06 | 18.4 ± 0.88 | 18.5 ± 0.26 | 6.5 ± 0.15 | 12.1 ± 1.53 |
| NAK | 16.5 ± 0.57 | 18 ± 0.55 | 22.2 ± 1.04 | 11.1 ± 0.82 | 17.4 ± 0.75 |
| PAL | 16.7 ± 0.61 | 12.1 ± 0.26 | 15 ± 1.30 | 11.5 ± 0.65 | 12.1 ± 0.93 |
| PMQ | 16 ± 0.90 | 13 ± 0.17 | 20 ± 0.93 | 8.5 ± 0.25 | 11.8 ± 0.87 |
| PTL | 11 ± 0.26 | 11 ± 0.55 | 18 ± 0.17 | 6.5 ± 0.06 | 7.6 ± 0.36 |
| PMC | 18 ± 0.06 | 15.4 ± 0.05 | 20 ± 0.35 | 11 ± 0.15 | 9.4 ± 1.63 |
| HLT | 10.5 ± 0.11 | 15.2 ± 0.60 | 18 ± 0.95 | 6.9 ± 0.15 | 11.3 ± 0.70 |
| GVK | 12 ± 0.65 | 11 ± 0.25 | 21 ± 0.38 | 9 ± 0.70 | 10.7 ± 0.60 |
| SVA | 14.3 ± 0.40 | 17.1 ± 0.80 | 18 ± 0.38 | 13.1 ± 0.85 | 14.5 ± 0.40 |
Values correspond to diameter of zone of inhibition and are the average of triplicate experiments. Zones significantly enhanced (P < 0.05) relative to those generated by the nisin A producer are in bold.
Minimum inhibitory concentration (MIC) determinations
Deferred antagonism agar diffusion assays are valuable with respect to rapidly assessing the bioactivity of a strain. However, bioactivity is the result of a combination of factors including the specific activity of the peptide, the levels at which it is produced and, in the case of agar‐based assays, its ability to diffuse through agar. In order to determine the basis for the enhanced anti‐microbial activity of the 12 nisin variant producers, the corresponding peptides were each purified to facilitate specific activity determination through broth‐based MIC assays. The five indicator strains previously employed for agar‐based deferred antagonism assays were again used for MIC assays. Surprisingly, and in contrast with the enhanced specific activity of a number of the other peptides previously identified following agar‐based assays (Field et al., 2010b), few of the 12 variants demonstrated enhanced specific activity in broth (Table 3). Indeed, only the NMA, NMV and SVA peptides exhibited enhanced specific activity against any of the targets. NMA exhibited enhanced specific activity against S. agalactiae ATCC13813 and L. lactis UCC90, NMV was enhanced against L. lactis UCC90 and SVA was enhanced against both L. lactis targets (Table 3). However, even in the case of these three peptides, the previously noted enhanced bioactivity against certain targets was not always matched by enhanced specific activity in broth against the same indicators. Of particular note was the fact that none of the peptides exhibited enhanced specific activity against L. monocytogenes UCC35.
Table 3.
Broth‐based MICs of nisin A and nisin variants
| Variant | S. mitis UCC5001 | S. agalactiae ATCC13813 | L. lactis HP | L. lactis UCC90 | L. monocytogenes UCC35 |
|---|---|---|---|---|---|
| mg l−1 (µM) | mg l−1 (µM) | mg l−1 (µM) | mg l−1 (µM) | mg l−1 (µM) | |
| Nisin A | 12.57 (3.75) | 1.57 (0.467) | 0.196 (0.058) | 0.392 (0.117) | 25.14 (7.5) |
| NMA | 12.57 (3.75) | 0.785 (0.234) | 0.196 (0.058) | 0.196 (0.058) | >25.14 (>7.5) |
| NMV | 25.14 (7.5) | 1.57 (0.467) | 0.196 (0.058) | 0.196 (0.058) | >25.14 (>7.5) |
| NMG | 25.14 (7.5) | 3.14 (0.935) | 0.196 (0.058) | 0.392 (0.117) | >25.14 (>7.5) |
| NGK | 25.14 (7.5) | 1.57 (0.467) | 1.57 (0.467) | 0.785 (0.234) | 25.14 (7.5) |
| NAK | 25.14 (7.5) | 1.57 (0.467) | 0.196 (0.058) | 0.392 (0.117) | >25.14 (>7.5) |
| PAL | 25.14 (7.5) | 6.28 (1.87) | 0.392 (0.117) | 0.392 (0.117) | >25.14 (>7.5) |
| PMQ | 12.57 (3.75) | 6.28 (1.87) | 0.196 (0.058) | 0.392 (0.117) | >25.14 (>7.5) |
| PTL | 25.14 (7.5) | 6.28 (1.87) | 0.392 (0.117) | 1.57 (0.467) | >25.14 (>7.5) |
| PMC | 12.57 (3.75) | 6.28 (1.87) | 0.196 (0.058) | 0.785 (0.234) | >25.14 (>7.5) |
| HLT | 12.57 (3.75) | 1.57 (0.467) | 0.196 (0.058) | 0.785 (0.234) | 25.14 (7.5) |
| GVK | 25.14 (7.5) | 3.14 (0.935) | 0.392 (0.117) | 0.785 (0.234) | >25.14 (>7.5) |
| SVA | 12.57 (3.75) | 1.57 (0.467) | 0.049 (0.014) | 0.196 (0.058) | >25.14 (>7.5) |
Values enhanced relative to those generated by the nisin A producer are in bold. All results are the average of triplicate data (which in each case was identical).
Agar and carrageenan‐based assays with purified peptide
Further investigations were carried out with a view to determining the basis for the enhanced bioactivity of the 12 variant producers. An alternative explanation for enhanced bioactivity, as determined by deferred antagonism agar diffusion studies, is that the peptides could possess an enhanced ability to diffuse through complex matrices such as agar. To test this hypothesis the activity of equimolar concentrations of purified nisin A and nisin variant peptides against L. monocytogenes UCC35 was instead assayed by means of an agar‐based assay (Table 4). With the exception of PLT and PAL, all other variants produced zones of inhibition that were significantly larger than those produced by nisin A. It is thus apparent that some of the variant producers exhibit enhanced bioactivity as a consequence of enhanced activity in agar.
Table 4.
Agar and Carrageenan‐based assessments of the activity of nisin A and variants against L. monocytogenes UCC 35
| Variant | Agar | Carrageenan |
|---|---|---|
| Nisin A | 7.9 ± 0.11 | 8.2 ± 0.21 |
| NMA | 8.1 ± 0.17 | 8.1 ± 0.06 |
| NMV | 9.3 ± 0.06 | 9.2 ± 0.11 |
| NMG | 8.9 ± 0.15 | 8.5 ± 0.06 |
| NGK | 8.7 ± 0.11 | 8.6 ± 0.15 |
| NAK | 9.2 ± 0.26 | 9.2 ± 0.21 |
| PAL | 7.8 ± 0.06 | 7.7 ± 0.15 |
| PMQ | 8.3 ± 0.15 | 8.3 ± 0.10 |
| PTL | 7.6 ± 0.15 | 7.8 ± 0.10 |
| PMC | 8.3 ± 0.15 | 8.5 ± 0.21 |
| HLT | 8.5 ± 0.10 | 8.9 ± 0.11 |
| GVK | 8.3 ± 0.15 | 8.6 ± 0.06 |
| SVA | 9.0 ± 0.15 | 9.0 ± 0.15 |
Values correspond to diameter of zone of inhibition and are the average of triplicate experiments. Zones significantly enhanced (P < 0.05) relative to those generated by the nisin A producer are in bold.
To investigate if the peptides that display an enhanced ability to diffuse through agar can also diffuse more successfully through other complex polymer matrices, carrageenan‐based assays were carried out. Carrageenan is a polysaccharide extracted from seaweed, which is used in food as a gelling agent. When carrageenan was employed instead of agar in well assays, using L. monocytogenes UCC35 as an indicator, NAK, HLT and SVA produced significantly larger zones of inhibition than those generated by nisin A in this matrix (Table 4).
Chocolate milk investigations
To determine if enhanced anti‐microbial activity in carrageenan translated to enhanced activity in a carrageenan‐containing food, the relative ability of SVA, NAK and nisin A (all at 20 µg ml−1) to control L. monocytogenes UCC35 in a commercially available chocolate milk product, which already contains carrageenan as a stabilizer, was assessed. These variants were selected as these were the only two variants that were found to exhibit enhanced anti‐microbial activity against UCC35 in all agar and carrageenan‐based studies (Tables 2 and 4). In all cases it was noted that the presence of the nisin variants had a rapid impact on the pathogen, in that immediate plating to determine pathogen levels revealed decreases in numbers of UCC35 relative to the amount of the pathogen added.
When added to chocolate milk spiked with 105 cfu ml−1L. monocytogenes UCC35 and stored at 22°C (i.e. representative of a temperature abuse scenario), the level of the pathogen present after 24 h was almost 3 log units lower in the SVA‐containing milk than in the nisin A‐containing milk. A more modest, but significant, difference was also apparent after 48 h (Fig. 2). The corresponding study with NAK established that this variant also significantly reduced pathogen levels at several time points (Fig. 2).
Figure 2.
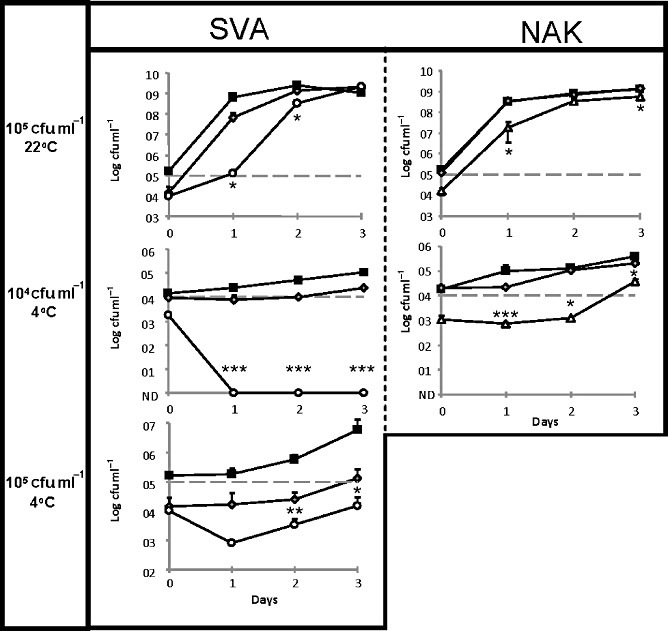
Impact of nisin A (grey diamonds) and the nisin variants, SVA (white circle) and NAK (white triangle), relative to a non‐nisin‐containing control (black squares) on the growth/survival of L. monocytogenes UCC 35 (spiked at a level of 105 cfu ml−1 or 104 cfu ml−1) in chocolate milk at 22°C and 4°C. Data points are the average of triplicate experiments. Asterix indicate significant differences (*P < 0.05, **P < 0.005, **P < 0.001; two‐tailed Student t‐test) in UCC 35 numbers between the variant and nisin A‐treated samples (ND, not detected).
The benefits of incorporating the nisin variants were more apparent when the chocolate milk was stored at 4°C. In situations where the milk was spiked with 104 cfu ml−1L. monocytogenes UCC35, the pathogen could not be detected on days 1–3 of the trial, whereas UCC35 numbers increased gradually in the nisin A‐containing and non‐nisin‐containing controls. Although not as dramatic, Nisin NAK also provided significantly enhanced protection relative to the controls in these circumstances. Finally, the significantly enhanced protection provided by SVA, relative to the nisin A‐containing and non‐nisin‐containing controls at 4°C, was also apparent at multiple time points when the milk was spiked with L. monocytogenes UCC35 at 105 cfu ml−1 (Fig. 2). Notably, the enhanced ability of the variants to control UCC35 occurred despite the fact that these peptides did not display enhanced activity when assessed through broth‐based MIC assays.
Discussion
It has become apparent in recent years that, as a consequence of the gene‐encoded nature of nisin A, the creation of enhanced peptides is a very realistic goal. This study was initiated to build on previous investigations that highlighted the merits of bioengineering the ‘hinge’ region of nisin A (Field et al., 2008; 2010a) but differed in that the collection of nisin variant producers screened was expanded considerably to include strains producing peptides in which one or more of the hinge residues were randomized. Screening of this bank using the deferred antagonism agar‐based assay revealed hundreds of producers that exhibited enhanced bioactivity against at least one target strain. Although only 12 strains were selected for further investigation on the basis of enhanced bioactivity against multiple strains, it is anticipated that this extended bank of variant producers will prove to be a valuable resource in the future with respect to the identification of variants with enhanced anti‐microbial activity against specific targets or with other desirable traits. Broth‐based investigations with purified peptide revealed that relatively few of the peptides possessed enhanced specific activity against the selection of strains employed. This prompted further assays, which revealed that enhanced bioactivity in agar was in many cases as a consequence of the enhanced ability of the associated peptide to act in complex matrices. In addition to the initial implementation of an agar‐based screening, the selection of such peptides was probably as a consequence of the focus on identifying peptides with enhanced bioactivity against multiple targets. It should be noted, however, that the previous use of such an approach did result in the identification of peptides with enhanced specific activity against multiple targets (Field et al., 2008; 2010a; Carroll et al., 2010).
Agar is a favourable matrix for molecular diffusion owing to its negative charge and disorganized structure compared with other polymers like agarose (which has a dense structure and neutral charge) (Sebti et al., 2004; Carnet‐Ripoche et al., 2006). To determine if the enhanced ability to diffuse through agar also translated to enhanced ability to diffuse through another polymer matrix, carrageenan was employed. In addition to being a polysaccharide similar to agar and which has the same negative charge, carrageenan‐based assays were also deemed to be of value due to its frequent use in foods. It was established that the peptides exhibited enhanced ability in carrageenan‐based assays. While this was evident from assays involving carrageenan coupled with laboratory media, more importantly, SVA and NAK also showed an enhanced ability to control L. monocytogenes in a carrageenan‐containing food. The ability of these peptides to control the pathogen in chocolate milk is particularly notable as a chocolate milk product has previously been associated with outbreaks of listeriosis (Proctor et al., 1995; Dalton et al., 1997). Given that carrageenan is an ingredient of many foods, including processed meats, dairy products, low‐fat products, desserts and UHT milk, the use of SVA and/or NAK as an alternative to nisin A in such foods should be considered in the future. For the same reason, further investigations to assess the protection provided by such variants in foods containing similar structural polymers such as pectin, gelatin, guar gum and other polysaccharides, will be carried out in the future.
Experimental procedures
Bacterial cultures and strains
The bacterial strains and plasmids used in this study are listed in Table 5. Lactococcus lactis NZ9800 harbouring the plasmid pCI372‐nisA (pDF05), or a derivative thereof, were grown in M17 broth (Oxoid) supplemented with 0.5% glucose (GM17) and chloramphenicol (10 µg ml−1). The nisin A producing strain, NZ9700, was grown in GM17 broth at 30°C. Lactococcus lactis indicator strains were grown at 30°C in GM17 broth or GM17 agar. Listeria monocytogenes strains were grown at 37°C in brain heart infusion broth and agar (Oxoid). Streptococci were grown at 37°C in tryptic soy broth and tryptic soy broth agar (Merck). Solid media were prepared by the addition of 1.5% agar to the appropriate broth, or 0.75% agar in the case of overlay media. Anaerobic conditions were established using Anaerocult A gas packs (Merck). Serial dilutions were prepared using sterile quarter strength Ringers solution (Merck). All cultures used in this study were stored as frozen stocks in 40% glycerol at −20°C or −80°C and were propagated twice in broth for 16 h before experimental use.
Table 5.
Strains used in this study
| Strains | Characteristic | Reference |
|---|---|---|
| Nisin producing strains | ||
| NZ9700 | Wildtype nisin A producer | Kuipers et al. (1993) |
| NZ9800pDF05 | NZ9700ΔnisA pCI372‐nisA | Field et al. (2008) |
| Indicators | ||
| Streptococcus mitis UCC5001 | Nisin sensitive indicator | UCC culture collection |
| Lactococcus lactis UCC90 | Nisin sensitive indicator | UCC culture collection |
| Lactococcus lactis HP | Nisin sensitive indicator | UCC culture collection |
| Listeria monocytogenes UCC35 | Nisin tolerant indicator | UCC culture collection |
| Streptococcus agalactiae ATCC13813 | Nisin sensitive indicator | American Type Culture Collection |
Isolation of enhanced nisin variants
Banks of producers of nisin hinge variants were generated by saturation and combinatorial saturation/site‐directed mutagenesis as previously described (Field et al., 2008). Three banks of variants in which each of the three residues in the hinge were randomized, respectively, have been generated previously (Field et al., 2008). Simultaneous saturation mutagenesis of two of the three hinge residues was carried out using pDF05 as template and using oligonucleotides designed to introduce a specific codon change (i.e. N20P or M21V or K22T) in combination with an NNK codon (site‐saturation; N = GATC and K = GT) at the two other locations (Table 6). PCR amplification was performed in a 50 µl reaction containing approximately 0.5 ng of target DNA (pDF05), 1 unit Phusion High‐Fidelity DNA polymerase (Finnzymes, Finland), 1 mM dNTPs and 500 ng each of the appropriate forward and reverse oligonucleotide. The reaction was preheated at 98°C for 2 min, and then incubated for 29 cycles at 98°C for 30 s, 55°C for 15 s and 72°C for 3 min 30 s, and then finished by incubating at 72°C for 3 min 30 s. Amplified products were treated with DpnI (Stratagene) for 60 min at 37°C to digest template DNA and purified using the QIAquick PCR purification kit. Following transformation of Escherichia coli Top 10 cells, plasmid DNA was isolated and sequenced using the primers pCI372 For and pCI372 Rev to verify that mutagenesis had taken place. Engineered plasmid DNA was then introduced into L. lactis NZ9800 by electroporation (Holo and Nes, 1995) to generate banks of nisin variant producers.
Table 6.
Oligonucleotides used in this study
| Primer name | Sequence |
|---|---|
| N20PXX For | 5′ TG ATG GGT TGT CCT NNK NNK ACA GCA ACT TGT CAT TGT AGT 3′ |
| N20PXX Rev | 5′ CA AGT TGC TGT MNN MNN AGG ACA ACC CAT CAG AGC TCC TGT 3′ |
| XM21VX For | 5′ TG ATG GGT TGT NNK GTT NNK ACA GCA ACT TGT CAT TGT AGT 3′ |
| XM21VX Rev | 5′ CA AGT TGC TGT MNN CAA MNN ACA ACC CAT CAG AGC TCC TGT 3′ |
| XXK22T For | 5′ TG ATG GGT TGT NNK NNK ACT ACA GCA ACT TGT CAT TGT AGT 3′ |
| XXK22T Rev | 5′ CA AGT TGC TGT AGT MNN MNN ACA ACC CAT CAG AGC TCC TGT 3′ |
| pCI372FOR | 5′ CGG GAA GCT AGA GTA AGT AG 3′ |
| pCI372REV | 5′ ACC TCT CGG TTA TGA GTT AG 3′ |
Deferred antagonism activity assays
Banks of nisin derivative producers were screened to identify strains exhibiting enhanced bioactivity relative to NZ9700, the wild‐type nisin A producer (which has a level of activity corresponding to that of NZ9800 pCI372 nisA), using the agar overlay assay. Strains from the banks were spotted (5 µl) on GM17 agar and incubated at 30°C for 16 h. All spots were irradiated under UV light for 15 min before being overlaid with soft agar seeded with 1% of the indicator culture and incubated at the appropriate temperature overnight. Zones of clearing in the indicator lawn were measured in diameter and the diameter of the bacterial spot subtracted from this measurement.
Identification of changes occurring in nisin variants
Nisin variant producers of interest were streaked onto GM17 agar before being subjected to colony mass spectrometric analysis as described previously (Field et al., 2008) with an Axima TOF2 mass spectrometer (Shimadzu Biotech, Manchester, UK) and analysed in positive‐ion reflectron mode. The DNA sequence of variant nisA genes was also determined. To facilitate this, plasmid DNA was isolated from overnight cultures of the nisin variant producers of interest using the QIAprep Spin Miniprep kit (Qiagen, Gmbh, Hilden, Germany), following an initial treatment of the lactococcal cells with lysis buffer (Anderson and McKay, 1983), The purified plasmid served as a template for the amplification of the variant nisA gene by PCR as described by Field et al., 2008. PCR products were purified using the QIAquik Purification Kit (Qiagen, Hilden, Germany) and DNA sequencing reactions were performed by MWG Biotech, Germany.
Purification of nisin hinge variants
The nisin A producing strain, L. lactis NZ9700, or the producers of hinge variants, were subcultured (1%) into 2 l tryptone yeast broth and incubated overnight at 30°C. The culture was then centrifuged at 7000 r.p.m. for 15 min and both the cell pellet and supernatant were retained. The culture supernatant was passed through 60 g beads (Amberlite XAD16; Sigma‐Aldrich Chemie, Steinheim, Germany), prewashed with 1 l of distilled H2O. The column was washed with 500 ml of 30% ethanol and the bacteriocin was eluted in 500 ml of 70% isopropanol 0.1% TFA. The cell pellet was resuspended in 300 ml of 70% isopropanol 0.1% TFA and stirred at room temperature for approximately 3 h. This was then centrifuged at 7000 r.p.m. for 15 min and the supernatant retained. The cell pellet and supernatant preparations were combined and underwent rotary evaporation using a Buchi, Postfach (Switzerland) before being applied to a 10 g (60 ml) Phenomenex SPE C‐18 column pre‐equilibrated with methanol (60 ml) and then water (60 ml). Six millilitres of the final preparation was concentrated to 2 ml by rotary evaporation and this was subsequently applied to a Phenomenex C12 reverse phase (RP)‐HPLC column (Jupiter 4 µ proteo 90 Å, 250 × 10.0 mm) previously equilibrated with 25% acetonitrile, 0.1% TFA. The column was developed in a gradient of 30–50% acetonitrile containing 0.1% TFA. Fractions containing the anti‐microbial peptide were pooled and lyophilized following rotary evaporation of acetonitrile. For mass spectrometric analysis, purified peptide was resuspended in 70% isopropanol and the molecular mass was determined using an Axima TOF2 mass spectrometer (Shimadzu Biotech, Manchester, UK).
Minimum inhibitory concentration determination
Minimum inhibitory concentration assays were completed in 96‐well microtitre plates as described by Wiedemann et al. (Wiedemann et al., 2006) and performed in triplicate. Before peptide was added, the plates were treated with 1% BSA in 200 µl of PBS and incubated at 37°C for 30 min. The solution was then removed and the plates washed with 200 µl PBS before being air dried in a laminar flow hood. Serial twofold dilutions of the peptide were made in the appropriate medium, at a starting concentration of 7.5 µM. Indicator strains grown overnight were subcultured and grown to OD600 0.5 before being diluted to give a final inoculum of 105 cfu ml−1 in 200 µl. The plates were incubated under the following conditions: 16 h at 30°C for L. lactis HP and L. lactis UCC90 and 16h at 37°C for S. mitis UCC5001, S. agalactiae ATCC13813 and L. monocytogenes UCC35. The MIC value was recorded as the lowest peptide concentration required for inhibition of visible growth.
Agar and carrageenan‐based assays with purified peptide
To assess specific activity in agar and carrageenan‐based matrices, the relevant matrix was added to GM17 broth at a concentration of 1.5% and, after autoclaving, was inoculated with 0.2% L. monocytogenes UCC35 before being poured. Wells were generated in the solidified media, into which the purified nisin A and nisin variants were added. The plates were incubated at 37°C for 16 h after which time the zone of inhibition was recorded. Results represent the average of triplicate experiments.
Chocolate milk studies
A commercially available chocolate milk product, which contains carrageenan, was streaked on Listeria Selective Agar (LSA) (Oxoid) to check for the presence of Listeria. An overnight culture of L. monocytogenes UCC35 was diluted and inoculated into the chocolate milk at a final concentration of 104 or 105 cfu ml−1. To this, nisin or a nisin variant was added at a concentration of 20 µg ml−1. Chocolate milk, to which only the pathogen was added or to which neither pathogen nor peptide was introduced, served as a control. The milk was incubated at 4°C or 22°C and assessed over 3 days (including one reading immediately after the introduction of the pathogen). Pathogen levels were determined through serial dilution and plating on LSA. Experiments were carried out in triplicate.
References
- Anderson D.G., McKay L.L. Simple and rapid method for isolating large plasmid DNA from lactic streptococci. Appl Environ Microbiol. 1983;46:549–552. doi: 10.1128/aem.46.3.549-552.1983. [DOI] [PMC free article] [PubMed] [Google Scholar]
- Carnet‐Ripoche A., Chollet E., Peyrol E., Sebti I. Evaluation of nisin diffusion in a polysaccharide gel: influence of agarose and fatty content. Innov Food Sci Emerg Technol. 2006;7:107–111. [Google Scholar]
- Carroll J., Field D., O'Connor P.M., Cotter P.D., Coffey A., Hill C. Gene encoded antimicrobial peptides, a template for the design of novel anti‐mycobacterial drugs. Bioeng Bugs. 2010;1:408–412. doi: 10.4161/bbug.1.6.13642. et al. [DOI] [PMC free article] [PubMed] [Google Scholar]
- Cortés J., Appleyard A.N., Dawson M.J. Chapter 22. Whole‐cell generation of lantibiotic variants. Methods Enzymol. 2009;458:559–574. doi: 10.1016/S0076-6879(09)04822-8. [DOI] [PubMed] [Google Scholar]
- Cotter P.D., Hill C., Ross R.P. Bacteriocins: developing innate immunity for food. Nat Rev Microbiol. 2005a;3:777–788. doi: 10.1038/nrmicro1273. [DOI] [PubMed] [Google Scholar]
- Cotter P.D., Hill C., Ross R.P. Bacterial lantibiotics: strategies to improve therapeutic potential. Curr Protein Pept Sci. 2005b;6:61–75. doi: 10.2174/1389203053027584. [DOI] [PubMed] [Google Scholar]
- Dalton C.B., Austin C.C., Sobel J., Hayes P.S., Bibb W.F., Graves L.M. An outbreak of gastroenteritis and fever due to Listeria monocytogenes in milk. N Engl J Med. 1997;336:100–105. doi: 10.1056/NEJM199701093360204. et al. [DOI] [PubMed] [Google Scholar]
- Field D., O'Connor P.M., Cotter P.D., Hill C., Ross R.P. The generation of nisin variants with enhanced activity against specific Gram‐positive pathogens. Mol Microbiol. 2008;69:218–230. doi: 10.1111/j.1365-2958.2008.06279.x. [DOI] [PubMed] [Google Scholar]
- Field D., Quigley L., O'Connor P.M., Rea M.C., Daly K., Cotter P.D. Studies with bioengineered Nisin peptides highlight the broad spectrum potency of Nisin V. Microb Biotechnol. 2010a;3:473–486. doi: 10.1111/j.1751-7915.2010.00184.x. et al. [DOI] [PMC free article] [PubMed] [Google Scholar]
- Field D., Hill C., Cotter P.D., Ross R.P. The dawning of a ‘Golden era’ in lantibiotic bioengineering. Mol Microbiol. 2010b;78:1077–1087. doi: 10.1111/j.1365-2958.2010.07406.x. [DOI] [PubMed] [Google Scholar]
- Holo H., Nes I.F. Transformation of Lactococcus by electroporation. Methods Mol Biol. 1995;47:195–199. doi: 10.1385/0-89603-310-4:195. [DOI] [PubMed] [Google Scholar]
- de Juarez L.J., Jozala A.F., Mazzola P.G., Penna T.C.V. Nisin biotechnological production and application: a review. Trends Food Sci Technol. 2009;20:146–154. [Google Scholar]
- Kuipers O.P., Beerthuyzen M.M., Siezen R.J., De Vos W.M. Characterization of the nisin gene cluster nis‐ABTCIPR of Lactococcus lactis. Requirement of expression of the nisA and nisI genes for development of immunity. Eur J Biochem. 1993;216:281–291. doi: 10.1111/j.1432-1033.1993.tb18143.x. [DOI] [PubMed] [Google Scholar]
- de Kwaadsteniet M., ten Doeschate K., Dicks L.M.T. Characterization of the structural gene encoding nisin F, a new lantibiotic produced by a Lactococcus lactis subsp. lactis isolate from freshwater catfish (Clarias gariepinus. Appl Environ Microbiol. 2008;74:547–549. doi: 10.1128/AEM.01862-07. [DOI] [PMC free article] [PubMed] [Google Scholar]
- Lubelski J., Rink R., Khusainov R., Moll G.N., Kuipers O.P. Biosynthesis, immunity, regulation, mode of action and engineering of the model lantibiotic nisin. Cell Mol Life Sci. 2008;65:455–476. doi: 10.1007/s00018-007-7171-2. [DOI] [PMC free article] [PubMed] [Google Scholar]
- Mulders J.W.M., Boerrigter I.J., Rollema H.S., Siezen R.J., de Vos W.M. Identification and characterization of the lantibiotic nisin Z, a natural nisin variant. Eur J Biochem. 1991;201:581–584. doi: 10.1111/j.1432-1033.1991.tb16317.x. [DOI] [PubMed] [Google Scholar]
- Piper C., Hill C., Cotter P.D., Ross R.P. Bioengineering of a Nisin A‐producing Lactococcus lactis to create isogenic strains producing the natural variants Nisin F, Q and Z. Microb Biotechnol. 2010;4:375–382. doi: 10.1111/j.1751-7915.2010.00207.x. [DOI] [PMC free article] [PubMed] [Google Scholar]
- Proctor M.E., Brosch R., Mellen J.W., Garrett L.A., Kaspar C.W., Luchansky J.B. Use of pulsed‐field gel electrophoresis to link sporadic cases of invasive listeriosis with recalled chocolate milk. Appl Environ Microbiol. 1995;61:3177–3179. doi: 10.1128/aem.61.8.3177-3179.1995. [DOI] [PMC free article] [PubMed] [Google Scholar]
- Rink R., Wierenga J., Kuipers A., Kluskens L.D., Driessen A.J., Kuipers O.P., Moll G.N. Dissection and modulation of the four distinct activities of nisin by mutagenesis of rings A and B and by C‐terminal truncation. Appl Environ Microbiol. 2007;73:5809–5816. doi: 10.1128/AEM.01104-07. [DOI] [PMC free article] [PubMed] [Google Scholar]
- Rollema H.S., Kuipers O.P., Both P., de Vos W.M., Siezen R.J. Improvement of solubility and stability of the antimicrobial peptide nisin Z by protein engineering. Appl Environ Microbiol. 1995;61:2873–2878. doi: 10.1128/aem.61.8.2873-2878.1995. [DOI] [PMC free article] [PubMed] [Google Scholar]
- Sebti I., Blanc D., Carnet‐Ripoche A., Saurel R., Coma V. Experimental study and modeling of nisin diffusion in agarose gels. J Food Eng. 2004;63:185–190. [Google Scholar]
- Wiedemann I., Bottiger T., Bonelli R.R., Wiese A., Hagge S.O., Gutsmann T. The mode of action of the lantibiotic lacticin 3147‐ a complex mechanism involving specific interaction of two peptides and the cell wall precursor lipid II. Mol Microbiol. 2006;61:285–296. doi: 10.1111/j.1365-2958.2006.05223.x. et al. [DOI] [PubMed] [Google Scholar]
- Wirawan R.E., Klesse N.A., Jack R.W., Tagg J.R. Molecular and genetic characterization of a novel nisin variant produced by Streptococcus uberis. Appl Environ Microbiol. 2006;72:1148–1156. doi: 10.1128/AEM.72.2.1148-1156.2006. [DOI] [PMC free article] [PubMed] [Google Scholar]
- Yuan J., Zhang Z.Z., Chen X.Z., Yang W., Huan L.D. Site‐directed mutagenesis of the hinge region of nisin Z and properties of nisin Z mutants. Appl Microbiol Biotechnol. 2004;64:806–815. doi: 10.1007/s00253-004-1599-1. [DOI] [PubMed] [Google Scholar]
- Zendo T., Fukao M., Ueda K., Higuchi T., Nakayama J., Sonomoto K. Identification of the lantibiotic nisin Q, a new natural nisin variant produced by Lactococcus lactis 61‐14 isolated from a river in Japan. Biosci, Biotechnol, Biochem. 2003;67:1616–1619. doi: 10.1271/bbb.67.1616. [DOI] [PubMed] [Google Scholar]