

Summary
Overproduction of microbial metabolites is related to developmental phases of microorganisms. Inducers, effectors, inhibitors and various signal molecules play a role in different types of overproduction. Biosynthesis of enzymes catalysing metabolic reactions in microbial cells is controlled by well‐known positive and negative mechanisms, e.g. induction, nutritional regulation (carbon or nitrogen source regulation), feedback regulation, etc. The microbial production of primary metabolites contributes significantly to the quality of life. Fermentative production of these compounds is still an important goal of modern biotechnology. Through fermentation, microorganisms growing on inexpensive carbon and nitrogen sources produce valuable products such as amino acids, nucleotides, organic acids and vitamins which can be added to food to enhance its flavour, or increase its nutritive values. The contribution of microorganisms goes well beyond the food and health industries with the renewed interest in solvent fermentations. Microorganisms have the potential to provide many petroleum‐derived products as well as the ethanol necessary for liquid fuel. Additional applications of primary metabolites lie in their impact as precursors of many pharmaceutical compounds. The roles of primary metabolites and the microbes which produce them will certainly increase in importance as time goes on. In the early years of fermentation processes, development of producing strains initially depended on classical strain breeding involving repeated random mutations, each followed by screening or selection. More recently, methods of molecular genetics have been used for the overproduction of primary metabolic products. The development of modern tools of molecular biology enabled more rational approaches for strain improvement. Techniques of transcriptome, proteome and metabolome analysis, as well as metabolic flux analysis. have recently been introduced in order to identify new and important target genes and to quantify metabolic activities necessary for further strain improvement.
1. Introduction
Primary metabolites are microbial products made during the exponential phase of growth whose synthesis is an integral part of the normal growth process. They include intermediates and end‐products of anabolic metabolism, which are used by the cell as building blocks for essential macromolecules (e.g. amino acids, nucleotides) or are converted to coenzymes (e.g. vitamins). Other primary metabolites (e.g. citric acid, acetic acid and ethanol) result from catabolic metabolism; they are not used for building cellular constituents but their production, which is related to energy production and substrate utilization, is essential for growth. Industrially, the most important primary metabolites are amino acids, nucleotides, vitamins, solvents and organic acids. These are made by a diverse range of bacteria and fungi and have numerous uses in the food, chemical and nutriceutical industries. Many of these metabolites are manufactured by microbial fermentation rather than chemical synthesis because the fermentations are economically competitive and produce biologically useful isomeric forms. Several other industrially important chemicals could be manufactured via microbial fermentations (e.g. glycerol and other polyhydroxy alcohols) but are presently synthesized cheaply as petroleum by‐products. However, as the cost of petroleum has skyrocketed recently, there is now renewed interest in the microbial production of ethanol, organic acids and solvents.
Living cells derive energy through metabolism employing reduction and oxidation (redox) reactions (Garcia‐Vallve, 2004). The oxidation of carbon sources, e.g. glucose, and the transfer of electrons involve two paths: biosynthesis and energy metabolism. Only a small part of the electrons are used in reduction reactions to supply new cellular material (i.e. biosynthesis). Most are passed to terminal electron acceptors either directly or via a pathway of redox reactions. Terminal electron acceptors are necessary to maintain a redox balance in the cell. In aerobes, oxygen is the ultimate electron acceptor yielding water as product. For the anaerobes, a large number of acceptors are used producing many products (alcohols, fatty acids, H2). Anaerobes cannot synthesize an O2‐linked energy conversion system and thus cannot use O2 as the terminal electron acceptor. They also show a wide range of sensitivity to oxygen, some being killed by exposure to even traces of O2.
Bacteria such as streptococci and clostridia have no respiratory chain but possess complexes of integral membrane proteins and freely diffusible molecules that shuttle electrons from one complex to the next. Thus, the reducing equivalents that are produced by carbon source catabolism cannot be reoxidized by oxygen or nitrate, i.e. external electron acceptors. Instead, organic intermediates of catabolism (like fumarate or succinate) are used and the reduced products are excreted. These are the primary metabolites of such cultures.
2. Regulation of primary metabolism
Microbial metabolism is a conservative process that usually does not expend energy or nutrients to make compounds already available in the environment, and does not overproduce components of intermediary metabolism. Coordination of metabolic functions ensures that, at any given moment, only the necessary enzymes, and the correct amount of each, are made. Once a sufficient quantity of a material is made, the enzymes concerned with its formation are no longer synthesized and the activities of preformed enzymes are curbed by a number of specific regulatory mechanisms such as feedback inhibition.
Transcription is the principal site for control of bacterial and eukaryotic expression and is dependent on transcription factors, i.e. proteins which bind near or at promoters, thus activating or repressing transcription initiation in response to extracellular signals. To initiate transcription in bacteria, RNA polymerase must associate with a particular sigma factor (σ). Sigma factors are small proteins that direct RNA polymerase to specific classes of promoter sequences (Woesten, 1998). In most bacteria, sigma A or sigma D, also known as sigma 70 (the major ‘housekeeping’ sigma factor) controls the major housekeeping functions and most RNA synthesis in the growth phase. However, there are additional sigma factors, which recognize different consensus sequences. These sigma factors not only allow the cell to carry out basal gene expression and exponential growth but also to respond to developmental or environmental signals. The number of sigma factors depends on the bacteria; thus Escherichia coli makes seven sigma factors whereas Bacillus subtilis makes seventeen. There are also anti‐sigma factors which bind to and inhibit sigma factor function, thus preventing the interaction of the latter with RNA polymerases. There are even anti‐anti‐sigma factors, which are antagonists of anti‐sigma factors (Mittenhuber, 2002). A wide range of cellular processes are regulated by anti‐sigma factors, including bacteriophage growth, sporulation, stress response, flagellar biosynthesis, pigment production, ion transport and virulence expression.
The primary control of gene expression in eukaryotes is also at the level of transcription and is exerted by transcription factors. While prokaryotic transcription factors bind close to the gene to be transcribed, eukaryotic transcription factors often bind hundreds or thousands of base pairs upstream of the gene. Upstream of about 80% of eukaryotic genes is the TATA box (i.e. TATA is part of the sequence), which binds one type of transcription factor. Transcription factors include (i) helix–turn–helix structures, (ii) zinc fingers, (iii) leucine zippers, (iv) helix–loop–helix structures and (v) high‐mobility groups as their binding mechanism. After binding to DNA, the factors interact with other factors or with RNA polymerase itself to modulate transcription either in the positive direction [transcription activation (the usual case)] or in the negative direction (transcription repression). The interaction is a function of other domains in the transcription factor, which have a high concentration of acidic amino acids, glutamine residues or proline residues. Transcription repression usually occurs when a repressive transcription factor binds to DNA and blocks the attachment or action of activating transcription factors. Control of the transcription factor itself occurs by regulating its activity by protein–protein interaction, phosphorylation or glycosylation.
RNA polymerase catalyses the sequential addition of ribonucleotides using the bases of one strand of DNA as template at a rate of 43 bases s−1 (Richardson, 1993). The elongation process is very stable requiring termination signals at the end of a gene or operon to prevent transcription of neighbouring genes. Sometimes, proteins such as rho factor are required for termination of certain elongation processes. Termination is also important in attenuation control and antitermination. In attenuation, a terminator sequence is present in the leader region forming a termination structure in the mRNA and preventing transcription of the gene or operon (e.g. tryptophan in the case of the intrinsic terminator trpA). As a result, the terminator structure in the mRNA is not formed and the gene or operon is transcribed. This is often the case in amino acid biosynthetic operons. In anti‐termination, a terminator is present but under certain conditions, it can be bypassed, thus allowing transcription. These terminators are upstream of the first gene of an operon and/or between genes of an operon. Often, the first gene of an operon encodes a regulatory RNA‐binding protein, which binds to the terminator structure in mRNA and interferes with termination. Control of the operon is carried out by a metabolic signal such as an inducer.
2.1 Regulatory mechanisms involved in the biosynthesis of primary metabolites
2.1.1 Induction. This is a control mechanism by which a substrate (or a compound structurally similar to the substrate, or a metabolically related compound) ‘turns on’ the synthesis of enzymes, which are usually involved in the degradation of the substrate. Enzymes that are synthesized as a result of genes being turned on are called inducible enzymes and the chemical that activates gene transcription is called the inducer. Inducible enzymes are produced only in response to the presence of their substrate and, in a sense, are produced only when needed. In this way, the cell does not waste energy synthesizing unneeded enzymes. The inducer molecule combines with a repressor at the DNA level and thereby prevents the blocking of an operator by the repressor, leading to the transcription of the gene and translation of the messenger RNA encoding the enzyme. Although most inducers are substrates of catabolic enzymes, products can sometimes function as inducers. As examples, malto‐dextrins can induce amylase, fatty acids induce lipase, urocanic acid induces histidase, and galacturonic acid induces polygalacturonase. Some coenzymes induce enzymes, as in thiamine induction of pyruvate decarboxylase. Substrate analogues that are not attacked by the enzyme (‘gratuitous inducers’) are often excellent inducers of enzyme synthesis.
The most thoroughly studied inducible enzyme system is that for lactose hydrolysis in E. coli, which provided the basis of a model system for negative control of protein synthesis (Jacob and Monod, 1961). Negative control means that a regulatory protein encoded by a regulator locus interferes with transcription. In the case of the lac operon in E. coli, about 10 molecules of repressor are made per regulator locus. The operator locus of the lac operon is 27 base pairs long. The lac repressor is a tetramer protein with a molecular mass of 150 000 containing 347 amino acid residues. In Pseudomonas putida, tryptophan synthetase is induced by indoleglycerophosphate and the entire tryptophan branch is induced by chorismate in B. subtilis.
Positive regulation of transcription by the regulator locus is another type of control mechanism. Here, the regulatory protein encoded by the regulator gene is necessary for transcription to occur. Binding of the inducer activates this regulatory protein. The complex binds at the operator region and turns on gene expression. Positive control occurs in E. coli for utilization of l‐rhamnose, maltose and arabinose. Another induction system involving positive control is galactose utilization in Saccharomyces cerevisiae. The system consists of seven genes and no operons. Five of the pathway genes are regulated by galactose but not gal5 (encoding phosphoglucomutase), which is constitutive. The system involves four different chromosomes. The GAL4 protein transcriptionally activates the other five genes. The GAL80 protein binds directly to GAL4 preventing its activating function. The inducer, formed from galactose by the seventh gene, gal3, inactivates GAL80 thus allowing GAL4 to activate transcription of the five pathway genes. Induction in filamentous fungi such as Aspergillus nidulans is mainly of the positive control type.
2.1.2 Carbon source regulation. Like enzyme induction, carbon source regulation [more commonly known as carbon catabolite repression (CCR)] is one of the conservative mechanisms which safeguards against wasting a cell's protein‐synthesizing machinery, and operates when more than one utilizable substrate is present in the environment. The cell produces enzymes to catabolize the most rapidly assimilated carbon source while synthesis of enzymes utilizing other substrates is repressed until the primary substrate is exhausted. The repressed enzymes are usually inducible. Carbon catabolite repression is a phenomenon usually caused by glucose, but in different organisms, other rapidly metabolized carbon sources can cause repression and, indeed, sometimes repress catabolism of glucose. An example of this occurs in Pseudomonas aeruginosa, where citrate is the preferred carbon source over glucose (Ng and Dawes, 1973). In Pseudomonas, there are up to five overlapping CCR systems coordinating carbon utilization (Rojo and Dinamarca, 2004) and even different CCR systems modulate catabolite repression simultaneously (Del Castillo and Ramos, 2007).
Several mechanisms for CCR have been reported in microorganisms. One involves the phosphoenolpyruvate:phosphotransferase system (PTS) which utilizes a protein phosphoryl transfer chain to transport and phosphorylate its sugar substrates.
In E. coli, PTS consist of four high‐energy phosphoprotein intermediates and five protein domains. One of these proteins, EIIAglc, is phosphorylated by a heat‐stable phosphoprotein (HPr). In this form, EIIAglc∼P transfers its phosphate to high‐affinity protein EIIB/C. For this purpose, EIIAglc contains two histidines (His75 and His90). His90 is the acceptor for the phosphate group from HPr and His75 is important for its transfer to a high‐affinity enzyme IIB/C. Enzyme IIB/C occurs in the membrane as a homodimer. The amino acid chain of domain IIC crosses the membrane eight times harbouring the sugar binding site. The hydrophilic domain IIB transfers the phosphate group from EIIAglc∼P to the glucose, producing glucose 6‐phosphate.
Besides transferring the phosphate group, EIIAglc∼P activates adenylate cyclase. Activated adenylate cyclase synthesizes cyclic 3′,5′‐adenosine monophosphate (cAMP), which has been defined as a second messenger. This nucleotide is necessary for synthesis of inducible enzymes and its intracellular levels mediate carbon catabolite repression. To activate transcription, cAMP binds to the DNA promoter region via a specific binding protein (cAMP receptor protein or CRP), a dimer of identical subunits and two separate domains. Each CRP subunit finds one cAMP molecule and after binding, undergoes an allosteric transition to an active state in which it binds to specific portions of promoter DNA. The N‐terminal attaches to cAMP and the C‐terminal to DNA thus increasing the affinity of RNA polymerase to that particular promoter and thus the frequency of transcription (Botsford and Harman, 1992). The consensus sequence to which CRP binds in the presence of cAMP [aa‐TGTGA(N7)CACa‐t] occurs at a variety of locations in the promoter relative to the start site for transcription (Gottesman, 1984). As promoters of different operons have different affinities for the complex (Piovant et al., 1975), not all promoters are binding the complex and undergoing transcription initiation at the same time. In the presence of glucose, the sugar is transported into the cell and concomitantly phosphorylated. This event causes dephosphorylation of EIIAglc∼P, mediates inducer exclusion and deactivates adenylate cyclase (Stewart, 1993). Inactivation of adenylate cyclase causes the cytoplasmic cAMP concentration to diminish and promotes dissociation of the cAMP–CRP complex from the DNA and deactivation of transcriptional initiation. In its phosphorylated form (no glucose present), EIIAglc has no activity to exclude inducers and activates adenylate cyclase (De Reuse and Danchin, 1991). The gene for EIIAglc is called crr, because mutants of E. coli lacking this gene are not subject to CCR.
During glucose assimilation, the intracellular concentration of cAMP is depressed 1000‐fold, whereas metabolism of a non‐repressive carbon source has little effect on cAMP levels. cAMP reverses CCR of many enzymes in E. coli. Mutants that cannot make CRP or adenylate cyclase fail to grow, or grow poorly, on lactose, glycerol and other carbon sources, whereas mutants lacking cAMP phosphodiesterase (which degrades cAMP to AMP) are insensitive to CCR (Monard et al., 1969). Transport systems known to inhibit adenylate cyclase include those of the PTS (glucose, mannitol), proton symport (lactose) and facilitated diffusion (glycerol). Protein kinase in E. coli is independent of cAMP (Dadssi and Cozzone, 1985).
Carbon catabolite repression occurs in other organisms such as Bacillus species, P. aeruginosa, Arthrobacter crystallopoietes, Rhizobium meliloti and anaerobic bacteria, e.g. Bacteroides fragilis. However, in some of these microorganisms, cAMP has not been detected, nor has it been shown to play a role in CCR. cAMP was found in B. subtilis but only when grown with oxygen limitation (Mach et al., 1984). Adenylate cyclase and phosphodiesterase were also found under these conditions. cAMP was found in Bacillus circulans but only in media rich in glucose. Furthermore, its addition repressed the formation of xylanase (inducible) and 1,3,β‐d‐glucanases as did glucose (Esteban et al., 1984). It appears that cAMP is a negative effector in this strain. Other strains of B. circulans and other Bacillus species (megaterium and cereus) do not contain cAMP.
In Gram‐positive bacteria, carbon source utilization is regulated by carbon catabolite repression. Most of the knowledge on this regulatory mechanism has been obtained with B. subtilis. Here, CCR is due to a complex of two proteins acting at a cis‐acting locus, upstream of catabolite repressible genes (Hueck and Hillen, 1995). The two proteins are a PTS‐carrier protein (Hpr) and a catabolite control protein A (CcpA). It is known that uptake of a rapidly utilized sugar is effected by the PTS. Uptake leads to a build‐up of glycolytic intermediates, which results in phosphorylation of protein HPr at Ser‐46. The catalyst is an ATP‐dependent protein kinase activated by fructose‐1,6‐diphosphate and other glycolytic intermediates. The phosphorylated HPr interacts with CcpA before binding, as a specific ternary complex, to the cis‐active operator DNA sequence called cre, present in the promoter or the 5′ region of at least 29 genes, thus interfering with their expression. The complex consists of two molecules of HPr(Ser‐P), a CcpA dimer and the cre sequence (Reizer and Reizer, 1996; Jones et al., 1997). CcpA is composed of a helix–turn–helix DNA‐binding domain and a C‐terminal domain which binds to HPr(Ser‐P) but not to unphosphorylated HPr. It causes repression of a number of enzymes such as α‐amylase, gluconate kinase, β‐glucanase, glucitol dehydrogenase, lichenase, mannitol‐1‐phosphate dehydrogenase and mannitol‐specific PTS permease. In addition, it affects several operons like the xylose operon, the gluconate operon and the histidine‐utilization operon. When glucose is low, a phosphatase inactivates Hpr(Ser‐P) by dephosphorylation and carbon catabolite repression is relieved. Transcriptional profiling of B. subtilis in response to glucose revealed that: (i) the transcriptional regulator CcpA represses genes involving utilization of secondary carbon sources, (ii) glucose induces glycolytic enzymes, the genes involved in conversion of pyruvate to acetate with concomitant phosphorylation, and (iii) excess glucose represses genes required for complete oxidation of glucose [i.e. those of the tricarboxylic acid (TCA) cycle, and terminal respiration] (Blencke et al., 2003). Pentose phosphate cycle genes are unaffected by glucose.
In S. cerevisiae, cAMP is not thought to be a mediator of carbon catabolite repression (Eraso and Gancedo, 1984). In this yeast, glucose repression is mediated by both hexokinases (P1 and P2) but not by glucokinase. Hexokinase PII appears to be the repressor protein of glucose repression in Saccharomyces carlsbergensis, an organism which has three hexokinases (hexokinase PI and PII and glucokinase). Mutants in hexokinase PII are resistant to CCR of α‐glucosidase and invertase. High glucose leads to increased hexokinase PII whereas glucose limitation leads to decreased hexokinase PII. Addition of xylose to high glucose led to 98% inactivation of hexokinase PII and derepression of invertase (Fernandez et al., 1985).
It is doubtful that cAMP plays any role in carbon catabolite repression in molds such as A. nidulans (Arst and Bailey, 1977). The gene for carbon catabolic repression in A. nidulans and Aspergillus niger is creA (Drysdale et al., 1993). It encodes a DNA‐binding protein with two zinc‐finger domains of the C2H2 class. The sequence 5′‐SYGGRG‐3′ has been proposed as the DNA consensus for Cre‐A binding (Cubero and Scazzochio, 1994). A similar protein, Cre1, mediates glucose repression in Trichoderma reesei (Strauss et al., 1995). Similarity in amino acid sequence is 55% between Cre1 and CreA. The DNA sequence to which CreA binds is 5′‐GCGGAG‐3′ which matches well with the sequence of the above CreA binding site. These genes act by positive control. Genes creB and creC, possibly encoding membrane proteins, are also involved in carbon source regulation in A. nidulans in that their mutation leads to carbon source derepression of carbon controlled enzymes (Hynes and Kelly, 1977).
2.1.3 Nitrogen source regulation. Nitrogen can be assimilated from inorganic or organic sources. Its assimilation from inorganic sources requires reduction to ammonia, followed by incorporation into intracellular metabolites. The appropriate distribution of nitrogen among various pathways usually involves specific or local regulatory mechanisms, such as end‐product inhibition or end‐product‐mediated transcriptional control. In addition, some global regulators control the expression of genes from several pathways and thereby coordinate metabolism. The ability to assimilate particular inorganic or organic nitrogen sources depends on the particular organism. Organic nitrogen sources are usually monomeric units of macromolecules (e.g. amino acids or nucleobases) or compounds derived from them (e.g. agmatine or putrescine). Ammonia usually supports the fastest growth rate and is therefore considered the preferred nitrogen source for E. coli. The biochemical basis of this ‘ammonium preference’ is explained by the repression of enzymes acting on the alternative nitrogenous substrates present in the culture medium. Nitrogen source regulation (NSR) is known by many other names such as nitrogen metabolite repression, nitrogen catabolite repression and ammonia repression. Enzymes typically under such control are proteases, amidases, ureases and those that degrade amino acids.
Key enzymes that are involved in the mechanism of NSR are those of ammonium assimilation such as NADP‐glutamate dehydrogenase (GDH), glutamine synthetase (GS or GSI), glutamate synthase (GOGAT) and alanine dehydrogenase (ADH). It appears that they are not involved as regulatory proteins but simply as catalytic proteins; in the latter case, the pool sizes of one or more substrates and/or products of these enzymes, e.g. glutamine, glutamate or alanine, are critical in bringing about repression. In enteric organisms, the two enzymes which mainly account for NH3 incorporation are: (i) GSI and (ii) GOGAT. They constitute a single system whereby GSI converts glutamate and NH3 to glutamine and GOGAT converts one mole of glutamine and one mole of α‐ketoglutarate to two moles of glutamate. The overall reaction produces glutamate from α‐ketoglutarate and NH3. GSI contains 12 identical subunits. GSI from enteric organisms and streptomycetes are post‐translationally modified by adenylylation but those from Bacillus and Clostridium are not. The most active form of GSI is the unmodified form. The least active contains an adenylate molecule on each subunit. Nitrogen sufficiency leads to adenylylation whereas nitrogen deficiency leads to deadenylylation. Adenylylation is catalysed by adenylyl transferase (ATase). Adenylylation by ATase is promoted by deuridylated PII which is produced by UR action on PII(UMP)3 under nitrogen sufficiency (high glutamine/α‐ketoglutarate ratio). Deadenylylation by ATase is promoted by PII(UMP)3 formed by UTase action on PII under nitrogen limitation (low glutamine/α‐ketoglutarate ratio).
A regulatory gene (glnG) in E. coli and other enteric bacteria encodes nitrogen regulator I (NRI), a dimer protein with a subunit weight of 54 000. NRI is produced at a high level (90 molecules per cell) under nitrogen limitation and at a low level (5 molecules per cell) under nitrogen excess. It activates transcription of glnA, encoding glutamine synthetase, under nitrogen limitation and represses it under conditions of excess nitrogen. NRI binds to DNA at or near the promoter of glnA and is thought to regulate production of all nitrogen‐regulated systems (Shiau et al., 1992). Furthermore in enteric organisms, glutamine synthetase and the other enzymes are regulated in positive and negative directions by three genes (ntrA, ntrB, ntrC). Two of these, ntrB and ntrC, are located next to the glutamine synthetase structural gene; ntrA is at a distance. NtrA is a sigma factor also known as RpoN or σ54 (Elderkin et al., 2005). The nitrogen regulation (ntr) system in enteric bacteria is responsible for activation of the glutamine synthetase operon (glnAntrBC), the uptake systems for glutamine (glnHPQ), arginine (argT) and histidine (hisJQMP), nitrate and nitrite assimilation (nasFEDCBA), and nitrogen fixation (nifLA). The system is complex (Merrick and Edwards, 1995) and responds to the sufficiency or limitation of the intracellular nitrogen pool. It is composed of four proteins: (i) response regulator NtrC, (ii) sensor histidine protein kinase NtrB, (iii) PII, a small protein encoded by glnB, and (iv) uridyltransferase/uridyl‐removing enzyme (Utase/UR) encoded by glnD (Fig. 1). For nitrogen‐controlled genes to be turned on, they need phosphorylated NtrC. NtrC is the response regulator of the signal transduction system; NtrB is its partner sensor kinase. In its phosphorylated state (NtrC‐P), it activates transcription of the nitrogen‐regulated genes. It binds to DNA having a helix–turn–helix motif in its C‐terminal domain. NtrB, the sensor protein kinase, catalyses its own phosphorylation and then NtrC phosphorylation under conditions of nitrogen deficiency. On the contrary, NtrC dephosphorylation occurs under nitrogen sufficiency. NtrB is cytoplasmic and dephosphorylates NtrC‐P only when it interacts with protein PII and can only phosphorylate NtrC when it interacts with PII(UMP)3. Protein PII can either be in its native state (PII) or its uridylated state [PII(UMP)3]. The uridylation reaction is carried out by Utase under conditions of nitrogen deficiency. The deuridylation reaction is catalysed by UR under conditions of nitrogen sufficiency. This uridylation/deuridylation system responds to the glutamine/α‐ketoglutarate ratio. Low ratios indicate nitrogen limitation leading to PII‐uridylation and hence NtrC‐P, whereas high ratios indicate nitrogen sufficiency leading to PII deuridylation and NtrC.
Figure 1.
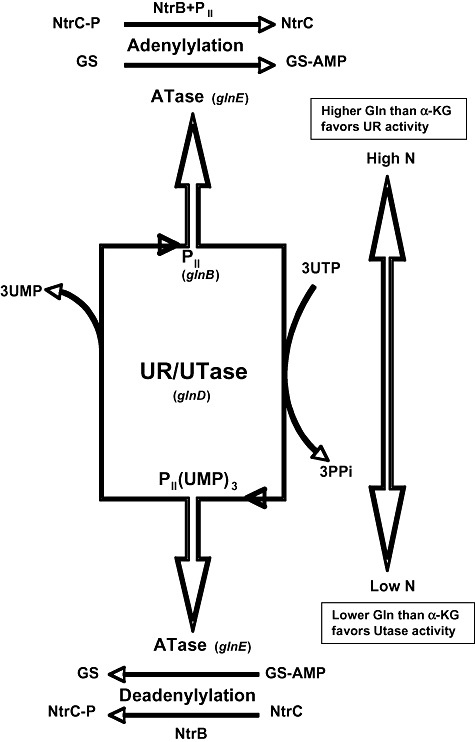
Schematic model for the regulation of the GS activities and NtrC protein in response to nitrogen status. UTase (glnD product) catalyses the uridylylation of PII (glnB product). UR activity of UTase catalyses PII deuridylylation. Adenyltransferase (Atase: glnE product) catalyses the adenylylation and deadenylylation of GS. NtrB protein kinase catalyses the phosphorylation and dephosphorylation of NtrC, a DNA‐binding response regulator.
In P. aeruginosa, glutamine appears to be the effector of nitrogen source repression. In a GS‐negative mutant, urease and histidase are derepressed when growth was limited for glutamine; addition of ammonia or glutamate has no effect. Addition of glutamine does cause repression of these two enzymes as well as NADP‐GDH (Janssen et al., 1981). In B. subtilis, there are two transcriptional regulators of nitrogen metabolism, GlnR and TnrA (Fisher, 1999). They are very similar proteins, binding to the same DNA consensus sequence but are active under different nutritional growth conditions. The activities of both proteins are regulated by GS. In the case of TnrA, the regulation involves a protein–protein interaction. TnrA is active only under conditions of nitrogen limitation. In nitrogen excess, TnrA becomes bound to the feedback inhibited form of GS and is unable to bind to DNA. When nitrogen becomes limiting, TnrA is released and can then bind to DNA. Gene glnA is part of a glnRA operon. Expression of glnRA is repressed by GlnR in media with high nitrogen (Fisher and Sonenshein, 1991). GlnR is small (125 residues) and dimeric, and binds to two operators upstream of glnRA to inhibit transcription (Gutowski and Schrier, 1992). Enzymes under N control are glutamine synthetase I, aspartase, asparaginase, urease, GABA permease but only GSI is regulated by GlnR; an unknown system(s) must regulate the others.
Nitrogen regulation in the yeast S. cerevisiae involves three main elements: (i) the enzymes catalysing the synthesis and interconversion of nitrogenous compounds, (ii) the permeases for uptake of nitrogenous compounds, and (iii) the transcription factors and membrane trafficking proteins which control the activity of the enzymes and permeases (Magasanik and Kaiser, 2002). Preferred nitrogen sources are glutamine, asparagine; those non‐preferred are proline, α‐aminobutyrate, ornithine, allantoin and urea. The expression of nitrogen‐regulated genes is activated by transcription factors Gln3p and Ni11p with intracellular glutamine and glutamate acting as signals preventing such activation.
The gene controlling NSR in Aspergillus is areA (Marzluff, 1981) named Nre (for nitrogen regulator) in other fungi. The gene encodes a regulatory protein (AREA) exerting positive control on transcription. The regulatory protein is active under conditions of derepression (e.g. low ammonium supply). The intracellular effector appears to be glutamine rather than ammonia but more work is needed on this point. Mutations can be of the type areAr in which a large variety of nitrogen sources can no longer be utilized for growth and the enzymes catalysing their usage cannot be derepressed, or another type, areAd in which they cannot be repressed by ammonia; all still require inducer. Some areAd type mutants produce more enzyme than their parents. There has been considerable controversy as to whether protein elements such as NADP‐GDH or GS also play a direct role but, at present, the data favour glutamine itself as being the master effector in fungi. Glutamine produced in the presence of high ammonium, in some unknown fashion, causes nitrogen metabolite repression. Glutamine does not appear to bind directly to the AREA protein. In Aspergillus, factor NMR‐A (similar to NMR found previously in Neurospora) acts negatively. Upon ammonium limitation, glutamine concentration would drop, the regulatory protein would assume an active conformation, and bind at the recognition sites of the structural genes. Nitrogen sources that are more repressive than ammonia are probably more easily converted to glutamine; that is, they may not have to be converted to ammonia before exerting repression. The stability of the AREA mRNA is controlled. It turns over rapidly during conditions of nitrogen repression but is more stable when nitrogen sources are limiting.
In Neurospora crassa, NSR is exerted by ammonium, glutamine and glutamate. Ammonium and glutamate may act via glutamine formation. These compounds repress the formation of the nit‐2 gene product which acts as a positive control agent for use of poorer nitrogen sources, i.e. the nit‐2 gene product is a positive effector for expression of structural genes encoding enzymes involved in the utilization of secondary nitrogen sources. One such repressible enzyme is an extracellular l‐amino acid deaminase. Its expression requires inducer (one of many amino acids), lifting of nitrogen metabolite repression and the presence of the nit‐2 gene product. Glutamine does not appear to act directly to repress nit‐2. Instead, another gene, nmr‐1, binds to two regions of NIT2 and inhibits its function. NMR is not believed to be activated directly by glutamine, but another, still unknown, factor must bind glutamine and lead to nitrogen repression. Thus, mutations of nmr‐1 allow production of these enzymes in the presence of glutamine, NH4 or glutamate (DeBusk and Ogilvie, 1984). In addition to the positively acting nit‐2 nitrogen control gene of N. crassa, a negatively acting nmr control gene exists. Unlike the situation in Aspergillus, the NIT2 mRNA is relatively stable under both nitrogen limitation and nitrogen repression conditions. An interaction between the NIT2 protein and the pathway‐specific NIT4 protein is required for optimal expression of nitrate‐inducible genes, e.g. nit‐3 which encodes nitrate reductase. It is also interesting that Neurospora possesses several additional GATA factors with DNA binding activities identical to or very similar to that of NIT2. It now appears that specific control is exerted in each case by interactions with proteins restricted to the distinct area of metabolism (Feng and Marzluff, 1998; Feng et al., 2000).
2.1.4 Phosphorus source regulation. In natural environments, inorganic phosphorus is commonly the major growth‐limiting nutrient. Thus, biological systems have evolved a variety of responses to modulate their phosphorus requirement or to optimize its utilization. In E. coli, over 30 genes are part of the phosphate regulon (Pho regulon) and are transcriptionally activated by phosphorylated PhoB when the cell finds itself in low phosphate (Shinagawa et al., 1994). These genes encode proteins involved in uptake and utilization of phosphorus compounds. PhoR promotes the phosphorylation of PhoB under limiting phosphate conditions and dephosphorylation of PhoB in excess phosphate. PhoR and PhoB are thus a two‐component signal transduction system. PhoR autophosphorylates and transfers the phosphate to PhoB. The environmental concentration of phosphate is monitored by the periplasmic phosphate‐binding protein PstS, which transmits the signal for excess phosphate across the cytoplasmic membrane via PstC, PstA, PstB, PhoU to PhoR. Phosphorylated PhoB binds to the promoters of 31 genes containing pho boxes and interacts with RNA polymerase allowing initiation of mRNA synthesis.
Nucleases and phosphatases are usually repressed by phosphate in fungi. In addition, phosphate represses proteases, isocitrate lyase, fructose diphosphate aldolase, NADP isocitrate dehydrogenase and malate dehydrogenase in Neurospora. Phosphate also suppresses the production of riboflavin by Eremothecium ashbyii (Mehta and Modi, 1981). Phosphate‐derepressed mutants can be selected by growth with a phosphate ester (e.g. β‐glycerol phosphate) as the sole source of carbon in the presence of high phosphate (Torriani and Rothman, 1961).
Of great interest is inorganic polyphosphate (poly P) which is a linear polymer of many tens or hundreds of orthophosphate (Pi) residues linked by high‐energy phosphoanhydride bonds. Poly P is found in cells of all bacteria, archaea, fungi, protozoa, plants and animals and is prominent in many organisms, especially so in the vacuoles of yeast, where it may represent 10–20% of the cellular dry weight. It is produced by polyphosphate kinase (PPK), which catalyses the reversible transfer of the terminal phosphate of ATP to form a long‐chain poly P (Ahn and Kornberg, 1990). Paradoxically, despite the huge amounts of poly P in yeast, PPK‐like activity has not been found in whole‐cell lysates, although a feeble activity has been extracted and partially purified from a vacuolar preparation. The E. coli gene (ppk) encoding PPK has been cloned, sequenced and overexpressed (about 100‐fold). The gene possesses an open reading frame for 687 amino acids (mass of 80 278 Da). Polyphosphate kinase has been purified from overproducing cells after release from attachment to the cell outer membrane; the purified soluble PPK reassociates with cell membrane fractions. About 850 molecules of PPK are found in a wild‐type cell. The poly P roles can be summarized as follows: substitute for ATP and energy source, reservoir for inorganic phosphate, chelator of metal ions, channel for DNA entry, regulator for stress and survival, and regulator of development. However, the most widely used and most significant roles of polyphosphate are probably regulatory control in nutritional stringencies, environmental stresses, stationary‐phase adaptations and development (Kornberg et al., 1999).
2.1.5 Sulfur source regulation. Sulfatases are regulated by sulfate and sulfur amino acids. In addition to a variety of nutrients used to maintain continuous growth, bacteria require a source of sulfur. As for other nutrients, the use of sulfur is controlled by one or a few pleiotropic transcriptional regulatory proteins. Thus, in E. coli and the closely related Salmonella typhimurium, sulfur metabolism is controlled by the CysB transcriptional activator (Kredich, 1992). The cysteine regulon includes most of the genes required for synthesis of cysteine and genes for uptake of sulfur sources such as l‐cystine, sulfate, thiosulfate and taurine. Transcriptional activation of these genes requires CysB, the inducer N‐acetyl‐l‐serine and conditions of sulfur limitation. CysB is a tetrameric LysR‐type regulator with an N‐terminal DNA‐binding domain, a central inducer‐binding domain and a C‐terminal oligomerization domain that is essential for stability (Lochowska et al., 2001). Its activity is regulated by an efflux pump specific for cysteine metabolites. CysB is also an autorepressor, preventing expression of its own structural gene, cysB. In E. coli and S. typhimurium, cysB mutations influence carbon oxidation and carbohydrate fermentation, and possibly carbon utilization. Both effects are at the transcriptional level and are partially reversed by exogenous cAMP or a sulfur source such as cysteine or djenkolate. The effect seems to be via the regulation of the cAMP biosynthetic enzyme, adenylate cyclase, which is activated by the IIAGlc protein of the PTS. Cysteine inhibits inducer synthesis, resulting in maximal repression of the sulfur regulon. Growth with poor sulfur sources such as glutathione results in maximal derepression of the sulfur regulon.
Little is known about the genes and enzymes involved in sulfur assimilation in B. subtilis, or about the regulation of their expression or activity. Study of a wild‐type strain grown with either sulfate or glutathione as sole sulfur source revealed that the synthesis of 15 proteins is modified under these two conditions (Coppee et al., 2001). In the presence of sulfate, an increased amount of proteins involved in the metabolism of C1 units (SerA, GlyA, FolD) and in the biosynthesis of purines (PurQ, Xpt) and pyrimidines (Upp, PyrA, PyrF) was observed. In the presence of glutathione, the syntheses of two uptake systems (DppE, SsuA), an oxygenase (SsuD), cysteine synthase (CysK) and two proteins of unknown function (YtmI, YurL) were increased. The ytmI gene is part of a locus of 12 genes which are co‐regulated in response to sulfur availability. This putative operon is activated by a LysR‐like regulator, YtlI. This is the first regulator involved in the control of expression in response to sulfur availability to be identified in B. subtilis.
In N. crassa, sulfate uptake is an important point of regulation of sulfur metabolism (Tao and Marzluf, 1998). Sulfate uptake is subject to sulfur (metabolite) repression in which excess sulfate turns off the expression of sulfate permease‐encoding genes. Also, structural genes coding for aryl sulfatase, choline sulfatase, sulfate permeases I and II, a high‐affinity methionine permease and an extracellular protease are turned on when sulfur becomes limiting. These unlinked genes are regulated by the cys‐3 gene, a positively acting master sulfur regulatory gene whose product activates their expression. This gene product is a 236‐amino‐acid residue protein containing a leucine zipper element in its basic region. The leucine zipper is characteristic of DNA‐binding proteins (a leucine zipper is a protein sequence in which a leucine or methionine occurs at exactly every seventh position). The CYS‐3 protein binds to DNA at the 5′‐upstream portion of cys‐14 (encoding sulfate permease). It also binds to an upstream sequence of the cys‐3 gene itself suggesting the possibility of autoregulation. Mutation in the basic region eliminates DNA binding (Fu and Marzluf, 1990). Another regulatory gene, scon, controls the expression of cys‐3 in a negative fashion, i.e. scon mutants are insensitive to sulfur source repression and produce the enzymes constitutively.
2.1.6 Feedback regulation. The most important mechanism responsible for regulation of the enzymes involved in biosynthesis of amino acids, nucleotides and vitamins is not induction or nutrient repression, but feedback regulation. This category of regulation functions at two levels: enzyme action (feedback inhibition) and enzyme synthesis (feedback repression and attenuation).
In feedback inhibition, the final metabolite of a pathway, when present in sufficient quantities, inhibits the action of the first enzyme of the pathway to prevent further synthesis of intermediates and products of that pathway. Feedback repression involves the turning off of enzyme synthesis when sufficient amounts of the product have been made and it starts to accumulate. The end‐product of the pathway acts as a co‐repressor. The aporepressor specified by the regulator locus is inactive in the absence of its co‐repressor and is unable to bind to the operator. However, in the presence of co‐repressor, an active repressor is formed which binds to the operator to prevent transcription by RNA polymerase and hence prevents enzyme synthesis.
Many of the amino acid biosynthetic pathways are regulated not by the amino acids themselves but by their charged tRNA molecules. Thus, whereas feedback repression is effected by the amino acid end‐products acting as co‐repressors interfering with transcription initiation, another type of control called attenuation (transcription termination control) involves charged tRNA and transcription termination. Unless a significant number of the intracellular tRNA molecules for a particular amino acid are in the uncharged state, the genes coding for that amino acid's biosynthetic enzymes cannot be efficiently transcribed. In the presence of an excess of charged tRNA, transcription is initiated but terminated between the operator and the first structural gene (Kolter and Yanofsky, 1982). Attenuation is known to control certain bacterial amino acid biosynthetic operons, e.g. threonine, isoleucine, valine, leucine, phenylalanine, histidine. Unlike these operons, the tryptophan operon is regulated by both repression and attenuation, whose combined action permits a level of expression over a 600‐fold range. Repression is responsible for an 80‐fold range and attenuation for a sevenfold range. Repression responds to the level of tryptophan in the cell and attenuation to the level of charged tRNAtrp. The two mechanisms act at different degrees of tryptophan deprivation. Repression acts first, i.e. when the tryptophan level drops to that of moderate starvation, whereas attenuation acts in the moderate to severe tryptophan starvation range (Yanofsky et al., 1984).
In S. cerevisiae, the leu3 gene of the leucine biosynthetic pathway appears to be the master regulatory gene of specific control of branched amino acid biosynthesis. It encodes an 886‐amino‐acid polypeptide that is produced upon leucine starvation. This positively acting DNA binding protein (LEU‐3) binds to a decapeptide palindromic sequence (CCGG pur pur CCGG) in the promoters of at least four genes of leucine biosynthesis and one gene of isoleucine‐valine biosynthesis (Friden and Schimmel, 1988) and activates their transcription. This control probably acts on more than these five genes, i.e. on many genes of the branched amino acid pathway, all of which would have this decanucleotide sequence in their promoter. The site of this decanucleotide is within 130–376 nucleotides upstream of the transcriptional start site and defines a leucine‐sensitive upstream activation sequence.
Feedback repression of purine nucleotide biosynthesis in E. coli is exerted by binding of the co‐repressor, hypoxanthine or guanine, to the product of the purR gene (Rolfes and Zalkin, 1990). Hypoxanthine and guanine act cooperatively to change the conformation of PurR, thus enhancing its binding to DNA.
2.1.7 Additional types of regulation. Other types of regulation include metabolic interlock (Jensen, 1969), stringent control (Cashel et al., 1996) and regulatory inactivation (Switzer, 1977). The effector of stringent control is the alarmone guanosine 5′‐diphosphate 3′‐diphosphate (ppGpp) (Laurie et al., 2003). It binds to the core of RNA polymerase resulting in activation or repression of gene expression. It is produced by ribosomes via ppGpp synthetase (‘stringent factor’) encoded by relA. Synthesis occurs via binding of uncharged tRNA to the ribosome A site. Control by ppGpp involves the effect of amino acid deficiency on a large number of physiological activities in bacteria (Gallant, 1979). Deficiency of any amino acid leads to production of ppGpp from GTP. This intracellular effector redirects the cells activities to correction of the amino acid deficiency. In stringent control, ppGpp shuts off stable RNA synthesis, i.e. rRNA and tRNA as well as mRNA for ribosomal proteins. The rate of total mRNA synthesis drops only modestly however. This shut‐off acts at the level of transcription. It appears that ppGpp interferes with the binding of RNA polymerase to promoters of stringently controlled operons. The operons controlling threonine and isoleucine biosynthesis are positively regulated by ppGpp
Regulatory inactivation refers to the selective inactivation of enzymes (Switzer, 1977) by two different mechanisms. In modification inactivation, the enzyme remains intact but its physical state is changed or it is covalently modified. Covalent modifications include phosphorylation of a specific serine or threonine residue, nucleotidylation of a specific tyrosine residue, ADP ribosylation of an arginine residue, methylation of a glutamate or aspartate carboxyl group, acetylation of an ε‐amino group of a lysine residue or tyrosinolation of a protein terminal carboxyl group (Chock et al., 1980). In degradative inactivation, at least one peptide bond is broken; it may represent the first step in protein turnover. It is carried out by proteases which are restricted from non‐selective action by confinement in vacuoles or by protease inhibitors. Regulatory inactivation usually occurs after the exponential phase of growth, especially after exhaustion of a source of carbon or nitrogen. This inactivation serves to prevent futile cycles of metabolism, to destroy enzymes no longer needed and to divert branch point metabolism from one branch to another.
3. Approaches to strain construction
3.1 Mutation and screening or selection
Organisms used today for industrial production of primary metabolites have been developed by programmes of mutation followed by selection or screening. Such efforts often start with organisms having some capacity to make the desired product but which require multiple mutations leading to deregulation in a particular biosynthetic pathway before high productivity can be obtained. The sequential mutations ensure that nutrients are channelled efficiently to the appropriate products without significant deviation to other pathways. These mutations presumably involve not only release of feedback controls but also enhancement of the formation of pathway precursors and intermediates. This approach to strain improvement has been remarkably successful in producing organisms that make industrially significant concentrations of primary metabolites. However, some of the problems with this ‘brute force’ approach include (i) the necessity of screening large numbers of mutants for the rare combination of traits sequentially obtained that lead to overproduction, and (ii) the weakened vigour of the producing strain following several rounds of mutagenesis.
3.2 Genetic engineering
More recent approaches utilize the techniques of modern genetic engineering to develop strains overproducing primary metabolites. This rationale for strain construction relies largely on the same principles of regulation discussed in the previous sections, but aims at assembling the appropriate characteristics by means of in vitro recombinant DNA techniques. This is particularly valuable in organisms with complex regulatory systems, where deregulation would involve many genetic alterations.
Production of a particular primary metabolite by deregulated organisms may inevitably be limited by the inherent capacity of the particular organism to make the appropriate biosynthetic enzymes, i.e. even in the absence of repressive mechanisms, there may not be enough of the enzyme made to obtain high productivity. One way to overcome this is to increase the number of copies of structural genes coding for these enzymes by genetic engineering. Another way often used in combination with this strategy is to increase the frequency of transcription, which is related to the frequency of binding of RNA polymerase to the promoter region (Rosenberg and Court, 1979). The former can be achieved by incorporating the biosynthetic genes in vitro into a plasmid which, when placed in a cell by genetic transformation, will replicate into multiple copies; some ‘amplifiable’ plasmids, such as pBR322, can exist at a level of 50 copies per cell. Increasing the frequency of transcription involves constructing a hybrid plasmid in vitro, which contains the structural genes of the biosynthetic enzymes but lacks the regulatory sequences (promoter and operator) normally associated with them. Instead, the structural genes are placed next to an efficiently and frequently read promoter and operator, and are now subject to regulation by these sequences. The ideal plasmid for metabolite synthesis would contain a regulatory region with a constitutive phenotype, preferably not subject to nutritional repression.
One of the major problems in using strains in which the desired characteristics are encoded by a plasmid is the difficulty in maintaining the plasmids during fermentation. Plasmid instability in the absence of selective pressure leads to a dilution of the plasmid in the population and loss of the desired phenotype. One solution is to use antibiotic pressure during fermentation so that only organisms resistant to the antibiotic (due to the presence of a plasmid‐borne resistance gene) can survive. Plasmid stabilization was also accomplished by cloning the valyl‐tRNA synthetase gene in a plasmid which was transformed into E. coli carrying a temperature‐sensitive mutation in the chromosomal valyl‐tRNA synthetase gene. At the non‐permissive temperature, growth was dependent on the plasmid. The plasmid was stabilized for at least 150 generations (Nilsson and Skogman, 1986). Effective recombinant DNA plasmid construction in E. coli can lead to 20% of the total cell protein being that of a single protein.
Combinations of deregulation and plasmid amplification can yield a synergistic effect. For example, a chromosomal regulatory gene mutation in E. coli yielded fivefold overproduction of phosphatidylserine synthetase. Recombinant DNA technology using a plasmid containing the structural gene resulted in 10‐fold overproduction. Putting both in the same strain led to 50‐fold overproduction (Sparrow and Raetz, 1983).
3.3 Novel genetic technologies
‘Genome‐based strain reconstruction’ achieves the construction of a superior strain which only contains mutations crucial to hyperproduction, but not other unknown mutations which accumulate by brute‐force mutagenesis and screening (Ohnishi et al., 2002). This approach was used to improve lysine production (see Section 4.1.2).
The directed improvement of product formation or cellular properties via modification of specific biochemical reactions or introduction of new ones with the use of recombinant DNA technology is known as ‘metabolic engineering’ (Stephanopoulos, 1999; Nielsen, 2001). Analytical methods are combined to quantify fluxes and to control them with molecular biological techniques in order to implement suggested genetic modifications. Different means of analysing flux are (i) kinetic based models, (ii) control theories, (iii) tracer experiments, (iv) NMR magnetization transfer, (v) metabolite balancing, (vi) enzyme analysis and (vii) genetic analysis (Eggeling et al., 1996). The overall flux through a metabolic pathway depends on several steps, not just a single rate‐limiting reaction (Kacser and Acerenza, 1993). Amino acid production is one of the fields with many examples of this approach (Sahm et al., 2000). Other processes improved by this technique include vitamins, carotenoids, organic acids, ethanol and 1,3‐propanediol (see Sections 4.3, 4.4, 4.5.1 and 4.5.3).
A genome‐wide transcript expression analysis called ‘massive parallel signature sequencing’ (Brenner et al., 2000) was successfully used to discover new targets for further improvement of riboflavin production by the fungus Ashbya gossypii (see Section 4.3.2). These recent technologies and mathematical approaches will all contribute to the generation and characterization of microorganisms able to synthesize large quantities of commercially important metabolites. Ongoing sequencing projects involving hundreds of genomes, the availability of sequences corresponding to model organisms, new DNA microarray and proteomics tools, as well as the new techniques for mutagenesis and recombination described above, will accelerate strain improvement programmes. The development and combined application of these technologies will help to develop what was already succinctly described several years ago as ‘inverse metabolic engineering’ (Bailey et al., 1996), i.e. a method to identify, construct or calculate a desired phenotype, identify the molecular basis of that desirable property, and incorporate that phenotype into another strain or other species by genetic and environmental manipulations.
Molecular breeding techniques such as ‘DNA shuffling’ come closer to mimicking natural recombination by allowing in vitro homologous recombination (Ness et al., 2000). These techniques not only recombine DNA fragments but also introduce point mutations at a very low controlled rate (Stemmer, 1994; Zhao and Arnold, 1997). Unlike site directed mutagenesis, this method of pooling and recombining parts of similar genes from different species or strains has yielded remarkable improvements in enzymes in a very short amount of time (Patten et al., 1997). ‘Whole genome shuffling’ is a novel technique for strain improvement combining the advantage of multiparental crossing allowed by DNA shuffling with the recombination of entire genomes. Such recursive genomic recombination has been used to improve acid tolerance of a commercial lactic acid‐producing Lactobacillus sp. (Patnaik et al., 2002).
4. Microbial processes
4.1 Amino acid production processes
Among the amino acids, l‐glutamate and l‐lysine, mostly used as feed and food additives, respectively, represent the largest products in this category. Produced by fermentation are 1.5 million tons of l‐glutamate and 850 000 tons of l‐lysine‐HCl. Table 1 shows the annual production of amino acids. The total amino acid market was about 4.5 billion dollars in 2004 (Leuchtenberger et al., 2005).
Table 1.
Worldwide production of selected amino acids.
| Example | Production (tons) | Method |
|---|---|---|
| l‐Alanine | 500 | E |
| l‐Aspartic acid | 10 000 | E |
| l‐Arginine | 1 200 | F |
| l‐Cysteine | 4 000 | C, E |
| l‐Glutamate | 1 500 000 | F |
| l‐Glutamine | 2 200 | F |
| Glycine | 22 000 | C |
| l‐Histidine | 400 | F |
| l‐Isoleucine | 400 | F, Ex |
| l‐Leucine | 500 | F, Ex |
| l‐Lysine | 850 000 | F |
| dl‐Methionine | 500 000 | C |
| l‐Phenylalanine | 13 000 | F, C |
| l‐Proline | 350 | F |
| l‐Serine | 300 | F |
| l‐Threonine | 70 000 | F |
| l‐Tryptophan | 3 000 | F, E |
| l‐Tyrosine | 170 | F |
| l‐Valine | 500 | F |
C, chemical synthesis; E, enzymatic; Ex, extraction; F, fermentation. Ikeda (2003); Pfefferle et al. (2003); Kraemer (2004); Kroemer et al. (2004); Business Communications Company (2005); Wendisch (2005); Leuchtenberger et al. (2005); Wada and Takagi (2006); Li et al. (2007).
Top fermentation titres reported in the literature are shown in Table 2. Genetic engineering has made an impact by use of the following strategies: (i) amplification of a rate‐limiting enzyme of pathway, (ii) amplification of the first enzyme after a branch point, (iii) cloning of a gene encoding an enzyme with more or less feedback regulation, (iv) introduction of a gene encoding an enzyme with a functional or energetic advantage as replacement for the normal enzyme, and (v) amplification of the first enzyme leading from central metabolism to increase carbon flow into the pathway followed by sequential removal of bottlenecks caused by accumulation of intermediates. Transport mutations have also become useful, i.e. a mutation decreasing amino acid uptake allows for improved excretion and lower intracellular feedback control. This has been especially useful in production of tryptophan and threonine. In cases where excretion is carrier‐mediated, increase in activity of these carrier enzymes increases production of the amino acid. Exporter genes in Corynebacterium glutamicum are known for lysine, isoleucine and threonine.
Table 2.
Some examples of amino acids levels produced by fermentation.
| Amino acid | Titre (g l−1) | Microorganism | Reference |
|---|---|---|---|
| l‐Alanine | 75 | Arthrobacter oxydans | Hashimoto and Katsumata (1998) |
| l‐Arginine | 96 | Serratia marcescens | Ikeda (2003) |
| l‐Glutamate | 88 | Brevibacterium lactofermentum | Das (1995) |
| l‐Glutamine | 49 | Corynebacterium glutamicum | Li et al. (2007) |
| l‐Histidine | 42 | Serratia marcescens | Sugiura et al. (1987) |
| l‐Isoleucine | 30 | C. glutamicum | Eggeling et al. (1997) |
| l‐Leucine | 34 | B. lactofermentum | Tsuchida and Momose (1986) |
| l‐Lysine‐HCl | 170 | C. glutamicum | Kraemer (2004) |
| l‐Methionine | 25 | Brevibacterium heali | Mondal and Chatterjee (1994) |
| l‐Phenylalanine | 51 | Escherichia coli | Ikeda, 2003 |
| l‐Proline | 108 | Clostridium acetoacidophilum | Nakanishi et al. (1987) |
| l‐Serine | 65 | Methylobacterium sp. | Ikeda (2003) |
| l‐Threonine | 100 | E. coli | Debabov (2003) |
| l‐Tryptophan | 58 | C. glutamicum | Ikeda and Katsumata (1999) |
| l‐Tyrosine | 26 | C. glutamicum | Ikeda and Katsumata (1999) |
| l‐Valine | 99 | C. glutamicum | Ikeda (2003) |
Amino acids produced by microbial process are the l‐forms. Such stereospecificity makes the process advantageous as compared with synthetic process. Microbial strains employed in microbial process for amino acid production are divided into four classes, i.e. wild‐type strains, auxotrophic mutants, regulatory mutants and auxotrophic regulatory mutants. Using bacterial mutants, all the essential amino acids can be produced by ‘direct fermentation’ from cheap carbon sources such as carbohydrate materials or acetic acid.
Plasmid vector systems for cloning in C. glutamicum were established and amino acid production by C. glutamicum and related strains has been improved by gene cloning (Jetten and Sinskey, 1995; Kirchner and Tauch, 2003). Extensive research has been performed on sequencing the genome of C. glutamicum and to investigate its genetic repertoire (Moeckel et al., 1999). The genome was sequenced by Kyowa Hakko scientists (Ikeda and Nakagawa, 2003) and also by a collaboration of German workers (Kalinowski et al., 2003). The latter group reported a single circular chromosome with 3 282 708 base pairs, 3002 protein‐coding genes of which 2489 could be assigned functions. The whole‐genome sequence of C. glutamicum has been deposited in the DDBJ/GenBank/EMBL database under the Accession No. BA000036. The genome of the closely related glutamate‐overproducing species, Corynebacterium efficiens, has also been sequenced (Nishio et al., 2003).
One of the key tasks in targeted strain optimization is the identification of genetic modifications that lead to improved strain characteristics. The experience of the past clearly shows that a detailed quantitative knowledge of metabolic physiology is required for the rational design of superior production strains. Metabolic reconstruction via functional gene annotation revealed fascinating insights into C. glutamicum, including functional predictions for over 60% of the identified genes (Ikeda and Nakagawa, 2003). Gene expression (transcriptome) analysis has been performed by the development of specific DNA microarrays which are being used to investigate gene expression during the growth of C. glutamicum (Wendisch, 2003). Expression profiles of selected genes of central metabolism (Loos et al., 2001) and amino acid production (Glanemann et al., 2003) have been determined. For proteome analysis, two‐dimensional gel electrophoresis was used to identify different proteins and to study the influence of nitrogen starvation on the proteome (Schmid et al., 2000). An excellent review of proteomics in this organism has been published (Schaffer and Burkovski, 2005). For the quantification of metabolic fluxes (the ‘fluxome’), comprehensive approaches combining 13C tracer experiments, metabolite balancing and isotopomer modelling have been developed and applied to C. glutamicum. They involve comparative fluxome analysis during growth on different carbon sources, and glutamate and lysine production in batch cultures by different mutants (Kiefer et al., 2004). Reviews on metabolic engineering of amino acid producers include those of Sonntag and colleagues (1995), Eggeling and colleagues (1996) and Ikeda (2003). A useful review of the amino acid fermentation field is Kraemer (2004).
4.1.1 l‐Glutamic acid. Monosodium glutamate (MSG) is a potent flavour enhancer made by fermentation. The glutamic acid fermentation was discovered in Japan by Kinoshita, Udaka and Shimono in 1957 (Kinoshita et al., 1957). Although many genera and species are included in the group of glutamate overproducers, e.g. species of Micrococcus, Corynebacterium, Brevibacterium and Microbacterium, all are taxonomically similar and Brevibacterium lactofermentum and Brevibacterium flavum are now classified as C. glutamicum ssp. lactofermentum and ssp. flavum respectively. These organisms were shown to possess the Embden‐Meyerhof glycolytic pathway (EMP), the pentose monophosphate pathway, the TCA cycle and the glyoxylate bypass (Kinoshita, 1985). The TCA cycle requires a continuous replenishment of oxaloacetate in order to replace the intermediates withdrawn for the synthesis of biomass and amino acids. This anaplerotic function is fulfilled by phosphoenolpyruvate carboxylase (Ozaki and Shiio, 1969) and a pyruvate‐carboxylating enzyme (Tosaka et al., 1979). An excellent review of the metabolism of C. glutamicum has appeared (Wendisch, 2006).
Glucose is the preferred C source for C. glutamicum (Georgi et al., 2005). Fructose and sucrose are as good as glucose for glutamate production but not as good for lysine production (Kiefer et al., 2002). Glucose does not exert catabolite repression on use of other C sources except for l‐glutamate (Wendisch, 2006).
Normally, glutamic acid overproduction would not be expected to occur due to feedback regulation. Glutamate feedback controls include repression of PEP carboxylase, citrate synthase and NADP‐GDH; the last‐named enzyme is also inhibited by glutamate. However, by decreasing the effectiveness of the cell barrier to outward passage, glutamate can be pumped out of the cell thus allowing its biosynthesis to proceed unabated. The excretion of glutamate frees the glutamate pathway from feedback control until excessive levels are accumulated.
Glutamate excretion is intentionally effected by various manipulations. Limitation of biotin was the first means discovered to bring about glutamate overproduction in C. glutamicum. All glutamate overproducers are natural biotin auxotrophs. Biotin is a cofactor of acetyl‐CoA carboxylase which is essential for biosynthesis of fatty acids. The surprising report (Somerson and Phillips, 1961) that the addition of penicillin to cells grown in high biotin resulted in excretion of glutamic acid led Shiio and colleagues (1962) to postulate: (i) that growth of the glutamate‐overproducing bacterium in the presence of non‐limiting levels of biotin results in a cell envelope permeability barrier restricting the outward passage of intracellular amino acids out of the cell, and (ii) that inhibition of cell wall biosynthesis by penicillin alters the permeability properties of the cell envelope and allows glutamate to pass out of the cell. The commonality in the various manipulations that had been found to bring about high‐level production of l‐glutamic acid, i.e. limitation of biotin, addition of penicillin or fatty acid surfactants (e.g. tween 60) to exponentially growing cells, was recognized and the permeability mechanism was strongly supported (Demain and Birnbaum, 1968; Demain, 1971). Apparently all of these manipulations result in an altered lipid composition of the cell envelope, which favours active exit of glutamate from the cell. This view was further supported by the discoveries that oleate limitation of an oleate auxotroph (Kitano et al., 1972) and glycerol limitation of a glycerol auxotroph (Nakao et al., 1972) also brought about glutamate excretion. Both oleate and glycerol are precursors of phospholipids. Glutamate‐excreting cells were later found to have a major decrease in cell lipids especially phospholipids (Laneelle and Clement, 1986). It thus became clear that high‐level glutamate excretion required (i) growth inhibition in the presence of unlimited carbon and energy sources, and (ii) a change in strain on the envelope caused by deficiency of biotin, oleate or glycerol or addition of certain agents.
The cell envelope of C. glutamicum is very different from most Gram‐positive bacteria and resembles those of Gram‐negative bacteria (Schluesener et al., 2005). It contains the following layers: (i) plasma membrane which is mainly phosphatidylglycerol, (ii) peptidoglycan covalently attached to arabinogalactan esterified with mycolic acids, (iii) free mycolic acids and (iv) a crystalline protein layer known as the S layer. The permeability of the cell envelope is affected by lipid composition (Puech et al., 2000) and by specific import and export systems.
Despite the above evidence, the leaky envelope hypothesis was discounted (Hoischen and Kraemer, 1989), in favour of an efflux system specific for glutamate which was regulated by the energy state of the cell. However, the criticism was not absolute as these authors acknowledged the change in the composition of the cell membrane and stated that this membrane lipid alteration was an essential (but not sufficient) requirement for effective glutamate secretion. The action of biotin was attributed to effects on intermediary metabolism, correlating with the activity of fatty acid synthetases. Lambert and colleagues (1995) claimed that a change in membrane fluidity or general leakiness was not involved in glutamate excretion.
Studies of Kawahara and colleagues (1997), Kimura and colleagues (1999), Nakamatsu (2001) and Shimizu and colleagues (2003) led to another possibility, i.e. attributing glutamate overproduction to a decrease in the activity of α‐ketoglutarate dehydrogenase (ODHC). In addition to metabolic flux studies, a C. glutamicum mutant with a deletion of the odhA gene, encoding the E1 subunit of ODHC, was found to excrete high levels of glutamate without any of the above‐mentioned triggers (biotin limitation or addition of penicillin), supporting that a change in the metabolic flux alone is sufficient to cause glutamate secretion (Asakura et al., 2007). This complex was shown to be regulated by a mechanism that involves a 15 kDa protein named OdhI and a serine/threonine protein kinase G (PknG). In its unphosphorylated state, OdhI binds to the E1 subunit (OdhA) of ODHC and, thereby, inhibits its activity. Inhibition is relieved by phosphorylation of OdhI at threonine residue 14 by PknG under conditions requiring high ODHC activity (Schultz et al., 2007).
In 2001, however, the permeability modification hypothesis was further supported. The various manipulations leading to glutamate overproduction were shown to cause increased permeability of the mycolic acid layer of the cell wall (Eggeling and Sahm, 2001). The glutamate‐overproducing bacteria are characterized by a special cell envelope containing mycolic acids which surrounds the entire cell as a structured layer and is thought to be involved in permeation of solutes. The mycolic acids esterified with arabinogalactan and the non‐covalently bound mycolic acid derivatives form a second lipid layer, the cytoplasmic membrane being the first. As stated by these authors, ‘The concepts of “permeability of the cell wall” as originally used in the very first work on l‐glutamate production more than forty years ago now takes on a new meaning’. Nampoothiri and colleagues (2002) provided evidence that overexpression or inactivity of genes involved in lipid synthesis changes glutamate efflux dramatically, alters the chemical and physical properties of the cytoplasmic membrane, and that this was necessary to achieve efflux of l‐glutamate. Indeed, the authors state ‘that altering the phospholipid content alone is sufficient to enable l‐glutamate efflux’. Burkovski and Kraemer (2002) further stated that ‘There is no doubt that stimulation of glutamate excretion in C. glutamicum is directly or indirectly related to membrane and/or cell wall integrity’. Further support to this view came from Radmacher and colleagues (2005) who showed that ethambutol (EMB), an anti‐Mycobacterium tuberculosis agent, caused l‐glutamate efflux by targeting the arabinosyltransferase of C. glutamicum. The consequence of EMB addition was a marked disorder of the cell envelope, due to less arabinan deposition in the cell wall arabinogalactan, and a reduced content of the cell wall‐bound mycolic acids. Also, a mechanosensitive channel homologue has been found to induce glutamate production (Nakamura et al., 2007). It thus appears that either an increase in cell envelope permeability or a decrease in α‐ketoglutarate dehydrogenase can elicit overproduction and excretion of glutamate.
l‐Glutamate titres over 80 g l−1 have been described in the literature (Das et al., 1995; Delaunay et al., 1999). Metabolic engineering approaches have been used to analyse the fermentation (Sonntag et al., 1995; Eggeling et al., 1996; Takac et al., 1998; Kimura, 2003).
4.1.2 l‐Lysine. The bulk of the cereals consumed in the world are deficient in the amino acid, l‐lysine. This is an essential ingredient for the growth of animals, and is an important part of a billion‐dollar animal feed industry. Lysine supplementation converts such cereals into balanced food or feed for animals for poultry, swine and other livestock. In addition to animal feed, lysine is used in pharmaceuticals, dietary supplements and cosmetics. It has also been shown to be useful in the prevention of atherosclerosis and for treatment of herpes simplex virus infections.
Lysine is a member of the aspartate family of amino acids. It is made in bacteria by a branched pathway that also produces methionine, threonine and isoleucine. This pathway is controlled very tightly in an organism like E. coli, which contains three aspartate kinases, each of which is regulated by a different end‐product. In addition, after each branch point, the initial enzymes are inhibited by their respective end‐products and no overproduction usually occurs. However, in lysine fermentation organisms (C. glutamicum and its relatives), there is a single aspartate kinase which is regulated via concerted feedback inhibition by threonine plus lysine. Molar fluxes through various pathways leading to glutamate or lysine have been measured (Sonntag et al., 1995). Whereas the pentose phosphate pathway only contributes 20% of the total carbon flux for glutamate formation, it contributes 60–70% for lysine overproduction (Ishino et al., 1991). This is evidently due to the high level of NADPH required for lysine formation. Use of rDNA technology has shown that the major limiting factors in lysine overproduction are: (i) feedback inhibition of aspartokinase by lysine plus threonine, (ii) the low level of dihydrodipicolinate synthase, (iii) the low level of PEP carboxylase and (iv) the low level of aspartase. Much work has been done on auxotrophic and regulatory mutants of the glutamate‐overproducing strains for the production of lysine. By genetic removal of homoserine dehydrogenase, a glutamate‐producing wild‐type Corynebacterium strain is converted into a lysine‐overproducing mutant that cannot grow unless methionine and threonine are added to the medium. As long as the threonine supplement is kept low, the intracellular concentration of threonine is limiting and feedback inhibition of aspartate kinase is bypassed, leading to excretion of over 70 g l−1 lysine in culture fluids. In some strains, addition of methionine and isoleucine to the medium increases lysine overproduction. Selection for S‐2‐aminoethylcysteine (AEC; thialysine) resistance blocks feedback inhibition (up to 1 mM l‐lysine plus 5 mM l‐threonine) of aspartate kinase (Sahm, 1996). Other antimetabolites useful for deregulation of aspartate kinase include a mixture of α‐ketobutyrate and aspartate hydroxamate. Leucine auxotrophy can also increase lysine production. A production strain (B‐6) of C. glutamicum of Kyowa Hakko produces about 100 g l−1l‐lysine (Hayashi et al., 2006). Transcriptome analysis revealed that B‐6, as compared with the wild type, is upregulated in the pentose–phosphate path and amino acid biosynthetic genes and downregulated in TCA cycle genes. l‐Lysine titres are known to be as high as 170 g l−1 (Kraemer, 2004).
Excretion of lysine by C. glutamicum is by active transport reaching a concentration of several hundred millimolar in the external medium. Lysine, a cation, must be excreted against the membrane potential (outside is positive) and excretion is carrier‐mediated (Fig. 2). It uses a 2 OH‐/lysine symporter (Broer et al., 1993) and is catalysed specifically by a dipeptide uptake system (Erdmann et al., 1993). The system is dependent on electron motive force, not ATP.
Figure 2.
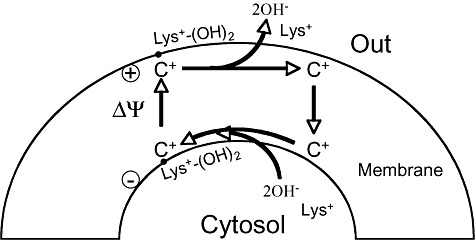
Mechanism of l‐lysine excretion. The carrier is loaded at the cytosolic side, translocates the substrate from the inner side and releases it outside the cell, and then the carrier is reconstituted. ΔΨ, electron motive force.
Genome‐based strain reconstruction was used to improve the lysine production rate of C. glutamicum by comparing high‐producing strain B‐6 (production rate slightly less than 2 g l−1 h−1) with a wild‐type strain (Ohnishi et al., 2002). Comparison of 16 genes from strain B‐6, encoding enzymes of the pathway from glucose to lysine, revealed mutations in five of the genes. Introduction of three of these mutations (hom, lysC and pyc encoding homoserine dehydrogenase, aspartokinase and pyruvate carboxylase respectively) into the wild type created a new strain which produced 80 g l−1 in 27 hours, at a rate of 3 g l−1 h−1, the highest rate ever reported for a lysine fermentation. An additional increase (15%) in l‐lysine production was observed by introduction of a mutation in the 6‐phosphogluconate dehydrogenase gene (gnd). Enzymatic analysis revealed that the mutant enzyme was less sensitive than the wild‐type enzyme to allosteric inhibition by intracellular metabolites. Isotope‐based metabolic flux analysis demonstrated that the gnd mutation resulted in 8% increased carbon flux through the pentose phosphate pathway during l‐lysine production (Ohnishi et al., 2005).
Metabolic engineering has been used in C. glutamicum to improve l‐lysine production (Sahm et al., 2000). Metabolic flux studies of wild‐type C. glutamicum and four improved lysine‐producing mutants available from the ATCC showed that yield increased from 1.2% to 24.9% relative to the glucose flux.
4.1.3 l‐Threonine. This amino acid is the second major amino acid used for feeding of pigs and poultry. The pathway of threonine biosynthesis is similar in all microorganisms. Starting from l‐aspartate, the pathway involves five steps catalysed by five enzyme activities: aspartokinase (AK), aspartate‐semialdehyde dehydrogenase (ASA‐DH), homoserine dehydrogenase (HDI), homoserine kinase (HK) and threonine synthetase (TS).
Production of l‐threonine has been achieved with the use of several microorganisms. In Serratia marcescens, Komatsubara and colleagues (1979) reported construction of a high threonine producer by transductional crosses which combined several feedback control mutations into one organism. Three classes of mutants were obtained from the parental strain as the source of genetic material for transduction: (i) strain HNr2l, in which both the threonine‐regulated AK and HD were resistant to inhibition by threonine. It was selected on the basis of β‐hydroxynorvaline resistance, (ii) strain HNr59, also selected for β‐hydroxynorvaline resistance, in which HDI was resistant to both inhibition and repression and the threonine‐regulated AK was constitutively synthesized, and (iii) strain AECrl74, which was resistant to thialysine, in which the lysine‐regulated AK was resistant to feedback inhibition and repression. As at least one of the three key enzymes in threonine synthesis was still subject to regulation in these strains, each produced only modest amounts of threonine (4.1–8.7 g l−1). Recombination of the three mutations by transduction yielded a strain which produced higher levels of threonine (25 g l−1), had AK and HD activities which were resistant to feedback regulation by threonine and lysine, and was also a methionine bradytroph (leaky auxotroph). Another six regulatory mutations derived by resistance to amino acid analogues were combined into a single strain of S. marcescens by transduction. These mutations led to desensitization and derepression of AKs I, II and III and HDIs and II. The resultant transductant produced 40 g l−1 threonine (Komatsubara et al., 1983). The amino acid‐overproducing S. marcescens strains were further improved by recombinant DNA technology. A mutant overproducing PEP carboxylase made 63 g l−1 threonine, a 21% increase (Sugita and Komatsubara, 1989).
In E. coli, threonine production was increased to 76 g l−1 by conventional mutagenesis and selection/screening techniques. Of major importance were mutations to decrease regulation of the pathway and of degradation of the amino acid (Furukawa et al., 1988). Recently, a comparative analyses of transcriptome, proteome and nucleotide sequences between a prototrophic (W3110) and an l‐threonine‐producing E. coli TF5015 was carried out (Lee et al., 2003). The latter strain required both l‐methionine and l‐isoleucine for growth and showed resistance to various chemical analogues. Expression patterns of the genes and proteins were investigated for both strains by using DNA macroarrays, containing virtually every gene of E. coli, and two‐dimensional gel electrophoresis. The profiles were analysed in terms of the accumulation of l‐threonine and physiological consequences in the mutant strain. Upregulation of the thr operon in TF5015 was confirmed by both transcriptome and proteome analyses. Comparison of gene expression profiles between W3110 and TF5015 showed that only 54 of 4290 genes (1.3%) exhibited differential transcript expression patterns. This was an interesting result as TF5015 produces a much higher level of threonine compared with the parent strain W3110. DNA sequencing of the thr operon revealed a replacement of serine with phenylalanine at position 345 in the thrA product, AK I‐HDI, of TF5015. Enzyme assay of mutated AK showed that the activity of AKI was not inhibited by threonine. Genetic analysis revealed that the mutation of thrA resulted in a release of feedback inhibition of AKI‐HDI by threonine in TF5015 rather than a deregulation of feedback repression by threonine plus isoleucine. Therefore, the authors suggested that the mechanism of l‐threonine production by TF5015 probably results from releasing feedback regulation and blocking carbon flow into undesirable by‐products. An E. coli fed‐batch process was devised with methionine and phosphate feeding which yielded 98 g l−1l‐threonine at 60 h (Lee, Lee et al., 2004). Another E. coli strain has been developed via mutation and genetic engineering and optimized by inactivation of threonine dehydratase (TD) resulting in a process yielding 100 g l−1 in 36 h of fermentation (Debabov, 2003).
Threonine excretion by C. glutamicum is mainly (>90%) effected by a carrier‐mediated export mechanism dependent on membrane potential but not on the presence of sodium ions (Palmieri et al., 1996). It is probably an antiport system against protons. Passive diffusion accounts for less than 10%. Threonine uptake is by a separate transport mechanism involving a carrier in symport with Na ions. Cloning in extra copies of threonine export genes into an E. coli strain producing threonine led to increased production (Kruse et al., 2002). Also increased was resistance to toxic antimetabolites of threonine. Another means of increasing threonine production is reduction in the activity of serine hydroxytransferase which breaks threonine down to glycine (Simic et al., 2002).
In C. glutamicum ssp. lactofermentum, threonine production reached 58 g l−1 when a strain producing both threonine and lysine (isoleucine auxotroph resistant to thialysine, α‐amino‐β‐hydroxyvaleric acid and S‐methylcysteine sulfoxide) was transformed with a recombinant plasmid carrying its own hom (encoding HD), thrB (encoding HK) and thrC (encoding TS) genes (Ishida et al., 1994). Medium modifications such as addition of complex nutrients, thiamine, biotin and NaCl were necessary for plasmid stability and solving growth lag problems.
4.1.4 l‐Isoleucine. Isoleucine is of commercial interest as a food and feed additive and for parenteral nutrition infusions. This branched‐chain amino acid is currently produced both by extraction of protein hydrolysates and by fermentation with classically derived mutants of C. glutamicum. The biosynthesis of isoleucine with C. glutamicum involves eleven reaction steps, of which at least five are controlled with respect to activity or expression. l‐Isoleucine synthesis shares reactions with the lysine and methionine pathways. In addition, threonine is an intermediate in isoleucine formation, and the last four enzymes also carry out reactions involved in valine, leucine and pantothenate biosynthesis. Therefore, it is not surprising that multiple regulatory steps identified in C. glutamicum, as in other bacteria, are required to ensure the balanced synthesis of all these metabolites for cellular demands. In C. glutamicum, flux control is exerted by repression of the homthrB and ilvBNC operons. The activities of AK, HD, TD, and acetohydroxy acid synthase (AHAS) are controlled by allosteric transitions of the proteins to provide feedback control loops, and HK is inhibited in a competitive manner (Sahm, 1995). Isoleucine increased the Km of TD from 21 to 78 mM whereas valine reduced it to 12 mM. The AHAS was 50% feedback inhibited by isoleucine plus valine plus leucine.
Isoleucine processes were devised in various bacteria such as S. marcescens, C. glutamicum ssp. flavum and C. glutamicum. In S. marcescens, resistance to isoleucine hydroxamate and α‐aminobutyric acid led to derepressed l‐threonine deaminase (TDA) and AHAS and production of 12 g l−1 isoleucine (Kisumi et al., 1977). Further work by Komatsubara and colleagues (1979) involving transductional crosses into a threonine overproducer yielded isoleucine at 25 g l−1. The C. glutamicum ssp. flavum work employed resistance to α‐amino‐β‐hydroxyvaleric acid and the resultant mutant produced 11 g l−1 (Shiio et al., 1973). d‐Ethionine resistance was used by Ikeda and colleagues (1976) to yield a mutant producing 33 g l−1 in a fermentation continuously fed with acetic acid.
A threonine‐overproducing strain of C. glutamicum was sequentially mutated to resistance to thiaisoleucine, azaleucine and α‐aminobutyric acid; it produced 10 g l−1 isoleucine (Kase and Nakayama, 1977). Metabolic engineering studies involving overexpression of biosynthetic genes were useful in improving isoleucine production by this species. Colon and colleagues (1995) obtained an isoleucine‐producing strain by cloning multiple copies of hom (encoding HDI), and wild‐type ilvA (encoding TD) into a lysine overproducer, and by increasing HK (encoded by thrB); 15 g l−1 isoleucine was produced. Independently, Morbach and colleagues (1995) cloned three copies of the feedback‐resistant HD gene (hom) and multicopies of the deregulated TD gene (ilvA) in a deregulated lysine producer of C. glutamicum, yielding an isoleucine producer (13 g l−1) with no threonine production and reduced lysine production. Application of a closed loop control fed‐batch strategy raised production to 18 g l−1 (Morbach et al., 1996). Further metabolic engineering work involving amplification of feedback inhibition‐insensitive biosynthetic enzymes converted lysine overproducers and threonine overproducers into C. glutamicum strains yielding 30 g l−1 isoleucine (Sahm et al., 1999).
4.1.5 l‐Proline. The primary precursor for proline biosynthesis in bacteria is glutamate. Bacterial proline synthesis from glutamate occurs via three enzymatic reactions, catalysed by γ‐glutamyl kinase (GK, the proB product), γ‐glutamyl phosphate reductase (GPR) (proA product) and Δ1‐pyrroline‐5‐carboxylate reductase (P5C) (proC product). For the majority of bacteria, the proB and proA genes constitute an operon, which is distant from proC on the chromosome. For both prokaryotic and eukaryotic systems, proline synthesis from glutamate is regulated by feedback inhibition of the first enzyme in the pathway. Studies on purified enzymes suggest that in addition to proline‐mediated inhibition, the γ‐glutamyl kinase activities of GK and P5CS are also modulated to a lesser extent by glutamate and ADP, thereby tuning proline synthesis to cellular substrate and energy availability.
Proline‐hyperproducing strains of bacteria, exhibiting reduced proline‐mediated feedback inhibition of GK activity (a result of single‐base‐pair substitutions in the bacterial proB gene‐coding region), have been isolated based on their resistance to toxic proline analogues (l‐azetidine‐2‐carboxylic acid and 3,4‐dehydro‐dl‐proline), compounds that inhibit GK activity while not interfering with protein synthesis. Cloning of the three genes of proline biosynthesis in E. coli on multicopy plasmids and selection of mutants of such plasmid‐containing strains to resistance to 3,4‐dehydroproline led to a process producing 20 g l−1 proline (Bloom et al., 1984).
A sulfaguanidine‐resistant mutant of C. glutamicum ssp. flavum produced 35 g l−1 proline (Tsuchida et al., 1986). When a glutamate‐producing strain of C. glutamicum was grown under modified conditions, it made 48 g l−1 (Nakanishi et al., 1973). A strain of Corynebacterium acetoacidophilum produced 108 g l−1 proline when grown in the presence of glutamate (Nakanishi et al., 1987).
A mutant of S. marcescens resistant to 3,4‐dehydroproline, thiazolidine‐4‐carboxylate and azetidine‐2‐carboxylate and unable to utilize proline produced 50–55 g l−1l‐proline (Sugiura et al., 1985a). Cloning of a gene bearing the dehydroproline‐resistance locus on a plasmid yielded a recombinant strain of S. marcescens producing 75 g l−1l‐proline (Sugiura et al., 1985b). Further development work increased production to over 100 g l−1 (Masuda et al., 1993).
4.1.6 Aromatic amino acids. In C. glutamicum ssp. flavum, 3‐deoxy‐d‐arabino‐heptulosonate 7‐phosphate (DAHP) synthase (DAHPS) is feedback inhibited concertedly by phenylalanine plus tyrosine and weakly repressed by tyrosine. Other enzymes of the common pathway are not inhibited by phenylalanine, tyrosine and tryptophan but the following are repressed: shikimate dehydrogenase (SD), shikimate kinase (SK) and 5‐enolpyruvylshikimate‐3‐phosphate synthase. Elimination of the uptake system for aromatic amino acids in C. glutamicum results in increased production of aromatic amino acids in deregulated strains (Ikeda and Katsumata, 1994). Cloning of relevant genes in various bacteria resulted in increases in aromatic amino acid production over those titres obtained by conventional mutagenesis and selection. Overproduction of aromatic amino acids and derivatives has been improved by metabolic engineering (Bongaerts et al., 2001).
4.1.6.1 l‐Tryptophan. l‐Tryptophan has application as a supplement in animal feed. A tryptophan process was improved from 8 g l−1 to over 10 g l−1 by mutating the C. glutamicum ssp. flavum producer to azaserine resistance (Shiio et al., 1982). Azaserine is an analogue of glutamine, the substrate of anthranilate synthase (AS). The mutant was two‐ to threefold derepressed in DAHPS, dehydroquinate synthase (DQS), SD, SK and chorismate synthase (CS). A further mutant (sulfaguanidine‐resistant) showed additional increases in DAHPS and DQS and tryptophan production (Shiio et al., 1984). The reason sulfaguanidine was chosen as the selective agent involves the next limiting step after derepression of DAHPS, i.e. conversion of the intermediate chorismate to anthranilate. Chorismate can also be undesirably converted to p‐aminobenzoic acid (PABA) and sulfonamides are PABA analogues. Sulfaguanidine‐resistant mutant S‐225 was obtained from C. glutamicum ssp. flavum A‐100 and production was increased from 10 g l−1 tryptophan to 19 g l−1. The sulfaguanidine‐resistant mutant was still repressed by tyrosine but showed higher enzyme levels at any particular level of tyrosine (Sugimoto and Shiio, 1985).
Gene cloning of the tryptophan branch and mutation to resistance to feedback inhibition yielded a C. glutamicum strain producing 43 g l−1l‐tryptophan (Katsumata and Ikeda, 1993). The genes cloned were those that encoded AS, anthranilate phosphoribosyl transferase, a deregulated DAHPS, and other genes of tryptophan biosynthesis. However, sugar utilization decreased at the late stage of the fermentation and plasmid stabilization required antibiotic addition. Sugar utilization stopped due to killing by accumulated indole. By cloning in the 3‐phosphoglycerate dehydrogenase gene (to increase production of serine which combines with indole to form more tryptophan) and by mutating the host cells to deficiency in this enzyme, both problems were solved (Ikeda et al., 1994). The new strain produced 50 g l−1 tryptophan with a productivity of 0.63 g l−1 h−1 and a yield from sucrose of 20%. Further genetic engineering to increase the activity of the pentose phosphate pathway increased production to 58 g l−1 (Ikeda and Katsumata, 1999).
4.1.6.2 l‐Phenylalanine and l‐tyrosine. A deregulated strain of E. coli in which feedback inhibition and repression controls were removed made 11 g l−1 phenylalanine in a fed‐batch culture and 9 g l−1 in continuous culture (Choi and Tribe, 1982). Production of phenylalanine amounted to 28 g l−1 when a plasmid was cloned into E. coli containing a feedback inhibition‐resistant version of the CM‐prephenate dehydratase (PD) gene, a feedback inhibition‐resistant DAHPS and the ORPR and OLPL operator‐promoter system of lambda phage. Control of plasmid expression was by temperature manipulation (Sugimoto et al., 1987). Further process development of genetically engineered E. coli strains brought phenylalanine titres up to 46 g l−1 (Konstantinov and Yoshida, 1992). Independently, genetic engineering based on cloning aroF and feedback‐resistant pheA genes created an E. coli strain producing 50 g l−1 (Backman et al., 1990).
A C. glutamicum ssp. lactofermentum culture, obtained by selection with m‐fluorophenylalanine, produced 5 g l−1 phenylalanine, 7 g l−1 tyrosine and 0.3 g l−1 anthranilate and contained a desensitized DAHPS and PD. DHAPS in the wild‐type was inhibited cumulatively by phenylalanine and tyrosine whereas PD was inhibited by phenylalanine. Cloning of the gene encoding PD from a desensitized mutant and the gene encoding desensitized DAHPS increased the enzyme activities and yielded a strain producing 18 g l−1 phenylalanine, 1 g l−1 tyrosine and no anthranilate (Ito et al., 1990a). Further cloning of a recombinant plasmid expressing desensitized 3‐deoxy‐d‐arabinoheptulosonate‐7‐phosphate synthase increased production to 26 g l−1 phenylalanine (Ito et al., 1991). Similarly, C. glutamicum strains have been developed producing 19 (Ozaki et al., 1985), 23 (Ikeda et al., 1993) and 28 g l−1 phenylalanine (Ikeda and Katsumata, 1992).
When SK was cloned into a tyrosine‐producing C. glutamicum ssp. lactofermentum strain, tyrosine production increased from 17 g l−1 to 21 g l−1 (Ito et al., 1990b). Cloning of desensitized genes encoding DAHPS and CM from a deregulated phenylalanine‐producing C. glutamicum strains into the deregulated tryptophan producer, C. glutamicum KY 10865 (CM‐deficient strain, phenylalanine and tyrosine double auxotroph with a desensitized AS) shifted production from 18 g l−1 tryptophan to 26 g l−1 tyrosine (Ikeda and Katsumata, 1992).
An enymatic bioconversion of phenol, pyruvate, pyridoxal phosphate and ammonium chloride to l‐tyrosine utilizes a thermostable and chemostable tyrosine phenol lyase from Symbiobacterium toebii (Kim et al., 2007). The process yields 130 g l−1 in 30 h with continuous feed of substrate.
4.2 Production processes for purines and pyrimidines, their nucleosides and nucleotides
Commercial interest in nucleotide fermentations is due to the activity of two purine ribonucleoside 5′‐monophosphates, namely guanylic acid (guanosine 5′‐monophosphate; GMP) and inosinic acid (inosine 5′‐monophosphate; IMP), as flavour enhancers. It is quite impressive that a 1:1 mixture of MSG with IMP or GMP gives flavour intensity 30 times stronger than MSG alone. A review of the production of flavour enhancers for the food industry is Elhariry and colleagues (2004). Over 15 000 tons of IMP and GMP were produced in 2003 (Ishige et al., 2005).
4.2.1 Purines and derivatives. The purine residue of IMP is built up on a ribose ring in eleven enzymatically catalysed reactions. Ribose phosphate pyrophosphokinase is the first pathway enzyme and catalyses the conversion of α‐d‐ribose‐5‐phosphate (R5P) and ATP to 5‐phosphoribosyl‐α‐pyrophosphate (PRPP). Adenosine‐5′‐monophosphate (AMP) and GMP are synthesized from IMP. AMP formation involves participation of two enzymes, adenylosuccinate synthetase and adenylosuccinase. GMP synthesis requires the participation of IMP dehydrogenase and GPM synthetase. PRPP synthetase is feedback inhibited by AMP, GMP and IMP. Adenylosuccinate synthetase is inhibited by AMP. IMP dehydrogenase is inhibited by xanthosine‐5′‐monphosphate (XMP) and GMP. The genes encoding the enzymes of IMP biosynthesis in B. subtilis constitute the pur operon, whereas the genes encoding the GMP biosynthetic enzymes, guaA (GMP synthetase) and guaB (IMP dehydrogenase), and the purA gene encoding adenylosuccinate (sAMP) synthetase all occur as single units. The purB gene encodes an enzyme involved in both IMP and AMP biosynthesis and is located in the pur operon. The levels of purine biosynthetic enzymes (except for GMP synthetase) are repressed in cells grown in the presence of purine compounds. Transcription of the pur operon is regulated negatively by adenine and guanine compounds including ATP and guanine (or hypoxanthine).
Techniques similar to those described above for amino acid fermentations have yielded IMP titres of 27 g l−1 (Kuninaka, 1996). As only low levels of GMP have been produced by direct fermentation, it is usually made by bioconversion of XMP. Genetic modification of Corynebacterium ammoniagenes involving transketolase (an enzyme of the non‐oxidative branch of the pentose phosphate pathway) resulted in the accumulation of 39 g l−1 XMP (Kamada et al., 2001). This work demonstrates the need for high levels of pentose (ribose) for nucleotide and nucleoside biosynthesis and overproduction.
The key to effective accumulation of purines and their derivatives is limitation of intracellular AMP and GMP. This limitation is best effected by restricted feeding of purine auxotrophs. Thus, adenine‐requiring mutants lacking adenylosuccinate synthetase accumulate hypoxanthine or inosine that results from breakdown of intracellularly accumulated IMP. Certain adenine auxotrophs of B. subtilis excrete over 10 g l−1 inosine. These strains are still subject to GMP repression of enzymes of the common path. To minimize the severity of this regulation, the adenine auxotrophs are further mutated to eliminate IMP dehydrogenase. These adenine‐xanthine double auxotrophs show a twofold increase in specific activity of some common‐path enzymes and accumulate inosine up to 15 g l−1 under conditions of limiting adenine and xanthine (or guanosine). Further deregulation is achieved by selection of mutants resistant to purine analogues. Thus, mutants resistant to azaguanine with requirements for adenine and xanthine produce over 20 g l−1 inosine. Insertional inactivation of the IMP dehydrogenase gene in a B. subtilis strain yielded a culture producing inosine at 35 g l−1 (Miyagawa et al., 1989).
Cloning of IMP dehydrogenase has been used to improve guanosine production in B. subtilis. The donor strain, NA7821, produced a low level of purine nucleosides but the distribution was in favour of guanosine (1 g l−1 inosine versus 9 g l−1 guanosine). The recipient strain, NA6128, was auxotrophic for adenine, lacked GMP reductase and purine nucleoside phosphorylase, and was resistant to 8‐azaguanine, adenine and adenosine; it produced 19 g l−1 inosine and 7 g l−1 guanosine. Cloning of IMP dehydrogenase from strain NA7821 into NA 6128 yielded recombinant NA 6128 (pBxl21), which produced 5 g l−1 inosine and 20 g l−1 guanosine (Miyagawa et al., 1986). Other B. subtilis mutants produce as much as 30 g l−1 guanosine (Qian et al., 2006). Nucleosides such as inosine and guanosine are then converted to their active nucleotide derivatives chemically, microbiologically or enzymatically (Mori et al., 1997). IMP is produced at 156 g l−1 from inosine with a molar yield of 79% in 24 h (Mihara, 2004).
4.2.2 Pyrimidines and derivatives. The de novo pyrimidine biosynthetic pathway involves five enzymes and results in uridine‐5′‐monophosphate (UMP) production. Aspartate transcarbamoylase, the first pathway enzyme committed to pyrimidine biosynthesis, catalyses the conversion of aspartate and carbamoylphosphate to carbamoylaspartate. The subsequent biosynthetic pathway enzymes are dihydroorotase, dihydroorotate dehydrogenase, orotate phosphoribosyltransferase and orotidine‐5′‐monophosphate (OMP) decarboxylase. Uridine triphosphate (UTP) is produced from UMP by the sequential actions of two nucleoside kinases. Cytidine triphosphate (CTP) is formed by amination of UTP by CTP synthetase. The pyrimidine biosynthetic pathway is regulated at the level of gene expression in several species of bacteria. In addition, the regulation of aspartate transcarbamoylase activity determines the rate of pyrimidine nucleotide synthesis. The pyrimidine nucleotide biosynthesis (pyr) operon in B. subtilis contains 10 cistrons. The first gene in the operon encodes PyrR, which is the regulatory protein for the pyr operon. The PyrR protein binds in a uridine nucleotide‐dependent manner to three attenuation regions located in the 5′‐leader region (binding loop 1, BL1), the pyrR–pyrP intercistronic region (BL2) and the pyrP–pyrB intercistronic region (BL3) of pyr mRNA. PyrR recognizes conserved RNA sequences, but only if they are properly positioned in the correct secondary structure (Bonner et al., 2001). The second gene in the operon encodes PyrP, which is a uracil permease. Uridine‐5′‐monophosphate kinases from E. coli and B. subtilis are activated by GTP and inhibited by UTP (Gagyi et al., 2003).
Selection for antimetabolite resistance has proven to be successful in development of nucleotide and nucleoside fermentations (Demain, 1978). Cytidine production by a B. subtilis cytidine‐deaminase‐deficient mutant with resistance to fluorocytidine amounted to 10 g l−1. Further mutation to 3‐deazauracil resistance increased production to 14 g l−1. By introducing a gene encoding a feedback‐resistant carbamyl phosphate synthase, cytidine production was increased to 18 g l−1. Homoserine dehydrogenase (HSD) deficiency in B. subtilis increased cytidine production in a deregulated mutant from 9 g l−1 to 23 g l−1 (Asahi et al., 1996). Increasing the glucose concentration raised production to 30 g l−1. Uridine production by mutants of B. subtilis resistant to pyrimidine antimetabolites can produce 55 g l−1 uridine (Doi et al., 1989).
4.3 Vitamin production processes
More than half of vitamins produced commercially are fed to domestic animals (Stahmann, 2002). The vitamin market is several billion dollars per year. Microbes produce five vitamins commercially: vitamin B12 (cyanocobalamin), ascorbic acid (vitamin C), riboflavin (vitamin B2), pantothenic acid (vitamin B5) and biotin. Some vitamin processes have been improved by metabolic engineering (Sybesma et al., 2004)
4.3.1 Vitamin B12. Bacterial formation of vitamin B12 by bacteria has been going on for a long time. The anaerobic pathway is about 4 billion years old whereas the aerobic pathway evolved when our atmosphere became enriched with oxygen about 2 billion years ago (Scott and Roessner, 2002). Vitamin B12 is produced commercially at about 10 tons per year (Martens et al., 2002). Fermentations have to be run under complete or partial anaerobiosis when using species of Pseudomonas or Propionibacterium. Propionibacterium freudenreichii can produce 206 mg l−1 although the major industrial organisms are Pseudomonas denitrificans and Propionibacterium shermanii. Conventional strain improvement has yielded P. denitrificans strains producing 150 mg l−1 (Spalla et al., 1989).
Increasing the activity of S‐adenosyl‐l‐methionine: uroporphyrinogen III methyltransferase (SUMT) by cloning in a DNA fragment containing this gene (cobA) in P. denitrificans increased vitamin B12 production by 100% (Crouzet et al., 1993). SUMT is at the branch point of the haem and B12 biosynthetic pathways. Cloning of the gene cob1 increased S‐adenosyl‐l‐methionine:precorrin‐2‐methyltransferase (SP2MT) and B12 production by 30%. SP2MT is at the branch point of the siroheme and B12 pathways. On the other hand, cloning the δ‐aminolevulinate synthase (ALAS) gene increased ALAS activity but not B12 biosynthesis.
Vitamin B12 biosynthesis in S. typhimurium involves three closely located operons: CobI, CobII and CobIII mapping at 41 min, and another locus CobA at 34 min (Escalante‐Semerena et al., 1990). CobI is involved in biosynthesis of cobinamide. CobII deals with 5,6‐dimethylbenzimidazole (DMB) biosynthesis; CobIII involves the linking of the two moieties to form cobalamine; and CobA is involved in adenosylation of an early precursor of the corrin ring. Transcription of the CobI operon genes does not occur under aerobiosis (Anderson and Roth, 1989). In addition, this operon is repressed by the ultimate end‐product, cobalamin. It is not oxygen itself that causes the repression but the lack of a reducing environment in the cell.
4.3.2 Riboflavin. Annual production of riboflavin is 4000 tons per year (Vandamme and Soetaert, 2006). Riboflavin overproducers include two yeast‐like molds, E. ashbyii and A. gossypii, which synthesize riboflavin in concentrations higher than 20 g l−1.
In A. gossypii, riboflavin production is stimulated three‐ to fourfold by the precursors glycine and hypoxanthine (Kaplan and Demain, 1970; Monschau et al., 1998). The level of production, which occurs after growth rate declines, is determined by the activity of the promoter of gene RIB3. This gene encodes 3,4‐dihydroxy‐2‐butanone‐4‐phosphate (DHBP) synthase, the first enzyme of the pathway (Schloesser et al., 2001). Mutation of A. gossypii to resistance to aminomethylphosphonic acid (a glycine antimetabolite) yielded improved producers. Isocitrate lyase (ICL) is important for use of fatty acids for riboflavin production (Schmidt et al., 1996). Itaconate, an inhibitor of ICL, eliminated the yellow colour of A. gossypii colonies. A mutant that was yellow on itaconate‐containing agar produced 15% more enzyme and 25‐fold more riboflavin. When grown in glucose, ICL‐specific activity dropped by 33% in the mutant but riboflavin production increased eightfold. The mutation appears to be a regulatory mutation affecting ICL‐specific activity. A genome‐wide transcript expression analysis, i.e. massive parallel signature sequencing (Brenner et al., 2000), was successfully used for further improvement of riboflavin production by A. gossypii (Karos et al., 2004). The authors identified 53 genes of known function, some of which could clearly be related to riboflavin production. This approach also allowed the finding of sites within the genome with high transcriptional activity during riboflavin biosynthesis that are suitable integration loci for the target genes found.
Processes using recombinant B. subtilis strains that produce 30 g l−1 riboflavin have been developed. In this microorganism, riboflavin formation is regulated by feedback repression, not inhibition (Bresler et al., 1973). An aporepressor encoded by ribC, whose effectors are riboflavin, FMN and FAD, is responsible for this effect. Mutations of ribC led to riboflavin overproduction. Sequential selection for resistance to 8‐azaguanine, decoyinine, methionine sulfoxide and roseoflavin plus multiple copies of the riboflavin biosynthetic rib operon yielded overproducing mutants (Perkins et al., 1999). Further improvement was achieved when an extra copy of the ribA gene was introduced into the culture. This gene encodes both GTP cyclohydrolase II and 3,4‐dihydroxy‐2‐butanone 4‐phosphate synthase, both of which act to commit precursors GTP and ribulose‐5‐phosphate to riboflavin biosynthesis.
A Candida famata (Candida flareri) strain produced 20 g l−1 in 200 h. It was obtained by mutation and selection for resistance to 2‐deoxyglucose (DOG), iron, tubercidin (a purine analogue) and depleted medium, plus protoplast fusion (Heefner et al., 1992). The process depends on the addition of glycine and hypoxanthine. Selection for resistance to the adenine antimetabolite 4‐aminopyrazolo (3,4‐d) pyrimidine) improved production (Heefner et al., 1993). Threonine showed a ninefold stimulation in a strain with a cloned threonine aldolase, which converts threonine to glycine. Having the cloned gene, but without added threonine, resulted in no stimulation, presumably due to the low level of internal threonine resulting from aspartokinase feedback inhibition.
4.3.3 Vitamin C. Vitamin C has a global production of 110 000 tons per year (Macauley et al., 2001; Deppenmeier et al., 2002), selling for $6–8 kg. It is used for nutrition of humans and animals as well as a food antioxidant. The otherwise chemical seven‐step Reichstein process includes one bioconversion reaction, the oxidation of d‐sorbitol to l‐sorbose by Gluconobacter oxydans, as the first step in ascorbic acid production. The biotransformation proceeds at the theoretical maximum, i.e. 200 g l−1d‐sorbitol can be converted to 200 g l−1l‐sorbose, when using a mutant of G. oxydans selected for resistance to a high sorbitol concentration. The biconversion is used rather than a chemical reaction as the latter produces unwanted d‐sorbose along with l‐sorbose. An excellent fed‐batch bioconversion process uses a starting concentration of 100 g l−1 of d‐sorbitol and achieves production of 280 g l−1l‐sorbose in 16 h with a productivity of 17.6 g l−1 h−1 (Giridhar and Srivastava, 2002). The Reichstein process converts glucose to 2‐keto‐l‐gulonic acid (2‐KLGA) in five steps with a yield of 50%. Then, 2‐KLGA is chemically converted to l‐ascorbic acid in two more steps.
The Reichstein process has provided ascorbic acid for 70 years but is being threatened now by fermentation processes (Bremus et al., 2006). A mixed culture of G. oxydans strain DSM4025 (which converts l‐sorbose to 2‐KLGA) and Gluconobacter suboxydans IFO 3255 (which converts d‐sorbitol to l‐sorbose) was able to convert 138 g l−1d‐sorbitol to 112 g l−1 2‐KLGA, with a molecular conversion yield of 75% in 2 days (Hoshino, 2000). A recombinant strain of G. oxydans containing genes encoding l‐sorbose dehydrogenase and l‐sorbosone dehydrogenase from G. oxydans T‐100 was able to produce 2‐KLGA effectively from d‐sorbitol (Saito et al., 1997). Mutation to suppress the l‐idonate pathway and improvement of the promoter led to production of 130 g l−1 2‐KLGA from 150 g l−1d‐sorbitol.
Another development was the metabolic engineering of Pantoca citrea, a Gram‐negative bacterium capable of producing keto sugars. By mutations eliminating the conversion of glucose to glucose 6‐phosphate and the conversion of gluconate to gluconate 6‐phosphate, a culture was prepared which converted 97% of the glucose fed to 2‐KLGA (Sanford et al., 2004).
4.3.4 Biotin. The annual production of biotin amounts to about 30 tons per year. The repressor of the biotin biosynthetic pathway is the enzyme acetyl‐CoA carboxylase biotin holoenzyme synthetase that catalyses attachment of biotin from biotin‐5′‐adenylate to acetyl‐CoA carboxylase (Barker and Campbell, 1981). The co‐repressor is biotin‐5′‐adenylate.
Strains of S. marcescens obtained by mutagenesis and cloning produce 500 mg l−1 biotin plus 100 mg l−1 desthiobiotin. High concentrations of sulfur and ferrous iron increased biotin production by the S. marcescens recombinant strain to a level of 600 mg l−1 (Masuda et al., 1995). A process using an E. coli mutant resistant to β‐hydroxynorvaline (a threonine antimetabolite) yielding 970 mg l−1 has been patented (Matsui et al., 2001). Biotin was further increased by using a B. subtilis strain resistant to 5‐(2‐thienyl) pentanoic acid (a biotin analogue) and overexpressing several bio genes to values over 1 g l−1 (Bower et al., 2001). Although the above mentioned biotin titres seem to be useful, none of the patented technologies is cost‐effective enough to reach the production line. According to Hong and colleagues (2006), the limitation in the microbial production processes seems to be due to several factors of the fermentation processes such as expensive biotin precursors, plasmid instability, possible toxic side‐effects of some metabolites, and finally, the costly purification process.
4.3.5 Other vitamins. Recombinant E. coli, transformed with genes encoding pantothenic acid (vitamin B5) biosynthesis, and resistant to salicylic and/or other acids, produce 65 g l−1d‐pantothenic acid from glucose using β‐alanine as precursor (DeBaets et al., 2000). Seven thousand tons per year are made chemically and microbiologically. Thiamine (vitamin B1) is produced synthetically at 4000 tons per year. Pyridoxine (vitamin B6) is made chemically at 2500 tons per year. The vitamin F (polyunsaturated fatty acids) processes of Mortierella isabellina or Mucor circinelloides yield 5 g l−1γ‐linolenic acid.
Carotenoid production processes have been extensively studied (Johnson and Schroeder, 1995) but none has reached the stage to economically challenge chemical methods. Processes in development include those yielding β‐carotene, lycopene, zeaxanthin and astaxanthin. Some have been improved by metabolic engineering and directed evolution (Barkovich and Liao, 2001; Lee and Schmidt‐Dannert, 2002; Tao et al., 2005).
4.4 Organic acid production processes
Citric, gluconic, itaconic and lactic acids are the main organic acids with commercial application as chemicals (Magnuson and Lasure, 2004). Production of organic acids has been improved by classical mutation and screening/selection techniques as well as by metabolic engineering (Kraemer et al., 2003).
4.4.1 Acetic acid. Over 7 million tons of acetic acid are made worldwide, over half by microbial methods (Causey et al., 2003). Vinegar has been produced microbiologically as far back as 4000 bc. Vinegar fermentation is best carried out with species of Gluconacetobacter and Acetobacter (Deppenmeier et al., 2002). A solution of ethanol is converted to acetic acid in which 90–98% of the ethanol is attacked yielding a solution of vinegar containing 12–17% acetic acid.
Acetate excretion is not merely ‘overflow’ metabolism but allows the cell to grow faster and to reach higher cell densities. Metabolic engineering studies have been carried out (El‐Mansi, 2004). Titres of acetic acid have reached 53 g l−1 with genetically engineered E. coli (Causey et al., 2003), 83 g l−1 with a Clostridium thermoaceticum mutant (Parekh and Cheryan, 1994) and 97 g l−1 with an engineered strain of Acetobacter aceti subsp. xylinium (Beppu, 1993).
4.4.2 Citric acid. Production of citric acid by A. niger and yeasts amounts to about 1 million tons per year (Magnuson and Lasure, 2004). Annual sales have reached $2 billion. The best strains of A. niger make over 200 g l−1 citric acid from 250 g l−1 glucose or sucrose (Al‐Obaidy and Berry, 1979). Keys to the fermentation are excess carbon source, low pH, dissolved oxygen and limited concentrations of certain trace metals and phosphate (Roehr, 1998).
Glucose is converted to pryuvate by the Embden‐Meyerhof‐Parnas (EMP) pathway, then to acetylcoenzyme A which enters the TCA cycle by condensing with oxaloacetate to form citric acid. Citric acid production is stimulated by growing this fungus in a high sucrose concentration (10–20%). This is probably the result of the sugar's ability to cause the intracellular accumulation of fructose 2,6‐bisphosphate which activates glycolysis (Kubicek‐Pranz et al., 1990). Fructose 2,6‐bisphosphate is the product of phosphofructokinase II. Another key to a successful citric acid fermentation by this fungus is a deficiency of Mn2+. Also important is the restriction of the activity of isocitrate dehydrogenase, while maintaining an active citrate synthase. This prevents oxidative decarboxylation of isocitrate to α‐ketoglutarate. As the equilibrium of aconitase, which converts citric acid to isocitric acid, is markedly in favour of citrate, citric acid accumulates. Two isocitrate dehydrogenases, mitochondrial and NADP+ specific, are inhibited by citrate. As the cofactor of this enzyme is Mg2+ or Mn2+, citrate's ability to chelate these metals restricts enzyme activity; thus citrate inhibits its own degradation. Citrate inhibition of isocitrate dehydrogenase is in direct proportion to citric acid yield.
In addition to Mn2+, the metal deficiencies necessary for good citric acid production in different media and by different strains of A. niger are Fe2+ and Zn2+. However, the major required limitation is that of Mn2+. The principal regulatory control site in the reactions from glucose to citrate is phosphofructokinase. This enzyme is inhibited by citrate, an event that would not be favourable for overproduction of citric acid. However, Mn2+ deficiency slows down growth, leading to degradation of intracellular nitrogenous macromolecules and a fivefold increase of NH4+ in mycelia. The high ammonium concentration reverses citrate inhibition of phosphofructokinase, thus assuring the continued conversion of glucose to citrate. Mutants whose phosphofructokinase I is partially desensitized to citrate inhibition are less dependent on low Mn2+ for high citric acid production (Schreferl et al., 1986). Citrate inhibition of phosphofructokinase is also reversed by fructose 2,6‐diphosphate and AMP (Kubicek, 1998).
The optimum pH for citric acid production by A. niger is 1.7–2.0. At pH values higher than 3.0, oxalic and gluconic acids are produced instead. Low pH inactivates glucose oxidase and prevents gluconate production (Kubicek and Roehr, 1986). Mutants of A. niger with greater resistance to low pH are improved citric acid producers. Other selective tools include resistance to high concentrations of citrate (Leopold, 1959), and sugars (Schreferl‐Kunar et al., 1989).
Yeasts of the Candida genus also excrete large amounts of citric acid and isocitric acid. The key of the yeast citrate process appears to be a sharp drop in intracellular AMP following nitrogen depletion, inhibiting the AMP‐requiring isocitrate dehydrogenase. Candida guilliermondii excretes large quantities of citric acid without the undesirable isocitric acid when cultured in the presence of metabolic inhibitors (such as sodium fluoracetate, n‐hexadecylcitric acid or trans‐aconitic acid). These inhibitors block the TCA cycle at the aconitase step. Mutation of Candida lipolytica to aconitase deficiency is also effective (Akiyama et al., 1973). The optimum pH for the yeast citrate process is above 5.0. Lower pH values lead to production of polyhydroxy compounds such as erythritol and arabitol (Tabuchi et al., 1973). The yeast process yields a conversion of 140–150% based on hydrocarbon used, a productivity of 1.4 g l−1 h−1 and a broth concentration as high as 225 g l−1 (Kubicek and Roehr, 1986). High concentrations of citric acid are also produced by Candida oleophila from glucose (Anastassiadis et al., 2002). In chemostats, 200 g l−1 can be made and more than 230 g l−1 can be produced in continuous repeated fed‐batch fermentations. This compares to 150–180 g l−1 by A. niger in industrial batch or fed‐batch fermentation in 6–10 days. The key to the yeast fermentation is nitrogen limitation coupled with an excess of glucose. The citric acid is secreted by a specific energy‐dependent transport system induced by intracellular nitrogen limitation. The transport system is selective for citrate over isocitrate. Yarrowia lipolytica produces up to 198 g l−1 citric acid in fed‐batch fermentations on sunflower oil with a very low production of isocitric acid (Aurich et al., 2003).
4.4.3 Lactic acid. The global market for lactic acid is about 250 000 tons per year (Industrial Biotechnology and Sustainable Chemistry, 2004). Rhizopus oryzae is favoured for production as it makes stereochemically pure l(+)‐lactic acid whereas lactobacilli produce mixed isomers; furthermore, lactobacilli require yeast extract. However, a mutant strain of Lactobacillus lactis has been developed which produces 195 g l−1l‐lactic acid from 200 g l−1 glucose (Bai et al., 2004) and a productivity of 1.76 g l−1 h−1. A better productivity (2.14 g l−1 h−1) was achieved with an exponential fed‐batch process using Lactobacillus casei which yielded 180 g l−1 (Ding and Tan, 2006). Rhizopus oryzae normally converts 60–80% of added glucose to lactate, the remainder going to ethanol. By increasing lactic dehydrogenase levels via cloning, more lactate and less ethanol were produced (Skory, 2004). Mutation of wild‐type R. oryzae led to l(+)‐lactic acid production of 131–136 g l−1, a yield from glucose of 86–90% and a productivity of 3.6 g l−1 h−1 (Ge et al., 2004). This was a 75% improvement over the wild‐type strain. The final strain was the result of a six‐step mutation sequence. A transgenic wine yeast genetically engineered to contain six copies of the bovine l‐lactate dehydrogenase gene produces l‐(+)‐lactate at 122 g l−1 (Saito et al., 2005). Whole genome shuffling has been used to improve the acid tolerance of a commercial lactic acid‐producing Lactobacillus sp. (Patnaik et al., 2002).
A recombinant E. coli strain has been constructed that produces optically active pure d‐lactic acid from glucose at virtually the theoretical maximum yield, e.g. two molecules from one molecule of glucose (Zhou et al., 2003). The organism was engineered by eliminating genes of competing pathways encoding fumarate reductase, alcohol/aldehyde dehydrogenase and pyruvate formate lyase, and by a mutation in the acetate kinase gene. d‐Lactic acid has been produced at 61 g l−1 by a recombinant strain of S. cerevisiae containing the d‐lactic dehydrogenase gene from Leuconostoc mesenteroides (Ishida et al., 2006).
Products in development are the non‐chlorinated solvent, ethyl lactate, and the bioplastic, polylactide. Polylactide is made by converting corn starch to dextrose, fermenting dextrose to lactic acid, condensing lactic acid to lactide, and polymerizing lactide.
4.4.4 Pyruvic acid. A recombinant strain of E. coli which is a lipoic acid auxotroph and defective in F1ATPase produces 31 g l−1 pyruvic acid from 50 g l−1 glucose (Yokota et al., 1994). The lowering of the energy level in the cell by the F1ATPase deletion increases glucose uptake and glycolysis rate, thereby leading to an increase in pyruvate production. An improved fermentation has been developed using Torulopsis glabrata yielding a pyruvic acid concentration of 77 g l−1, a conversion of 0.80 g g−1 glucose and a productivity of 0.91 g l−1 h−1 in 85 h (Li et al., 2002). By disrupting the gene encoding pyruvate decarboxylase, an improved strain of T. glabrata was obtained which produced 82 g l−1 pyruvate in 52 h (Wang et al., 2005). By directed evolution in a chemostat, a mutant S. cerevisiae strain was made which produces from glucose 135 g l−1 pyruvic acid at a rate of 6 to 7 mmol per gram biomass per hour during exponential growth with a yield of 0.54 g of pyruvate per gram of glucose (van Maris et al., 2004).
4.4.5 Fumaric acid. Fumaric acid is utilized by the plastics industry in polyester and alkyd resins, and the remainder goes to lesser volume uses such as rosin adducts, varnishes and foods. Rhizopus arrhizus can produces large amounts of fumaric acid when grown in the presence of glucose. From 120 g l−1 glucose, R. arrhizus can produce 97 g l−1 fumaric acid (Kenealy et al., 1986). The molar yield from glucose is 145% and involves CO2 fixation from pyruvate to oxaloacetate and the reductive reactions of the TCA cycle. The use of an integrated system of simultaneous fermentation–adsorption for the production and recovery of fumaric acid from glucose enhanced the fermentation rate, and sustained cell viability (Cao et al., 1996).
4.4.6 Other acids. Succinic acid is made chemically at 15 000 tons per year for commercial use as (i) a surfactant/detergent extender/foaming agent, (ii) an ion chelator in electroplating to prevent metal corrosion and pitting, (iii) an acidulant/pH modifier/flavouring agent/antimicrobial agent for food and (iv) a chemical in the production of pharmaceuticals (Zeikus et al., 1999). Market size is $400 million per year. Production by fermentation with Actinobacillus succinogenes amounts to 40 g l−1, a productivity of 7 g l−1 h−1, and a 76% yield from glucose (Urbance et al., 2004). Bioconversion from fumarate yields 85 g l−1 succinate after 24 h (Kang and Ryu, 1999). An A. succinogenes mutant resistant to flouroacetate reached 105 g l−1 and a productivity of 1.34 g l−1 h−1 (Guettler et al., 1996). Metabolic engineering of Mannheimia succiniciproducens led to a strain which produces 52 g l−1 succinic acid at a yield of 1.16 mol per mol glucose and a productivity of 1.8 g l−1 h−1 in fed‐batch culture (Lee et al., 2006). A titre of 99 g l−1 has been reached with recombinant E. coli yielding a productivity of 1.3 g l−1 h−1 (Vemuri et al., 2002).
Shikimic acid is the starting point for chemical synthesis of Tamiflu, an antiviral agent. Metabolic engineering of E. coli yielded an overproducer making 84 g l−1 shikimic acid with a 0.33 molar yield from glucose (Chandran et al., 2003). Shikimic acid (50–90 g l−1) can be produced in 30% (mol mol−1) yield from glucose with an E. coli aroL and aroK mutant which overexpresses aroF, aroB and aroE, and tktA and ppsA of central metabolism (Chandran et al., 2003; Kraemer et al., 2003). Dehydroshikimic acid is an antioxidant used for preservation of food, feed and other oxidative sensitive products, over extended periods of time and at elevated temperatures. This compound is produced at 69 g l−1 in 30% yield (mol mol−1) from glucose using an E. coli aroE mutant overexpressing two genes: tktA encoding transketolase and feedback‐insensitive aroF encoding DS (Li et al., 1999).
Itaconic acid production by the basidiomycete Pseudozyma antarctica grown under N‐limitation reached a level of 30 g l−1 from 80 g l−1 glucose (Levinson et al., 2006). The same titre is produced with A. niger with a yield from sucrose in molasses of 70%. The market amounts to 17 000 tons (Magnuson and Lasure, 2004).
Production of gluconic acid amounted to 150 g l−1 from 150 g l−1 glucose plus corn steep liquor in 55 h with A. niger (Znad et al., 2004). Production level is 50 000–60 000 tons per year (Industrial Biotechnology and Sustainable Chemistry, 2004; Anastassiadis et al., 2005). Aureobasidium pullulans can produce 504 g l−1 in fed‐batch fermentation and over 400 g l−1 in continuous fermentation (Anastassiadis et al., 2003). A mutant of G. oxydans in which membrane‐bound gluconate‐2‐dehydrogenase was inactivated, thus eliminating 2‐ketogluconate production, produced 5‐ketogluconic acid directly from glucose in 84% yield (Elfari et al., 2005). 5‐Ketogluconate is a precursor of l‐(+)‐tartaric acid used in the food and textile industries.
Cloning of fumarase in S. cerevisiae remarkably improved the malic acid bioconversion from fumaric acid from 2 g l−1 to 125 g l−1 (Neufeld et al., 1991). Conversion yield was near 90%.
Kojic acid production by Aspergillus oryzae was improved to 41 g l−1 by NTG mutagenesis of conidia followed by UV mutagenesis of protoplasts (Wan et al., 2004). The acid is used as an anti‐inflammatory drug, a precursor of flavour enhancers, an anti‐browning agent in foods, and a whitening agent and UV protectant in skin care products.
Adaptation of Propionibacterium acidipropionici to a fibrous‐bed bioreactor allowed production of 72 g l−1 propionic acid from glucose, as compared with 52 g l−1 in a fed‐batch fermentation (Suwannakham and Yang, 2005). The new process also decreased acetate and succinate production.
4.5 Ethanol and related compounds
4.5.1 Ethanol. Ethyl alcohol is produced in Brazil from cane sugar at over 4 billion gallons per year and is used either as a 22–25% blend or as a pure fuel. In the USA, 20 million barrels of petroleum are used daily; 60% of this is imported (Gray et al., 2006). Liquid fuels such as gasoline, diesel and jet fuel, all used for transportation, constitute 70% of the total. Ethanol was produced in the USA at over 4 billion gallons with the rest of the world producing about 8 billion gallons. The current market amounts to $15 billion. The USA uses corn and could produce up to 13 billion gallons per year from this source. It is chiefly used as an oxygenate added to gasoline to reduce CO2 emissions by improving overall oxidation of gasoline. The steady increase in consumption is due in part to phasing out of the use of methyl tert‐butyl ether (MBTE) as gasoline oxygenate, as ruled by many state legislatures in the USA.
Ethanol is a primary metabolite produced by fermentation of sugar, or of a polysaccharide that can be depolymerized to a fermentable sugar. Saccharomyces cerevisiae is used for the fermentation of hexoses, whereas Kluyveromyces fragilis is employed for lactose utilization. Pichia stipitis or Candida species can be used if a pentose is the substrate. Saccharomyces cerevisiae produces as high as 96.7 g l−1 ethanol in 96 h fermentation on sucrose (Caylak and Vardar, 1996), 70 g l−1 on sugar cane molasses in 30 h (Navarro et al., 2000) and 53 g l−1 on beet molasses in 192 h (Roukas, 1996).
Under optimum conditions, approximately 10–12% ethanol by volume can be obtained from sugar within 5 days. Such a high concentration slows down growth and the fermentation ceases. With special yeasts, the fermentation can be continued to produce alcohol concentrations of 20% by volume, but these concentrations are attained only after months or years of fermentation. At present, all beverage alcohol is made by fermentation. Industrial ethanol is mainly manufactured by fermentation, but some is still produced from ethylene by the petrochemical industry.
Further increases in ethanol production will have to come from biomass. Available biomass reserves are about 200 million dry tons per year. This could yield 16 billion gallons of ethanol based on an overall yield of 80 gallons per dry ton.
Bacteria such as clostridia and Zymomonas are being re‐examined for ethanol production after years of neglect. Clostridium thermocellum, an anaerobic thermophile, can convert waste cellulose (i.e. biomass) and crystalline cellulose directly to ethanol (Demain et al., 2005). If waste cellulose could be efficiently converted to ethanol, the available cellulosic feedstocks in the USA could supply 20 billion gallons of ethanol in comparison with the 5 billion gallons currently made from corn. This would be more than enough to add 10% ethanol to all gasoline used in the USA (Lynd et al., 2002). The US Department of Agriculture and US Department of Energy have estimated that 1 billion tons of biomass could be produced annually from this substrate which could yield 80 billion gallons of bioenergy, about 30% of current usage (Gray et al., 2006). Other clostridia produce acetate, lactate, acetone and butanol, and will be used to produce these chemicals when the global petroleum supplies begin to become depleted.
Fuel ethanol produced from biomass would provide relief from air pollution caused by the use of gasoline and would not contribute to the greenhouse effect. Escherichia coli has been converted into an excellent ethanol producer (43% yield, v/v) by recombinant DNA techniques. By cloning and expressing the alcohol dehydrogenase and pyruvate decarboxylase genes from Zymomonas mobilis in Klebsiella oxytoca, the recombinant strain was able to convert crystalline cellulose to ethanol in high yield when fungal cellulase was added (Doran and Ingram, 1993). Per cent of maximum theoretical yield was 81–86% and titres as high as 47 g l−1 ethanol were produced from 100 g l−1 cellulose. Other genetically engineered strains of E. coli can produce 60 g l−1 ethanol (Yomano et al., 1998). Ethanol production has been further increased by metabolic engineering (Nissen et al., 2000).
Most recombinant strains of E. coli, Zymomonas and Saccharomyces convert corn fibre hydrolysate to 21–35 g l−1 with yields of 0.41–0.50 ethanol per gram of sugar consumed (Bothast et al., 1999; Dien et al., 2000). For a recombinant E. coli strain making 35 g l−1, time was 55 h and yield was 0.46 g of ethanol per gram of available sugar, which is 90% of maximum attainable. Corn fibre contains 70% by weight of carbohydrate, made up of cellulose and hemicellulose. It is produced at 3.4 million dry tons per year which could yield up to 4 billion gallons of ethanol, assuming an 80% conversion. The best pre‐treatment of corn fibre appears to be dilute acid, which avoids production of inhibitory compounds such as furfural or 5‐hydroxymethyl furfural acid from lignin. Addition of cellulase and β‐glucosidase yielded 85–100% of theoretical yield of monomeric sugars (Saha and Bothast, 1999).
4.5.2 Glycerol. Glycerol has uses in the drug, food, cosmetics, paint and many other industries. Production of glycerol is usually performed by extraction of materials from the fat and oil industries, or by chemical synthesis from propylene, but good fermentations using S. cerevisiae and osmotolerant yeasts are available (Wang et al., 2001; Taherzadeh et al., 2002). Six hundred thousand tons of glycerol are produced annually. A number of studies are being performed using physiological control and genetic engineering in the hopes of making the fermentation process competitive. Saccharomyces cerevisiae can produce up to 230 g l−1 glycerol (Kalle and Naik, 1985; Vikar and Panesar, 1987). Osmotolerant yeast strains (Candida glycerinogenes) can produce 137 g l−1 with yields of 63–65% and a productivity of 32 g l−1 day−1 (Zhuge et al., 2001). Candida magnoliae produces 170 g l−1 in a fed‐batch fermentation (Peterson et al., 1958) and in a similar type of process, Pichia farinosa can produce up to 300 g l−1 (Vijaikishore and Karanth, 1986).
4.5.3 1,3‐Propanediol. A strain of Clostridium butyricum converts glycerol to 1,3‐propanediol (PDO) at a yield of 0.55 g per gram of glycerol consumed (Papanikolaou et al., 2000). In a two‐stage continuous fermentation, a titre of 41–46 g l−1 was achieved with a maximum productivity of 3.4 g l−1 h−1. At lower dilution rates, butyrate was produced, and at higher dilution rates, acetate was made. Recent metabolic engineering triumphs have included the development of an E. coli culture that grows on glucose and produces PDO at 135 g l−1, with a yield of 51% and a rate of 3.5 g l−1 h−1 (Sanford et al., 2004). To do this, they introduced eight new genes to convert dihydroxyacetone phosphate (DHAP) into PDO. These included yeast genes converting dihydroxyacetone to glycerol and Klebsiella pneumoniae genes converting glycerol to PDO. They improved production in the recombinant by modifying 18 E. coli genes, including regulatory genes. PDO is the monomer used to chemically synthesize industrial polymers such as polyurethanes and the polyester fibre SoronoTm by DuPont. This new bioplastic is polytrimethylene terephthalate (3GT polyester) made by reacting terephthalic acid with PDO (Nakamura and Whited, 2003). PDO is also used as a polyglycol‐like lubricant and as a solvent.
4.5.4 Erythritol. The non‐cariogenic, non‐caloric and diabetic‐safe sweetener erythritol is made by fermentation. It has 70–80% the sweetness of sucrose. Osmotic pressure increase was found to raise volumetric and specific production, but to decrease growth of Triginopsis variabilis, the producer (Kim et al., 1997). By growing cells first at a low glucose level, i.e. 100 g l−1 and then adding 200 g l−1 glucose at 2.5 days, erythritol titre was increased to 45 g l−1 as compared with a single‐stage fermentation with 300 g l−1 glucose which yielded only 24 g l−1. In both cases, 150 g l−1 glucose remained at the end. Production of erythritol by a C. magnoliae osmophilic mutant yielded a titre of 187 g l−1, a rate of 2.8 g l−1 h−1 and 41% conversion from glucose (Ryu et al., 2000). Other processes have been carried out with Aureobasidium sp. (165 g l−1 from glucose with a 48% yield) (Ishizuka et al., 1989) and the osmophile Trichosporon sp. (188 g l−1 with a productivity of 1.18 g l−1 h−1 and 47% conversion (Park et al., 1998). Erythritol can also be produced from sucrose by Torula sp. at 200 g l−1 in 120 h with a yield of 50% and a productivity of 1.67 g l−1 h−1 (Kim et al., 2000).
4.5.5 Dihydroxyacetone. Dihydroxyacetone (DHA) is used as a cosmetic tanning agent and as an intermediate for production of chemicals and surfactants (Deppenmeier et al., 2002). It is produced from glycerol by Gluconobacter species. A 90% conversion from 200 g l−1 glycerol has been obtained. Overexpression of the gene coding for the glycerol dehydrogenase (sldAB) increases glycerol oxidation and improves the DHA formation rate, as well as the final DHA concentration (Gätgens et al., 2007).
4.5.6 Mannitol. d ‐Mannitol is a naturally occurring polyol, widely used in the food, chemical and pharmaceutical industries. About 40 000 tons are produced annually. It is only poorly metabolized by humans, is about half as sweet as sucrose and is considered to be a low‐calorie sweetener. It is produced mainly by catalytic hydrogenation of glucose/fructose mixtures but 75% of the product is sorbitol, not mannitol. For this reason, fermentation processes are being considered. Several heterofermentative lactic acid bacteria from the genera Lactobacillus and Leuconostoc have been reported to produce mannitol from fructose (Yun and Kim, 1998). An inexpensive medium containing molasses, fructose syrup, soy peptone and corn steep liquor was developed for production of 105 g l−1 mannitol by Lactobacillus intermedius (Saha, 2006b). Manganese added at 0.033 g l−1 allowed this microorganism to convert 300 g l−1 fructose to 201 g l−1 mannitol and 62 g l−1 lactic acid (Saha, 2006a). Recombinant E. coli produced up to 91 g l−1 mannitol (Kaup et al., 2004) and Leuconostoc sp. up to 98 g l−1 (von Weymarn et al., 2002). Mannitol production reached 223 g l−1 using C. magnoliae with Ca2+ and Cu2+ supplementation (Lee et al., 2007).
4.5.7 Sorbitol. This polyol, also called d‐glucitol, is 60% as sweet as sucrose and has use in the food, pharmaceutical and other industries. Its worldwide production is estimated to be higher than 500 000 tons per year and it is made chemically by catalytic hydrogenation of d‐glucose. Several microorganisms have been tested for the production of sorbitol, but only a few of them have been suggested as potential sorbitol producers, including three yeast strains and the ethanol‐producing bacterium Z. mobilis. Toluenized (permeabilized) cells of Z. mobilis produce 290 g l−1 sorbitol and 283 g l−1 gluconic acid from a glucose and fructose mixture in 16 h with yields near 95% for both products (Chun and Rogers, 1988). This and other potential processes have been reviewed by Silveira and Jonas (2002). Metabolic engineering of Lactobacillus plantarum for high sorbitol production was successfully achieved by a simple two‐step strategy [overexpressing the two sorbitol 6‐phosphate dehydrogenase genes (srlD1 and srlD2) identified in the genome sequence]. However, the use of L. plantarum as a cell factory for polyol production requires further optimization of conversion efficacy (Ladero et al., 2007).
4.5.8 Xylitol. Xylitol is a naturally occurring sweetener with anticariogenic properties and use in some diabetes patients. It can be produced chemically by chemical reduction of d‐xylose. A mutant of Candida tropicalis produces 40 g l−1 from d‐xylose with over a 90% yield (Gong et al., 1981). Better xylitol production (150 g l−1) was obtained with C. guilliermondii 2581 at pH 6.0 and shaking at 60 r.p.m. (Zagustina et al., 2001). Under these conditions, the substrate concentration (150 g l−1) was totally consumed.
4.5.9 Acetone/butanol. Early in the 19 century, the acetone‐butanol fermentation process was a commercial operation but was later replaced by chemical synthesis from petroleum because of economic factors. These included the low concentration of butanol in the broth (1%) and the high cost of butanol recovery. Early work has been reviewed by McNeil and Kristiansen (1986).
Clostridium beijerinckii and Clostridium acetobutylicum are the organisms of choice for the fermentation. The latter was isolated by Chaim Weizmann in England due to the need during World War I for acetone to be used in explosives. Weizmann was commissioned by Winston Churchill, the First Lord of the Admiralty, to develop a microbial acetone process. The organism mainly produces butanol and acetone but also smaller amounts of acetate, butyrate and ethanol. After the war, the fermentation was used to supply butanol, an excellent solvent to act as a quick‐drying lacquer for car bodies in a rapidly expanding US automotive industry. The fermentation became important again at the start of World War II as a source of acetone for manufacture of munitions. Weizmann became the first President of the new State of Israel in the late 1940s. However, in the 1950s, the process was replaced by production from petroleum. Problems included the cost of substrate, the cost of recovery and the toxicity of butanol to the microbe. At 13 g l−1, growth essentially stopped.
Despite the above, research on this fermentation has continued over many years, dealing with process engineering, mutation and metabolic engineering (Mermelstein et al., 1993). Butanol‐resistant mutants showed increased production of butanol and acetone (Hermann et al., 1985). Biochemical engineering modifications were able to increase total acetone, butanol and ethanol production (ABE) to 69 g l−1 (Qureshi et al., 1992). A mutant in the presence of added acetate was able to produce from glucose almost 21 g l−1 butanol and 10 g l−1 acetone from glucose (Chen and Blaschek, 1999). Acetate both stimulates production and helps stabilize the culture. The parent culture was known to be highly unstable (Kashket and Cao, 1995). A continuous flow process using degermed corn has been developed recently (Ezeji et al., 2007).
Biobutanol is looked upon as a more favourable future fuel than bioethanol. Butanol has one‐third higher energy content than ethanol and automobile engines do not require modification until the percentage of butanol reaches 40% of the total; ethanol requires modification when it reaches over 15% of the total fuel mixture (Schwarz and Gapes, 2006).
4.6 Glucosamine
Glucosamine is used for osteoarthritis and is made by acid hydrolysis of chitin from shellfish waste. As many patients have shellfish allergies, a fermentation source is desirable. Metabolic engineering of E. coli yielded a process producing 17 g l−1 glucosamine (Deng et al., 2005). In this strain, glucosamine synthase was overexpressed, glucosamine degradative genes were inactivated, and the inhibition of glucosamine synthase by glucosamine was decreased by mutational modification of the enzyme via error‐prone PCR. Overexpression of a heterologous glucosamine‐6‐P‐N acetyltransferase yielded a strain making 110 g l−1N‐acetylglucosamine which is easily converted to glucosamine by mild acid hydrolysis.
Acknowledgments
We thank to Beatriz Ruiz for her assistance during the development of this review. We also acknowledge the valuable advice on various points given generously by the following scientists: Susan H. Fisher, Lee R. Lynd, George A. Marzluf, A.C. Matin, Chester W. Price and Abraham L. Sonenshein.
References
- Ahn K, Kornberg A. Polyphosphate kinase from Escherichia coli. Purification and demonstration of a phosphoenzyme intermediate. J Biol Chem. 1990;265:11734–11739. [PubMed] [Google Scholar]
- Akiyama S, Suzuki T, Sumino Y, Nakao Y, Fukuda H. Isolation and citric acid productivity of fluoroacetate‐sensitive mutant strains of Candida lipolytica. Agric Biol Chem. 1973;37:879–884. [Google Scholar]
- Al‐Obaidy Z, Berry D.R. The use of deionized date syrup as a substrate for citric acid fermentation. Biotechnol Lett. 1979;1:153–158. [Google Scholar]
- Anastassiadis S.G, Aivasidis A, Wandrey C. Citric acid production by Candida strains under intra cellular nitrogen limitation. Appl Microbiol Biotechnol. 2002;60:81–87. doi: 10.1007/s00253-002-1098-1. [DOI] [PubMed] [Google Scholar]
- Anastassiadis S, Aivasidis A, Wandrey C. Continuous gluconic acid production by isolated yeast‐like mould strains of Aureobasidium pullulans. Appl Microbiol Biotechnol. 2003;61:110–117. doi: 10.1007/s00253-002-1180-8. [DOI] [PubMed] [Google Scholar]
- Anastassiadis S, Aivasidis A, Wandrey C, Rehm H.‐J. Process optimization of continuous gluconic acid fermentation by isolated yeast‐like strains of Aureobasidium pullulans. Biotechnol Bioeng. 2005;91:494–501. doi: 10.1002/bit.20533. [DOI] [PubMed] [Google Scholar]
- Anderson D.I, Roth J.R. Mutations affecting regulation of cobinamide biosynthesis in Salmonella typhimurium. J Bacteriol. 1989;171:6726–6733. doi: 10.1128/jb.171.12.6726-6733.1989. [DOI] [PMC free article] [PubMed] [Google Scholar]
- Arst H.N, Jr, Bailey C.R. The regulation of carbon metabolism. In: Smith J.E, Pateman J.A, editors. Academic Press; 1977. pp. 131–145. [Google Scholar]
- Asahi S, Izawa M, Doi M. Effects of homoserine dehydrogenase deficiency on production of cytidine by mutants of Bacillus subtilis. Biosci Biotechnol Biochem. 1996;60:353–354. doi: 10.1271/bbb.60.353. [DOI] [PubMed] [Google Scholar]
- Asakura Y, Kimura E, Usuda Y, Kawahara Y, Matsui K, Osumi T, Nakamatsu T. Altered metabolic flux due to deletion of odhA causes l‐glutamate overproduction in Corynebacterium glutamicum. Appl Environ Microbiol. 2007;73:1308–1319. doi: 10.1128/AEM.01867-06. [DOI] [PMC free article] [PubMed] [Google Scholar]
- Aurich A.A, Foerster A, Mauersberger S, Barth G, Stottmeister U. Citric acid production from renewable resources by Yarrowia lipolytica. Biotechnol Adv. 2003;21:454–455. [Google Scholar]
- Backman K, O'Connor M.J, Maruya A, Rudd E, McKay D, Balakrishnan R. Genetic engineering of metabolic pathways applied to the production of phenylalanine. Ann N Y Acad Sci. 1990;589:16–24. doi: 10.1111/j.1749-6632.1990.tb24231.x. et al. [DOI] [PubMed] [Google Scholar]
- Bai D.‐M, Zhao X.‐M, Li X.‐G, Xu S.‐M. Strain improvement and metabolic flux analysis in the wild‐type and a mutant Lactobacillus lactis strain for l(+)‐lactic acid production. Biotechnol Bioeng. 2004;88:681–689. doi: 10.1002/bit.20274. [DOI] [PubMed] [Google Scholar]
- Bailey J.E, Shurlati A, Hatzimanikatis V, Lee K, Renner W.A, Tsai P.S. Inverse metabolic engineering: a strategy for directed genetic engineering of useful phenotypes. Biotechnol Bioeng. 1996;52:109–121. doi: 10.1002/(SICI)1097-0290(19961005)52:1<109::AID-BIT11>3.0.CO;2-J. [DOI] [PubMed] [Google Scholar]
- Barker D.F, Campbell A.M. Genetic and biochemical characterization of the birA gene and its product: evidence for a direct role of biotin holoenzyme synthetase in repression of the biotin operon in Escherichia coli. J Molec Biol. 1981;146:469–492. doi: 10.1016/0022-2836(81)90043-7. [DOI] [PubMed] [Google Scholar]
- Barkovich R, Liao J.C. Metabolic engineering of isoprenoids. Metab Eng. 2001;3:27–39. doi: 10.1006/mben.2000.0168. [DOI] [PubMed] [Google Scholar]
- Beppu T. Genetic organization of Acetobacter for acetic acid fermentation. Antonie Van Leeuwenhoek. 1993;64:121–135. doi: 10.1007/BF00873022. [DOI] [PubMed] [Google Scholar]
- Blencke H.‐M, Homuth G, Ludwig H, Maeder U, Hecker M, Stuelke J. Transcriptional profiling of gene expression in response to glucose in Bacillus subtilis: regulation of the central metabolic pathways. Metab Eng. 2003;5:133–149. doi: 10.1016/s1096-7176(03)00009-0. [DOI] [PubMed] [Google Scholar]
- Bloom F, Smith C.J, Jessee J, Veileux B, Deutch A.H. The use of genetically engineered strains of Escherichia coli for the overproduction of free amino acids: proline as a model system. In: Downey K, Voellmy R.W, editors. Academic Press; 1984. pp. 383–394. [Google Scholar]
- Bongaerts J, Kraemer M, Mueller U, Raeven L, Wubbolts M. Metabolic engineering for microbial production of aromatic amino acids and derived compounds. Metab Eng. 2001;3:289–300. doi: 10.1006/mben.2001.0196. [DOI] [PubMed] [Google Scholar]
- Bonner E.R, D'Elia J.N, Billips B.K, Switzer R.L. Molecular recognition of pyr mRNA by the Bacillus subtilis attenuation regulatory protein PyrR. Nucleic Acids Res. 2001;29:4851–4865. doi: 10.1093/nar/29.23.4851. [DOI] [PMC free article] [PubMed] [Google Scholar]
- Botsford J.L, Harman J.G. Cyclic AMP in prokaryotes. Microbiol Rev. 1992;56:100–122. doi: 10.1128/mr.56.1.100-122.1992. [DOI] [PMC free article] [PubMed] [Google Scholar]
- Bothast R.J, Nichols N.N, Dien B.S. Fermentations with new recombinant organisms. Biotechnol Prog. 1999;15:867–875. doi: 10.1021/bp990087w. [DOI] [PubMed] [Google Scholar]
- Bower S.G, Perkins J, Yocum R.R, Pero J.G. 2001. ., and ) Biotin biosynthesis in Bacillus subtilis. US patent 6303377.
- Bremus C, Herrmann U, Bringer‐Meyer S, Sahm H. The use of microorganisms in l‐ascorbic acid production. J Biotechnol. 2006;124:196–205. doi: 10.1016/j.jbiotec.2006.01.010. [DOI] [PubMed] [Google Scholar]
- Brenner S, Johnson M, Bridgham J, Golda G, Lloyd D.H, Johnson D, Luo S. Gene expression analysis by massively parallel signature sequencing (MPSS) on microbead arrays. Nat Biotechnol. 2000;18:630–634. doi: 10.1038/76469. et al. [DOI] [PubMed] [Google Scholar]
- Bresler S.E, Glazunov E.A, Chernik T.P, Shevchenko T.N, Perumov D.A. Study of the riboflavin operon of Bacillus subtilis. V. Flavin mononucleotide and flavin‐adenine dinucleotide as effectors in the riboflavin operon. Genetika. 1973;9:84–91. [Google Scholar]
- Broer S, Eggeling L, Kraemer R. Strains of Corynebacterium glutamicum with different lysine productivities may have different lysine excretion systems. Appl Environ Microbiol. 1993;59:316–321. doi: 10.1128/aem.59.1.316-321.1993. [DOI] [PMC free article] [PubMed] [Google Scholar]
- Burkovski A, Kraemer R. Bacterial amino acid transport proteins: occurrence, functions, and significance for biotechnological applications. Appl Microbiol Biotechnol. 2002;58:265–274. doi: 10.1007/s00253-001-0869-4. [DOI] [PubMed] [Google Scholar]
- Business Communications Company. 2005. ) Amino acids: highlighting synthesis applications [WWW document]. URL http://www.bccresearch.com.
- Cao N, Du J, Gong C.S, Tsao T. Simultaneous production and recovery of fumaric acid from immobilized Rhizopus oryzae with a rotary biofilm contactor and an adsorption column. Appl Environ Microbiol. 1996;62:2926–2931. doi: 10.1128/aem.62.8.2926-2931.1996. [DOI] [PMC free article] [PubMed] [Google Scholar]
- Cashel M, Gentry D.R, Hernandez V.H, Vinella D. The stringent response. In: Neidhardt F.C, editor. ASM Press; 1996. pp. 1458–1496. ., and . In Escherichia coli and Salmonella. . (ed.). Washington, USA: , pp. [Google Scholar]
- Causey T.B, Zhou S, Shanmugam K.T, Ingram L.O. Engineering the metabolism of Escherichia coli W3110 for the conversion of sugar to redox‐neutral and oxidized products: homoacetate production. Proc Natl Acad Sci USA. 2003;100:825–832. doi: 10.1073/pnas.0337684100. [DOI] [PMC free article] [PubMed] [Google Scholar]
- Caylak B, Vardar S.F. Comparison of different production processes for bioethanol. Turk J Chem. 1996;22:351–359. [Google Scholar]
- Chandran S.S, Yi J, Draths K.M, Von Daeniken R, Weber W, Frost J.W. Phosphoenolpyruvate availability and the biosynthesis of shikimic acid. Biotechnol Prog. 2003;19:808–814. doi: 10.1021/bp025769p. [DOI] [PubMed] [Google Scholar]
- Chen C.‐K, Blaschek H.P. Acetate enhances solvent production and prevents degeneration in Clostridium beijerinckii BA101. Appl Microbiol Biotechnol. 1999;52:170–173. doi: 10.1007/s002530051504. [DOI] [PubMed] [Google Scholar]
- Chock P.B, Rhee S.G, Stadtman E.R. Interconvertible enzyme cascades in cellular regulation. Annu Rev Biochem. 1980;49:813–843. doi: 10.1146/annurev.bi.49.070180.004121. [DOI] [PubMed] [Google Scholar]
- Choi Y.J, Tribe D.E. Continuous production of phenylalanine using an Escherichia coli regulatory mutant. Biotechnol Lett. 1982;4:223–228. [Google Scholar]
- Chun U.H, Rogers P.L. The simultaneous production of sorbitol and gluconic acid by Zymomonas mobilis. Appl Microbiol Biotechnol. 1988;29:19–24. [Google Scholar]
- Colon G.E, Nguyen T.T, Jetten M.S.M, Sinskey A.J, Stephanopoulos G. Production of isoleucine by overexpresison of ilvA in Corynebacterium lactofermentum threonine producer. Appl Microbiol Biotechnol. 1995;43:482–488. doi: 10.1007/BF00218453. [DOI] [PubMed] [Google Scholar]
- Coppee J.Y, Auger S, Turlin E, Sekowska A, Le Caer J.P, Labas V. Sulfur‐limitation‐regulated proteins in Bacillus subtilis: a two‐dimensional gel electrophoresis study. Microbiology. 2001;147:1631–1640. doi: 10.1099/00221287-147-6-1631. et al. [DOI] [PubMed] [Google Scholar]
- Crouzet J, Cameron B, Blanche F, Thibaut D, Debussche L. Genes of coenzyme B12 biosynthesis in an industrial Pseudomonas denitrificans strain. In: Baltz R.H, Hegeman G.D, Skatrud P.L, editors. American Society for Microbiology; 1993. pp. 195–202. [Google Scholar]
- Cubero B, Scazzochio C. Two different, adjacent and divergent zinc finger binding sites are necessary for CREA‐mediated carbon catabolite repression in the proline gene cluster of Aspergillus nidulans. EMBO J. 1994;13:407–415. doi: 10.1002/j.1460-2075.1994.tb06275.x. [DOI] [PMC free article] [PubMed] [Google Scholar]
- Dadssi M, Cozzone A.J. Cyclic AMP independence of Escherichia coli protein phosphorylation. FEBS Lett. 1985;186:187–190. doi: 10.1016/0014-5793(85)80705-5. [DOI] [PubMed] [Google Scholar]
- Das K, Anis M, Azemi B.M.N, Ismail N. Fermentation and recovery of glutamic acid from palm waste hydrolysate by ion‐exchange resin column. Biotechnol Bioeng. 1995;48:551–555. doi: 10.1002/bit.260480519. [DOI] [PubMed] [Google Scholar]
- De Reuse H, Danchin A. Positive regulation of the pts operon of Escherichia coli: genetic evidence for a signal transduction mechanism. J Bacteriol. 1991;173:727–733. doi: 10.1128/jb.173.2.727-733.1991. [DOI] [PMC free article] [PubMed] [Google Scholar]
- DeBaets S, Vandedrinck S, Vandamme E.J. Vitamins and related biofactors, microbial production. In: Lederberg J, editor. 2nd. Academic Press; 2000. pp. 837–853. [Google Scholar]
- DeBusk R.M, Ogilvie S. Regulation of amino acid utilization in Neurospora crassa: effect of nmr‐1 and ms‐5 mutations. J Bacteriol. 1984;160:656–661. doi: 10.1128/jb.160.2.656-661.1984. [DOI] [PMC free article] [PubMed] [Google Scholar]
- Debabov V.G. The threonine story. Adv Biochem Eng Biotechnol. 2003;79:113–136. doi: 10.1007/3-540-45989-8_4. [DOI] [PubMed] [Google Scholar]
- Del Castillo T, Ramos J.‐L. Simultaneous catabolite repression between glucose and toluene metabolism in Pseudomonas putida is channeled through different signaling pathways. J Bacteriol. 2007;189:6602–6610. doi: 10.1128/JB.00679-07. [DOI] [PMC free article] [PubMed] [Google Scholar]
- Delaunay S, Gourdon P, Lapujade P, Mailly E, Oriol E, Engasser J.M. An improved temperature‐triggered process for glutamate production with Corynebacterium glutamicum. Enzyme Microb Technol. 1999;25:762–768. et al. [Google Scholar]
- Demain A.L. Microbial production of food additives. Symp Soc Gen Microbiol. 1971;21:77–101. [Google Scholar]
- Demain A.L. Production of nucleotides by micro‐organisms. In: Rose A.H, editor. Academic Press; 1978. pp. 187–208. [Google Scholar]
- Demain A.L, Birnbaum J. Alteration of permeability for the release of metabolites from the microbial cell. Curr Top Microbiol. 1968;46:1–25. doi: 10.1007/978-3-642-46121-7_1. [DOI] [PubMed] [Google Scholar]
- Demain A.L, Newcomb M, Wu J.H.D. Cellulase, clostridia, and ethanol. Microbiol Molec Biol Rev. 2005;69:124–154. doi: 10.1128/MMBR.69.1.124-154.2005. [DOI] [PMC free article] [PubMed] [Google Scholar]
- Deng M.‐D, Severson D.K, Grund A.D, Wassink S.L, Burlingame R.P, Berry A. Metabolic engineering of Escherichia coli for industrial production of glucosamine and N‐acetylglucosamine. Metab Eng. 2005;7:201–214. doi: 10.1016/j.ymben.2005.02.001. et al. [DOI] [PubMed] [Google Scholar]
- Deppenmeier U, Hoffmeister M, Prust C. Biochemistry and biotechnological applications of Gluconobacter strains. Appl Microbiol Biotechnol. 2002;60:233–242. doi: 10.1007/s00253-002-1114-5. [DOI] [PubMed] [Google Scholar]
- Dien B.S, Nichols N.N, O'Bryan P.J, Bothast R.J. Development of new ethanologenic Escherichia coli strains for fermentation of lignocellulosic biomass. Appl Biochem Biotechnol. 2000;84/(86):181–196. [PubMed] [Google Scholar]
- Ding S, Tan T. l‐Lactic acid production by Lactobacillus casei fermentation using different fed‐batch feeding strategies. Proc Biochem. 2006;411:1451–1454. [Google Scholar]
- Doi M, Asahi S, Tsunemi Y, Akiyama S.‐I. Mechanism of uridine production by Bacillus subtilis mutants. Appl Microbiol Biotechnol. 1989;30:234–238. [Google Scholar]
- Doran J.B, Ingram L.O. Fermentation of crystalline cellulose to ethanol by Klebsiella oxytoca containing chromosomally integrated Zymomonas mobilis genes. Biotechnol Prog. 1993;9:533–538. [Google Scholar]
- Drysdale M.R, Kolze S.E, Kelly J.M. The Aspergillus niger carbon catabolite repressor encoding gene, creA. Gene. 1993;130:241–245. doi: 10.1016/0378-1119(93)90425-3. [DOI] [PubMed] [Google Scholar]
- Eggeling L, Sahm H. The cell wall barrier of Corynebacterium glutamicum and amino acid efflux. J Biosci Bioeng. 2001;92:201–213. [Google Scholar]
- Eggeling L, Sahm H, De Graaf A.A. Quantifying and directing metabolic flux: application to amino acid overproduction. Adv Biochem Eng Biotechnol. 1996;54:1–30. [Google Scholar]
- Eggeling L, Morbach S, Sahm H. The fruits of molecular physiology: engineering the l‐isoleucine biosynthesis pathway in Corynebacterium glutamicum. J Biotechnol. 1997;56:167–182. [Google Scholar]
- El‐mansi M. Flux to acetate and lactate excretions in industrial fermentations: physiological and biochemical implications. J Indust Microbiol Biotechnol. 2004;31:295–300. doi: 10.1007/s10295-004-0149-2. [DOI] [PubMed] [Google Scholar]
- Elderkin S, Bordes P, Jones S, Rappas M, Buck M. Molecular determinants for PspA‐mediated repression of the AAA transcriptional activator PspF. J Bacteriol. 2005;187:3238–3248. doi: 10.1128/JB.187.9.3238-3248.2005. [DOI] [PMC free article] [PubMed] [Google Scholar]
- Elfari M, Ha S.‐W, Oremus C, Merfort M, Khodaverdi V, Herrmann U. Gluconobacter oxydans mutant converting glucosa almost quantitatively to 5‐keto‐d‐gluconic acid. Appl Microbiol Biotechnol. 2005;66:668–674. doi: 10.1007/s00253-004-1721-4. et al. [DOI] [PubMed] [Google Scholar]
- Elhariry H, Kawasaki H, Auling G. Recent advances in microbial production of flavour enhancers for the food industry. Recent Res Devel Microbiol. 2004;8:15–39. [Google Scholar]
- Eraso P, Gancedo J.M. Catabolite repression in yeasts is not associated with low levels of cAMP. Eur J Biochem. 1984;141:195–198. doi: 10.1111/j.1432-1033.1984.tb08174.x. [DOI] [PubMed] [Google Scholar]
- Erdmann A, Weil B, Kraemer R. Lysine secretion in Corynebacterium glutamicum wild type triggered by dipeptide uptake. J Gen Microbiol. 1993;139:3115–3122. [Google Scholar]
- Escalante‐Semerena J.C, Suh S.J, Roth J.R. cobA function is required for both de novo cobalamin biosynthesis and assimilation of exogenous corrinoids in Salmonella typhimurium. J Bacteriol. 1990;172:273–280. doi: 10.1128/jb.172.1.273-280.1990. [DOI] [PMC free article] [PubMed] [Google Scholar]
- Esteban R, Nebreda A.R, Villanueva J.R, Villa T.G. Possible role of cAMP in the synthesis of β‐glucanases and β‐xylanases of Bacillus circulans WL‐12. FEMS Microbiol Lett. 1984;23:91–94. [Google Scholar]
- Ezeji T, Qureshi N, Blaschek H.P. Production of acetone‐butanol‐ethanol (ABE) in a continuous flow bioreactor using degermed corn and Clostridium beijerinckii. Proc Biochem. 2007;42:34–39. [Google Scholar]
- Feng B, Marzluff G.A. Interaction between major nitrogen regulatory protein NIT2 and pathway‐specific regulatory protein NIT4 is required for their synergistic activation of gene expression in Neurospora crassa. Molec Cell Biol. 1998;18:3983–3990. doi: 10.1128/mcb.18.7.3983. [DOI] [PMC free article] [PubMed] [Google Scholar]
- Feng B, Haas H, Marzluf G.A. ASD4, a new GATA factor of Neurospora crassa, displays sequence‐specific DNA binding and functions in ascus and ascospore development. Biochemistry. 2000;39:11065–11073. doi: 10.1021/bi000886j. [DOI] [PubMed] [Google Scholar]
- Fernandez R, Herrero P, Moreno F. Inhibition and inactivation of glucose‐phosphorylating enzymes from Saccharomyces cerevisiae by d‐xylose. J Gen Microbiol. 1985;131:2705–2709. doi: 10.1099/00221287-131-10-2705. [DOI] [PubMed] [Google Scholar]
- Fisher S.H. Regulation of nitrogen metabolism in Bacillus subtilis: vive la difference! Mol Microbiol. 1999;32:223–232. doi: 10.1046/j.1365-2958.1999.01333.x. [DOI] [PubMed] [Google Scholar]
- Fisher S.H, Sonenshein A.L. Control of carbon and nitrogen metabolism in Bacillus subtilis. Annu Rev Microbiol. 1991;45:107–135. doi: 10.1146/annurev.mi.45.100191.000543. [DOI] [PubMed] [Google Scholar]
- Friden P, Schimmel P. LEU3 of Saccharomyces cerevisiae activates multiple genes for branched‐chain amino acid biosynthesis by binding to a common decanucleotide core sequence. Mol Cell Biol. 1988;8:2690–2697. doi: 10.1128/mcb.8.7.2690. [DOI] [PMC free article] [PubMed] [Google Scholar]
- Fu Y.‐H, Marzluf G.A. cys‐3, the positive‐acting sulfur regulatory gene of Neurospora crassa, encodes a sequence‐specific DNA‐binding protein. J Biol Chem. 1990;265:11942–11947. [PubMed] [Google Scholar]
- Furukawa S, Ozaki A, Nakanishi T. l‐threonine production by l‐aspartate‐ and l‐homoserine‐resistant mutant of Escherichia coli. Appl Microbiol Biotechnol. 1988;29:550–553. [Google Scholar]
- Gätgens C, Degner U, Bringer‐Meyer S, Herrmann U. Biotransformation of glycerol to dihydroxyacetone by recombinant Gluconobacter oxydans DSM 2343. Appl Microbiol Biotechnol. 2007;76:553–559. doi: 10.1007/s00253-007-1003-z. [DOI] [PubMed] [Google Scholar]
- Gagyi C, Bucurenci N, Sirbu O, Labesse G, Ionescu M, Ofiteru A. UMP kinase from the Gram‐positive bacterium Bacillus subtilis is strongly dependent on GTP for optimal activity. Eur J Biochem. 2003;270:3196–3204. doi: 10.1046/j.1432-1033.2003.03702.x. et al. [DOI] [PubMed] [Google Scholar]
- Gallant J.A. Stringent control in E. coli. Annu Rev Genet. 1979;13:393–415. doi: 10.1146/annurev.ge.13.120179.002141. [DOI] [PubMed] [Google Scholar]
- Garcia‐Vallve S. Contribution of each complex of the mitochondrial respiratory chain in the generation of the proton‐motive force. Biochem Mol Biol Educ. 2004;32:17–19. doi: 10.1002/bmb.2004.494032010308. [DOI] [PubMed] [Google Scholar]
- Ge C.‐M, Gu S.‐B, Zhou X.‐H, Yao J.‐M, Pan R.‐R, Yu Z.‐L. Breeding of l(+)‐lactic acid producing strain by low‐energy ion implantation. J Microbiol Biotechnol. 2004;14:363–366. [Google Scholar]
- Georgi T, Rittmann D, Wendisch V.F. Lysine and glutamate production by Corynebacterium glutamicum on glucose, fructose and sucrose: roles of malic enzyme and fructose 1,6‐biphosphatase. Metab Eng. 2005;7:291–301. doi: 10.1016/j.ymben.2005.05.001. [DOI] [PubMed] [Google Scholar]
- Giridhar R.N, Srivastava A.K. Productivity improvement in l‐sorbose biosynthesis by fedbatch cultivation of Gluconobacter oxydans. J Biosci Bioeng. 2002;94:34–38. doi: 10.1263/jbb.94.34. [DOI] [PubMed] [Google Scholar]
- Glanemann C, Loos A, Gorret N, Willis L.B, O'Brien X.M, Lessard P.A, Sinskey A.J. Disparity between changes in mRNA abundance and enzyme activity in Corynebacterium glutamicum: implications for DNA microarray analysis. Appl Microbiol Biotechnol. 2003;61:61–68. doi: 10.1007/s00253-002-1191-5. [DOI] [PubMed] [Google Scholar]
- Gong C.‐S, Chen L.F, Tsao G.T. Quantitative production of xylitol from d‐xylose by a high‐xylitol producing yeast mutant Candida tropicalis HXP2. Biotechnol Lett. 1981;3:125–130. [Google Scholar]
- Gottesman S. Bacterial regulation: global regulatory networks. Annu Rev Genet. 1984;18:415–441. doi: 10.1146/annurev.ge.18.120184.002215. [DOI] [PubMed] [Google Scholar]
- Gray K.A, Zhao L, Emptage M. Bioethanol. Curr Opin Chem Biol. 2006;10:141–146. doi: 10.1016/j.cbpa.2006.02.035. [DOI] [PubMed] [Google Scholar]
- Guettler M, Jain M.K, Rumle D. 1996.
- Gutowski J.C, Schrier H.J. Interaction of the Bacillus subtilis glnRA repressor with operator and promoter sequences in vivo. J Bacteriol. 1992;174:671–681. doi: 10.1128/jb.174.3.671-681.1992. [DOI] [PMC free article] [PubMed] [Google Scholar]
- Hashimoto S, Katsumata R. l‐Alanine fermentation by an alanine racemase deficient mutant of the dl‐alanine hyperproducing bacterium, Arthrobacter oxydans HAP‐1. J Ferment Bioeng. 1998;86:346–351. [Google Scholar]
- Hayashi M, Ohnishi J, Mitsuhashi S, Yonetani Y, Hashimoto S, Ikeda M. Transcriptome analysis reveals global expression changes in an industrial l‐lysine producer of Corynebacterium glutamicum. Biosci Biotechnol Biochem. 2006;70:546–550. doi: 10.1271/bbb.70.546. [DOI] [PubMed] [Google Scholar]
- Heefner D.L, Weaver C.A, Yarus M.J, Burdzinski L.A. 1992. ., and ) Method for producing riboflavin with Candida famata. US Patent 5164303.
- Heefner D.L, Boyts A, Burdzinski L. 1993.
- Hermann M, Fayolle F, Marchal R, Podvin L, Sebald M, Vandecasteele J.‐P. Isolation and characterization of butanol‐resistant mutants of Clostridium acetobutylicum. Appl Environ Microbiol. 1985;50:1238–1243. doi: 10.1128/aem.50.5.1238-1243.1985. [DOI] [PMC free article] [PubMed] [Google Scholar]
- Hoischen C, Kraemer R. Evidence for an efflux carrier system involved in the secretion of glutamate by Corynebacterium glutamicum. Arch Microbiol. 1989;151:342–347. [Google Scholar]
- Hong Y.R, Chen Y.‐L, Farh L, Yang W.‐J, Liao C.‐H, Shiuan D. Recombinant Candida utilis for the production of biotin. Appl Microbiol Biotechnol. 2006;71:211–221. doi: 10.1007/s00253-005-0133-4. [DOI] [PubMed] [Google Scholar]
- Hoshino T. A study on a fermentative production of 2‐keto‐l‐gulonic acid, an intermediate for vitamin C production by bacteria. Actinomycetologica. 2000;14:S‐10. [Google Scholar]
- Hueck C.J, Hillen W. Catabolite repression in Bacillus subtilis: a global regulatory mechanism for the gram‐positive bacteria? Mol Microbiol. 1995;15:395–401. doi: 10.1111/j.1365-2958.1995.tb02252.x. [DOI] [PubMed] [Google Scholar]
- Hynes M.J, Kelly J.M. Pleiotropic mutants of Aspergillus nidulans altered in carbon metabolism. Mol Gen Genet. 1977;150:193–204. doi: 10.1007/BF00695399. [DOI] [PubMed] [Google Scholar]
- Ikeda M. Amino acid production processes. In. In: Faurie R, Thommel J, editors. Springer; 2003. pp. 1–35. [DOI] [PubMed] [Google Scholar]
- Ikeda M, Katsumata R. Metabolic engineering to produce tyrosine or phenylalanine in a tryptophan‐producing Corynebacterium glutamicum strain. Appl Environ Microbiol. 1992;58:781–785. doi: 10.1128/aem.58.3.781-785.1992. [DOI] [PMC free article] [PubMed] [Google Scholar]
- Ikeda M, Katsumata R. Transport of aromatic amino acids and its influence on overproduction of the amino acids in Corynebacterium glutamicum. J Ferm Bioeng. 1994;78:420–425. [Google Scholar]
- Ikeda M, Katsumata R. Hyperproduction of tryptophan by Corynebacterium glutamicum with the modified pentose phosphate pathway. Appl Environ Microbiol. 1999;65:2497–2502. doi: 10.1128/aem.65.6.2497-2502.1999. [DOI] [PMC free article] [PubMed] [Google Scholar]
- Ikeda M, Nakagawa S. The Corynebacterium glutamicum genome: features and impacts on biotechnological processes. Appl Microbiol Biotechnol. 2003;62:99–109. doi: 10.1007/s00253-003-1328-1. [DOI] [PubMed] [Google Scholar]
- Ikeda M, Ozaki A, Katsumata R. Phenylalanine production by metabolically engineered Corynebacterium glutamicum with the pheA gene of Escherichia coli. Appl Microbiol Biotechnol. 1993;39:318–323. doi: 10.1007/BF00192085. [DOI] [PubMed] [Google Scholar]
- Ikeda M, Nakanishi K, Kino K, Katsumata R. Fermentative production of tryptophan by a stable recombinant strain of Corynebacterium glutamicum with a modified serine‐biosynthetic pathway. Biosci Biotechnol Biochem. 1994;58:674–678. doi: 10.1271/bbb.58.674. [DOI] [PubMed] [Google Scholar]
- Ikeda S, Fujita I, Hirose Y. Culture conditions of l‐isoleucine fermentation from acetic acid. Agric Biol Chem. 1976;40:517–522. [Google Scholar]
- Industrial Biotechnology and Sustainable Chemistry. Belgian Academy of Applied Science; 2004. [Google Scholar]
- Ishida M, Kawashima H, Sato K, Hashiguchi K, Ito H, Enei H, Nakamori S. Factors improving l‐threonine production by a three l‐threonine biosynthetic genes‐amplified recombinant strain of Brevibacterium lactofermentum. Biosci Biotechnol Biochem. 1994;58:768–770. doi: 10.1271/bbb.58.768. [DOI] [PubMed] [Google Scholar]
- Ishida N, Suzuki T, Tokuhiro K, Nagamori E, Onishi T, Saitoh S. d‐Lactic acid production by metabolically engineered Saccharomyces cerevisiae. J Biosci Bioeng. 2006;101:172–177. doi: 10.1263/jbb.101.172. et al. [DOI] [PubMed] [Google Scholar]
- Ishige T, Honda K, Shimizu S. Whole organism biocatalysis. Curr Opin Chem Biol. 2005;9:174–180. doi: 10.1016/j.cbpa.2005.02.001. [DOI] [PubMed] [Google Scholar]
- Ishino S, Shimomura‐Nishimuta J, Yamaguchi K, Araki K. C‐NMR studies of glucose metabolism in l‐glutamic acid and l‐lysine fermentation by Corynebacterium glutamicum. J Gen Appl Microbiol. 1991;37:157–165. [Google Scholar]
- Ishizuka H, Wako K, Kasumi T, Sasaki T. Breeding of a mutant of Aureobasidium sp. with high erythritol production. J Ferm Bioeng. 1989;68:310–314. [Google Scholar]
- Ito H, Sato K, Matsui K, Sano K, Enei H, Hirose Y. Molecular breeding of a Brevibacterium lactofermentuml‐phenylalanine producer using a cloned prephenate dehydratase gene. Appl Microbiol Biotechnol. 1990a;33:190–195. [Google Scholar]
- Ito H, Sato K, Enei H, Hirose Y. Improvement of microbial production of l‐tyrosine by gene dosage effect of aroL gene encoding shikimate kinase. Agric Biol Chem. 1990b;54:823–824. [PubMed] [Google Scholar]
- Ito H, Sato K, Tanaka T, Enei H. Application of a recombinanat plasmid expressing desensitized 3‐deoxy‐d‐arabinoheptulosonate‐7‐phosphate synthase to the breeding of l‐phenylanine producers. J Ferm Bioeng. 1991;72:183–186. [Google Scholar]
- Jacob F, Monod J. Genetic regulatory mechanisms in the synthesis of proteins. J Mol Biol. 1961 doi: 10.1016/s0022-2836(61)80072-7. [DOI] [PubMed] [Google Scholar]
- Janssen D.B, Herst P.M, Joosten H.M.L, Van Der Drift C. Nitrogen control in Pseudomonas aeruginosa. A role for glutamine in the regulation of the synthesis of NADP‐dependent glutamate dehtdrogenase, urease and histidase. Arch Microbiol. 1981;128:398–402. doi: 10.1007/BF00405920. [DOI] [PubMed] [Google Scholar]
- Jensen R.A. Metabolic interlock. Regulatory interactions exerted between biochemical pathways. J Biol Chem. 1969;244:2816–2823. [PubMed] [Google Scholar]
- Jetten M.S.M, Sinskey A.J. Recent advances in the physiology and genetics of amino acid‐producing bacteria. Crit Rev Biotechnol. 1995;15:73–103. doi: 10.3109/07388559509150532. [DOI] [PubMed] [Google Scholar]
- Johnson E.A, Schroeder W.A. Microbial carotenoids. Adv Biochem Eng/Biotechnol. 1995;53:119–178. doi: 10.1007/BFb0102327. [DOI] [PubMed] [Google Scholar]
- Jones B.E, Dossonnet V, Küster E, Hillen W, Deutscher J, Klevit R.E. Binding of the catabolite repressor protein CcpA to its DNA target is regulated by phosphorylation of its corepressor HPr. J Biol Chem. 1997;272:26530–26535. doi: 10.1074/jbc.272.42.26530. [DOI] [PubMed] [Google Scholar]
- Kacser H, Acerenza L. A universal method for achieving increases in metabolite production. Eur J Biochem. 1993;216:361–367. doi: 10.1111/j.1432-1033.1993.tb18153.x. [DOI] [PubMed] [Google Scholar]
- Kalinowski J, Bathe B, Bartels D, Biscoff N, Bott M, Burkovski A. The complete Corynebacterium glutamicum ATCC 13032 genome sequence and its impact on the production of l‐aspartate‐derived amino acids and vitamins. J Biotechnol. 2003;104:5–25. doi: 10.1016/s0168-1656(03)00154-8. et al. [DOI] [PubMed] [Google Scholar]
- Kalle G.P, Naik S.C. Continuous fed‐batch vacuum fermentation system for glycerol from molasses by the sulfite process. J Ferm Technol. 1985;63:411–414. [Google Scholar]
- Kamada N, Yasuhara A, Takano Y, Nakano T. Effect of transketolase modifications on carbon flow to the purine‐nucleotide pathway in Corynebacterium ammoniagenes. Appl Microbiol Biotechnol. 2001;56:710–717. doi: 10.1007/s002530100738. [DOI] [PubMed] [Google Scholar]
- Kang K.‐H, Ryu H.‐W. Enhancement of succinate production by organic solvents, detergents, and vegetable oils. J Microbiol Biotechnol. 1999;9:191–195. [Google Scholar]
- Kaplan L, Demain A.L. Nutritional studies on riboflavin overproduction. In: Ahearn D.G, editor. Georgia State University; 1970. pp. 137–159. [Google Scholar]
- Karos M, Vilarino C, Bollschweiler C, Revuelta J.L. A genome‐wide transcription analysis of a fungal riboflavin overproducer. J Biotechnol. 2004;113:69–76. doi: 10.1016/j.jbiotec.2004.03.025. [DOI] [PubMed] [Google Scholar]
- Kase H, Nakayama K. l‐isoleucine production by analog‐resistant mutants derived from threonine‐producing strain of Corynebacterium glutamicum. Agric Biol Chem. 1977;41:109–116. [Google Scholar]
- Kashket E.R, Cao Z.‐Y. Clostridial strain degeneration. FEMS Microbiol Rev. 1995;17:307–315. [Google Scholar]
- Katsumata R, Ikeda M. Hyperproduction of tryptophan in Corynebacterium glutamicum by pathway engineering. Bio/Technology. 1993;11:921–925. [Google Scholar]
- Kaup B, Bringer‐Meyer S, Sahm H. Metabolic engineering of Escherichia coli: construction of an efficient biocatalyst for d‐mannitol formation in a whole‐cell biotransformation. Appl Microbiol Biotechnol. 2004;64:333–339. doi: 10.1007/s00253-003-1470-9. [DOI] [PubMed] [Google Scholar]
- Kawahara Y, Takahashi‐Fuke K, Shimizu E, Nakamatsu T, Nakamori S. Relationship between the glutamate production and the activity of 2‐oxoglutarate dehydrogenase in Brevibacterium lactofermentum. Biosci Biotechnol Biochem. 1997;61:1109–1112. doi: 10.1271/bbb.61.1109. [DOI] [PubMed] [Google Scholar]
- Kenealy W, Zaady E, Du Preez J.C, Stieglitz B, Goldberg I. Biochemicakl aspects of fumaric acid accumulation by Rhizopus arrhizus. Appl Environ Microbiol. 1986;52:128–133. doi: 10.1128/aem.52.1.128-133.1986. [DOI] [PMC free article] [PubMed] [Google Scholar]
- Kiefer P, Heinzle E, Wittmann C. Influence of glucose, fructose and sucrose on kinetics and stoichiometry of lysine production by Corynebacterium glutamicum. J Indust Microbiol Biotechnol. 2002;28:338–343. doi: 10.1038/sj/jim/7000252. [DOI] [PubMed] [Google Scholar]
- Kiefer P, Heinzle E, Zelder O, Wittmann C. Comparative metabolic flux analysis of lysine‐producing Corynebacterium glutamicum on glucose and fructose. Appl Environ Microbiol. 2004;70:229–239. doi: 10.1128/AEM.70.1.229-239.2004. [DOI] [PMC free article] [PubMed] [Google Scholar]
- Kim D.Y, Rha E, Choi S.‐L, Song J.J, Hong S.‐P, Sung M.‐H, Lee S.‐G. Development of bioreactor system for l‐tyrosine synthesis using thermostable tyrosine phenol‐lyase. J Microbiol Biotechnol. 2007;17:116–122. [PubMed] [Google Scholar]
- Kim K.‐A, Noh B.‐S, Lee J.‐K, Kim S.‐Y, Park Y.‐C, Oh D.‐K. Optimization of culture conditions for erythritol production by Torula sp. J Microbiol Biotechnol. 2000;10:69–74. [Google Scholar]
- Kim S.‐Y, Lee K.‐H, Kim J.‐H, Oh D.‐K. Erythritol production by controlling osmotic pressure in Trigonopsis variabilis. Biotechnol Lett. 1997;19:727–729. [Google Scholar]
- Kimura E. Metabolic engineering of glutamate production. Adv Biochem Eng Biotechnol. 2003;79:37–57. doi: 10.1007/3-540-45989-8_2. [DOI] [PubMed] [Google Scholar]
- Kimura E, Yagoshi C, Kawahara Y, Ohsumi T, Nakamatsu T, Tozuda H. Glutamate overproduction in Corynebacterium glutamicum triggered by a decrease in the level of a complex comprising DtsR and a biotin‐containing subunit. Biosci Biotechnol Biochem. 1999;63:1274–1278. doi: 10.1271/bbb.63.1274. [DOI] [PubMed] [Google Scholar]
- Kinoshita S. Glutamic acid bacteria. In: Demain A.L, Solomon N.A, editors. Benjamin Cummings; 1985. pp. 115–142. [Google Scholar]
- Kinoshita S, Udaka S, Shimono M. Amino acid fermentation. I. Production of l‐glutamic acid by various microorganisms. J Gen Appl Microbiol. 1957;3:193–205. [PubMed] [Google Scholar]
- Kirchner O, Tauch A.J. Tools for genetic engineering in the amino acid‐producing bacterium Corynebacterium gltamicum. J Biotechnol. 2003;104:287–299. doi: 10.1016/s0168-1656(03)00148-2. [DOI] [PubMed] [Google Scholar]
- Kisumi M, Komatsubara S, Chibata I. Enhancement of isoleucine hydroxamate‐mediated growth inhibition and improvement of isoleucine‐producing strains of Serratia marcescens. Appl Environ Microbiol. 1977;34:647–653. doi: 10.1128/aem.34.6.647-653.1977. [DOI] [PMC free article] [PubMed] [Google Scholar]
- Kitano K, Sugiyama Y, Kanzaki T. l‐Glutamate fermentation with acetic acid by an oleic acid requiring mutant. II. Inhibitory factors against the extracellular accumulation of l‐glutamate. J Ferm Technol. 1972;50:182–191. [Google Scholar]
- Kolter R, Yanofsky C. Attenuation in amino acid biosynthetic operons. Annu Rev Genet. 1982;16:113–134. doi: 10.1146/annurev.ge.16.120182.000553. [DOI] [PubMed] [Google Scholar]
- Komatsubara S, Kisumi M, Chibata I. Transductional construction of a threonine‐producing strain of Serratia marcescens. Appl Environ Microbiol. 1979;38:1045–1051. doi: 10.1128/aem.38.6.1045-1051.1979. [DOI] [PMC free article] [PubMed] [Google Scholar]
- Komatsubara S, Kisumi M, Chibata I. Transductional construction of a threonine‐hyperproducing strain of Serratia marcescens: lack of feedback controls of three aspartokinases and two homoserine dehydrogenases. Appl Environ Microbiol. 1983;45:1445–1152. doi: 10.1128/aem.45.5.1445-1452.1983. [DOI] [PMC free article] [PubMed] [Google Scholar]
- Konstantinov K.B, Yoshida T. Knowledge‐based control of fermentation processes. Biotechnol Bioeng. 1992;39:479–486. doi: 10.1002/bit.260390502. [DOI] [PubMed] [Google Scholar]
- Kornberg A, Rao N.N, Ault‐Riché D. Inorganic polyphosphate: a molecule of many functions. Annu Rev Biochem. 1999;68:89–125. doi: 10.1146/annurev.biochem.68.1.89. [DOI] [PubMed] [Google Scholar]
- Kraemer M, Bongaerts J, Bovenberg R, Kremer S, Mueller U, Orf S. Metabolic engineering for microbial production of shikimic acid. Metab Eng. 2003;5:277–283. doi: 10.1016/j.ymben.2003.09.001. et al. [DOI] [PubMed] [Google Scholar]
- Kraemer R. Production of amino acids: physiological and genetic approaches. Food Biotechnol. 2004;18:1–46. [Google Scholar]
- Kredich N.M. The molecular basis for positive regulation of cys promoters in Salmonella typhimurium and Escherichia coli. Mol Microbiol. 1992;6:2747–2753. doi: 10.1111/j.1365-2958.1992.tb01453.x. [DOI] [PubMed] [Google Scholar]
- Kroemer J.O, Sorgenfrei O, Klopprogge K, Heinzle E, Wittmann C. In‐depth profiling of lysine producing Corynebacterium glutamicum by combined analysis of transcriptome, metabolome and fluxome. J Bacteriol. 2004;186:1769–1784. doi: 10.1128/JB.186.6.1769-1784.2004. [DOI] [PMC free article] [PubMed] [Google Scholar]
- Kuninaka A. Nucleotides and related compounds. In: Rehm H.J., Reed G., Pühler A., Stadler P, editors. Weinheim, VCH; 1996. pp. 561–612. [Google Scholar]
- Kruse D, Kraemer R, Eggeling L, Rieping M, Pfefferle W, Tchieu J.H. Influence of threonine exporters on threonine production in Escherichia coli. Appl Microbiol Biotechnol. 2002;59:205–210. doi: 10.1007/s00253-002-0987-7. et al. [DOI] [PubMed] [Google Scholar]
- Kubicek C.P. Citric acid production. In: Nagodawithana T.W, Reed G, editors. Esteekay Associates; 1998. pp. 236–257. [Google Scholar]
- Kubicek C.P, Roehr M. Citric acid fermentation. Crit Rev Biotechnol. 1986;3:331–373. [Google Scholar]
- Kubicek‐Pranz E.M, Mozelt M, Roehr M, Kubicek C.P. Changes in the concentration of fructose 2,6‐bisphosphate in Aspergillus niger during stimulation of acidogenesis by elevated sucrose concentration. Biochim Biophys Acta. 1990;1033:250–255. doi: 10.1016/0304-4165(90)90128-j. [DOI] [PubMed] [Google Scholar]
- Ladero V, Ramos A, Wiersma A, Goffin P, Schanck A, Kleerebezem M. High‐level production of the low‐calorie sugar sorbitol by Lactobacillus plantarum through metabolic engineering. Appl Environ Microbiol. 2007;73:1864–1872. doi: 10.1128/AEM.02304-06. et al. [DOI] [PMC free article] [PubMed] [Google Scholar]
- Lambert C, Erdmann A, Eikmanns M, Kraemer R. Triggering glutamate excretion in Corynebacterium glutamicum by modulating the membrane state with local anaesthetics and osmotic gradients. Appl Environ Microbiol. 1995;61:4334–4342. doi: 10.1128/aem.61.12.4334-4342.1995. [DOI] [PMC free article] [PubMed] [Google Scholar]
- Laneelle G, Clement Y. Glutamate excretion mechanism in Corynebacterium glutamicum. 5th Internat Symp Genet Indust Microorgs Part B. 1986:247–252. [Google Scholar]
- Laurie A.D, Bernardo L.M.D, Sze C.C, Skaerfstad E, Szalewska‐Palasz A, Nystroem T, Shingler V. The role of the alarmone (p)ppGpp in σN competition for core RNA polymerase. J Biol Chem. 2003;278:1494–1503. doi: 10.1074/jbc.M209268200. [DOI] [PubMed] [Google Scholar]
- Lee J‐H, Lee D‐E, Lee B‐U, Kim H‐S. Global analyses of transcriptomes and proteomes of a parent strain and an l‐threonine‐overproducing mutant strain. J Bacteriol. 2003;185:5442–5451. doi: 10.1128/JB.185.18.5442-5451.2003. [DOI] [PMC free article] [PubMed] [Google Scholar]
- Lee J.‐K, Oh D.‐K, Song H.‐Y, Kim I.‐W. Ca2+ and Cu2+ supplementation increases mannitol production by Candida magnoliae. Biotechnol Lett. 2007;29:291–294. doi: 10.1007/s10529-006-9230-4. [DOI] [PubMed] [Google Scholar]
- Lee M.H, Lee H.W, Kim B.J, Kim C.S, Jung J.K, Hwang Y.I. High production of l‐threonine using controlled feeding of l‐methionine and phosphate by Escherichia coli mutant. Kor J Microbiol Biotechnol. 2004;32:149–153. [Google Scholar]
- Lee P.C, Schmidt‐Dannert C. Metabolic engineering towards biotechnological production of carotenoids in microorganisms. Appl Microbiol Biotechnol. 2002;60:1–11. doi: 10.1007/s00253-002-1101-x. [DOI] [PubMed] [Google Scholar]
- Lee S.J, Song H, Lee S.Y. Genome‐based metabolic engineering of Mannheimia succiniciproducens for succinic acid production. Appl Environ Microbiol. 2006;72:1939–1948. doi: 10.1128/AEM.72.3.1939-1948.2006. [DOI] [PMC free article] [PubMed] [Google Scholar]
- Leopold H. Ueber das Verhalten von Invertase und Glukoseoxydase waehrend der Citronensaeuregaerung. Die Nahrung. 1959;3:987–1000. [Google Scholar]
- Leuchtenberger W, Huthmacher K, Drauz K. Biotechnological production of amino acids and derivatives: current status and prospects. Appl Microbiol Biotechnol. 2005;69:1–8. doi: 10.1007/s00253-005-0155-y. [DOI] [PubMed] [Google Scholar]
- Levinson W.E, Kurtzman C.P, Tsung M.K. Production of itaconic acid by Pseudozyma antarctica NRRL Y‐7808 under nitrogen‐limited growth conditions. Enzyme Microb Technol. 2006;39:824–827. [Google Scholar]
- Li K, Mikola M.R, Draths K.M, Worden R.M, Frost J.W. Fed‐batch fermentor synthesis of 3‐dehydroshikimic acid using recombinant Escherichia coli. Biotechnol Bioeng. 1999;64:61–73. [PubMed] [Google Scholar]
- Li Y, Hugenholtz J, Chen J, Lun S.‐Y. Enhancement of pyruvate production by Torulopsis glabrata using a two‐stage oxygen supply control strategy. Appl Microbiol Biotechnol. 2002;60:101–106. doi: 10.1007/s00253-002-1064-y. [DOI] [PubMed] [Google Scholar]
- Li J, Ma C, Ma Y, Li Y, Zhou W, Xu P. Medium optimization by combination of response surface methodology and desirability function: an application in glutamine production. Appl Microbiol Biotechnol. 2007;74:563–571. doi: 10.1007/s00253-006-0699-5. [DOI] [PubMed] [Google Scholar]
- Lochowska A, Iwanicka‐Nowicka R, Plochocka D, Hryniewicz M.M. Functional dissection of the LysR‐type CysB transcriptional regulator. Regions important for DNA binding, inducer response, oligomerization, and positive control. J Biol Chem. 2001;276:2098–2107. doi: 10.1074/jbc.M007192200. [DOI] [PubMed] [Google Scholar]
- Loos A, Glanemann C, Willis L.B, O'Brien X.M, Lessard P.A, Gerstmeier R, Guillouet S, Sinskey A.J. Development and validation of Corynebacterium DNA microarrays. Appl Environ Microbiol. 2001;67:2310–2318. doi: 10.1128/AEM.67.5.2310-2318.2001. [DOI] [PMC free article] [PubMed] [Google Scholar]
- Lynd L, Weimer P.J, Van Zyl W.H, Pretorius I.S. Microbial cellulose utilization: fundamentals and biotechnology. Microbiol Mol Biol Rev. 2002;66:506–577. doi: 10.1128/MMBR.66.3.506-577.2002. [DOI] [PMC free article] [PubMed] [Google Scholar]
- Macauley S, McNeil B, Harvey L.M. The genus Gluconobacter and its applications in biotechnology. Crit Rev Biotechnol. 2001;21:1–25. doi: 10.1080/20013891081665. [DOI] [PubMed] [Google Scholar]
- Mach H, Hecker M, Mach F. Evidence for the presence of cyclic adenosine monophosphate in Bacillus subtilis. FEMS Microbiol Lett. 1984;22:27–30. [Google Scholar]
- McNeil B, Kristiansen B. The acetone‐butanol fermentation. Adv Appl Microbiol. 1986;31:61–92. [Google Scholar]
- Magasanik B, Kaiser C.A. Nitrogen regulation in Saccharomyces cerevisiae. Gene. 2002;290:1–18. doi: 10.1016/s0378-1119(02)00558-9. [DOI] [PubMed] [Google Scholar]
- Magnuson J.K, Lasure L.L. Organic acid production by filamentous fungi. In: Tkacz J, Lange L, editors. Klewer Academic/Plenum; 2004. pp. 307–340. [Google Scholar]
- Van Maris A.J.A, Geertman J.‐M.A, Vermeulen A, Groothhuizen M.K, Winkler A.A, Piper M.D.W. Directed evolution of pyruvate decarboxylase‐negative Saccharomyces cerevisiae, yielding a C2‐independent, glucose‐tolerant, and pyruvate‐hyperproducing yeast. Appl Environ Microbiol. 2004;70:159–166. doi: 10.1128/AEM.70.1.159-166.2004. et al. [DOI] [PMC free article] [PubMed] [Google Scholar]
- Martens J.‐H, Barg H, Warren M, Jahn D. Microbial production of vitamin B12. Appl Microbiol Biotechnol. 2002;58:275–285. doi: 10.1007/s00253-001-0902-7. [DOI] [PubMed] [Google Scholar]
- Marzluff G.A. Regulation of nitrogen metabolism and gene expression in fungi. Microbiol Rev. 1981;45:437–461. doi: 10.1128/mr.45.3.437-461.1981. [DOI] [PMC free article] [PubMed] [Google Scholar]
- Masuda M, Takamatu S, Nishimura N, Komatsubara S, Tosa T. Improvement of culture conditions for l‐proline production by a recombinant strain of Serratia marcescens. Appl Biochem Biotechnol. 1993;43:189–197. doi: 10.1007/BF02916452. [DOI] [PubMed] [Google Scholar]
- Masuda M, Takahashi K, Sakurai N, Yanagiya K, Komatsubara S, Tosa T. Further improvement of d‐biotin production by a recombinant strain of Serratia marcescens. Proc Biochem. 1995;30:553–562. [Google Scholar]
- Matsui J, Ifuku O, Kanzaki N, Kawamoto T, Nakahama K. 2001.
- Mehta H.B, Modi V.V. The effect of phosphate on flavinogenesis in Eremothecium ashbyii. Appl Microbiol Biotechnol. 1981;11:131–132. [Google Scholar]
- Mermelstein L.D, Papoutsakis E.T, Petersen D.J, Bennett G.N. Metabolic engineering of Clostridium acetobutylicum ATCC 824 for increased solvent production by enhancement of acetone formation enzyme activities using a synthetic acetone operon. Biotechnol Bioeng. 1993;42:1053–1060. doi: 10.1002/bit.260420906. [DOI] [PubMed] [Google Scholar]
- Merrick M.J, Edwards R.A. Nitrogen control in bacteria. Microbiol Rev. 1995;59:604–622. doi: 10.1128/mr.59.4.604-622.1995. [DOI] [PMC free article] [PubMed] [Google Scholar]
- Mihara Y. Improving the pyrophosphate‐inosine phosphotransferase activity of Escherichia blattae acid phosphatase by sequential site‐directed mutagenesis. Biosci Biotechnol Biochem. 2004;68:1046–1050. doi: 10.1271/bbb.68.1046. [DOI] [PubMed] [Google Scholar]
- Mittenhuber G. A phylogenomic study of the general stress response sigma factor sigmaB of Bacillus subtilis and its regulatory proteins. J Mol Micro Biotechnol. 2002;4:427–452. [PubMed] [Google Scholar]
- Miyagawa K, Kimura H, Nakahama K, Kikuchi M, Doi M, Akiyama S, Nakao Y. Cloning of the Bacillus subtilis IMP dehydrogenase gene and its application to increased production of guanosine. Bio/Technology. 1986;4:225–228. [Google Scholar]
- Miyagawa K, Kanzaki N, Kimura H, Sumino Y, Akyama S, Nakao Y. Increased inosine production by a Bacillus subtilis xanthine‐requiring mutant derived by insertional inactivation of the IMP dehydrogenase gene. Bio/Technology. 1989;7:821–824. [Google Scholar]
- Moeckel B, Weissenborn A, Pfefferle W, Kalinowski J, Bathe B, Puehler A. Genome sequencing of industrial microorganisms: the Corynebacterium glutamicum ATCC 13032 genome project. Microb Comp Genomics. 1999;4:111. [Google Scholar]
- Monard D, Janecek J, Rickenberg H.V. The enzymic degradation of 3. Biochem Biophys Res Commun. 1969;35:584–591. doi: 10.1016/0006-291x(69)90388-x. ., and ′,5cyclic AMP in strains of E. coli sensitive and resistant to catobolite repression. [DOI] [PubMed] [Google Scholar]
- Mondal S, Chatterjee S.P. Enhancement of methionine production by methionine analogue resistant mutants of Brevibacterium heali. Acta Biotechnol. 1994;14:199–204. [Google Scholar]
- Monschau N, Sahm H, Stahmann K.P. Threonine aldolase overexpression plus threonine supplementation enhanced riboflavin production in Ashbya gossypii. Appl Environ Microbiol. 1998;64:4283–4290. doi: 10.1128/aem.64.11.4283-4290.1998. [DOI] [PMC free article] [PubMed] [Google Scholar]
- Morbach S, Sahm H, Eggeling L. Use of feedback‐resistant threonine dehydratases of Corynebacterium glutamicum to increase carbon flux towards l‐isoleucine. Appl Environ Microbiol. 1995;61:4315–4320. doi: 10.1128/aem.61.12.4315-4320.1995. [DOI] [PMC free article] [PubMed] [Google Scholar]
- Morbach S, Kelle R, Winkels S, Sahm H, Eggeling L. Engineering the homoserine dehydrogenase and threonine dehydratase control points to analyse flux towards l‐isoleucine in Corynebacterium glutamicum. Appl Microbiol Biotechnol. 1996;45:612–620. [Google Scholar]
- Mori H, Iida A, Fujio T, Teshiba S. A novel process of inosine 5. Appl Microbiol Biotechnol. 1997;48:693–698. doi: 10.1007/s002530051117. ., and ′‐monophosphate production using overexpressed guanosine/inosine kinase. [DOI] [PubMed] [Google Scholar]
- Nakamatsu T. Mechanisms of l‐glutamate production in coryneform bacteria. Actinomycetologica. 2001;15:10. : SSS11. [Google Scholar]
- Nakamura C, Whited G. Metabolic engineering for the microbial production of 1,3 propanediol. Curr Opin Biotechnol. 2003;14:454–459. doi: 10.1016/j.copbio.2003.08.005. [DOI] [PubMed] [Google Scholar]
- Nakamura J, Hirano S, Ito H, Wachi M. Mutations of the Corynebacterium glutamicum NCgl1221 gene, encoding a mechanosensitive channel homolog, induce l‐glutamic acid production. Appl Environ Microbiol. 2007;73:4491–4498. doi: 10.1128/AEM.02446-06. [DOI] [PMC free article] [PubMed] [Google Scholar]
- Nakanishi T, Yokote Y, Taketsugu Y. Conversion of l‐glutamic acid fermentation to a l‐proline fermentation by Corynebacterium glutamicum. J Ferm Technol. 1973;51:742–749. [Google Scholar]
- Nakanishi T, Hirao T, Azuma T, Sakurai M, Hagino H. Application of l‐glutamate to l‐proline fermentation by Corynebacterium acetoacidophilum. J Ferm Technol. 1987;65:139–144. [Google Scholar]
- Nakao Y, Kikuchi M, Suzuki M, Doi M. Microbial production of l‐glutamic acid by glycerol auxotrophs and production of l‐glutamic acid from n‐paraffins. Agric Biol Chem. 1972;36:490–496. [Google Scholar]
- Nampoothiri K.M, Hoischen C, Bathe B, Moeckel B, Pfefferle W, Krumbach K. Expression of genes of lipid synthesis and altered lipid composition modulates l‐glutamate efflux of Corynebacterium glutamicum. Appl Microbiol Biotechnol. 2002;58:89–96. doi: 10.1007/s00253-001-0861-z. et al. [DOI] [PubMed] [Google Scholar]
- Navarro A.R, Sepúlveda M. del C, Rubio M.C. Bio‐concentration of vinasse from the alcoholic fermentation of sugar cane molasses. Waste Manag. 2000;20:581–585. [Google Scholar]
- Ness J.E, Cardayre S.B, Minshull J, Stemmer W.P. Molecular breeding: the natural approach to protein design. Adv Prot Chem. 2000;55:261–292. doi: 10.1016/s0065-3233(01)55006-8. [DOI] [PubMed] [Google Scholar]
- Neufeld R.J, Peleg Y, Rokem J.S, Pines O, Goldberg I. l‐Malic acid formation by immobilized Saccharomyces cerevisiae amplified for fumarase. Enzyme Microb Technol. 1991;13:991–996. [Google Scholar]
- Ng F.M.‐W, Dawes E.A. Chemostat studies on the regulation of glucose metabolism in Pseudomonas aeruginosa by citrate. Biochem J. 1973;132:129–140. doi: 10.1042/bj1320129. [DOI] [PMC free article] [PubMed] [Google Scholar]
- Nielsen J. Metabolic engineering. Appl Microbiol Biotechnol. 2001;55:263–283. doi: 10.1007/s002530000511. [DOI] [PubMed] [Google Scholar]
- Nilsson J, Skogman S.G. Stabilization of Escherichia coli tryptophan‐production vectors in continuous cultures: a comparison of three different systems. Bio/Technology. 1986;4:901–903. [Google Scholar]
- Nishio Y, Nakamura Y, Kawarabayashi Y, Usuda Y, Kimura E, Sugimoto S. Comparative complete genome sequence analysis of the amino acid replacements responsible for the thermostability of Corynebacterium efficiens. Genome Res. 2003;13:1572–1579. doi: 10.1101/gr.1285603. et al. [DOI] [PMC free article] [PubMed] [Google Scholar]
- Nissen T.L, Kielland‐Brandt M.C, Nielsen J, Villadsen J. Optimization of ethanol production in Saccharomyces cerevisiae by metabolic engineering of the ammonium assimilation. Metab Eng. 2000;2:69–77. doi: 10.1006/mben.1999.0140. [DOI] [PubMed] [Google Scholar]
- Ohnishi J, Mitsuhashi S, Hayashi M, Ando S, Yokoi H, Ochiai K, Ikeda M. A novel methodology employing Corynebacterium glutamicum genome information to generate a new l‐lysine‐producing mutant. Appl Microbiol Biotechnol. 2002;58:217–223. doi: 10.1007/s00253-001-0883-6. [DOI] [PubMed] [Google Scholar]
- Ohnishi J, Katahira R, Mitsuhashi S, Kakita S, Ikeda M.A. Novel gnd mutation leading to increased l‐lysine production in Corynebacterium glutamicum. FEMS Microbiol Lett. 2005;242:265–274. doi: 10.1016/j.femsle.2004.11.014. [DOI] [PubMed] [Google Scholar]
- Ozaki A, Katsumata R, Oka T, Furuya A. Cloning of the genes concerned in phenylalanine biosynthesis in Corynebacterium glutamicum and its application to breeding of a phenylalanine producing strain. Agric Biol Chem. 1985;49:2925–2930. [Google Scholar]
- Ozaki H, Shiio I. Regulation of the TCA and glyoxylate cycles in Brevibacterium flavum. II. Regulation of phosphoenolpyruvate carboxylase and pyruvate kinase. J Biochem. 1969;66:297–311. doi: 10.1093/oxfordjournals.jbchem.a129148. [DOI] [PubMed] [Google Scholar]
- Palmieri L, Berns D, Kraemer R, Eikmanns M. Threonine diffusion and threonine transport in Corynebacterium glutamicum and their role in threonine production. Arch Microbiol. 1996;165:48–54. [Google Scholar]
- Papanikolaou S, Ruiz‐Sanchez P, Pariset B, Blanchard F, Fick M. High production of 1,3‐propanediol from industrial glycerol by a newly isolated Clostridium butyricum strain. J Biotechnol. 2000;77:191–208. doi: 10.1016/s0168-1656(99)00217-5. [DOI] [PubMed] [Google Scholar]
- Parekh S.R, Cheryan M. High concentrations of acetate with a mutant strain of C. thermoaceticum. Biotechnol Lett. 1994;16:139–142. [Google Scholar]
- Park J.B, Seo B.C, Kim J.R, Park U.H, Park Y.K. Effect of glucose concentration on production of erythritol by Trichosporon sp. J Microbiol Biotechnol. 1998;8:543–546. [Google Scholar]
- Patnaik R, Louie S, Gavrilovic V, Perry K, Stemmer W.P.C, Ryan C.M, Cardayre S. Genome shuffling of Lactobacillus for improved acid tolerance. Nature Biotechnol. 2002;20:707–712. doi: 10.1038/nbt0702-707. [DOI] [PubMed] [Google Scholar]
- Patten P.A, Howard R.J, Stemmer W.P. Applications of DNA shuffling to pharmaceuticals and vaccines. Curr Opin Biotechnol. 1997;8:724–733. doi: 10.1016/s0958-1669(97)80127-9. [DOI] [PubMed] [Google Scholar]
- Perkins J.B, Sloma A, Hermann T, Theriault K, Zachgo E, Erdenberger T. Genetic engineering of Bacillus subtilis for the commercial production of riboflavin. J Indust Microbiol Biotechnol. 1999;22:8–18. et al. [Google Scholar]
- Peterson W.H, Hendershot W.F, Hainy G.J. Factors affecting production of glycerol and d‐arabitol by representative yeasts of the genus Zygosaccharomyces. Appl Microbiol. 1958;6:349–356. doi: 10.1128/am.6.5.349-357.1958. [DOI] [PMC free article] [PubMed] [Google Scholar]
- Pfefferle W, Mockel B, Bathe B, Marx A. Biotechnological manufacture of lysine. Adv Biochem Eng Biotechnol. 2003;79:59–112. doi: 10.1007/3-540-45989-8_3. [DOI] [PubMed] [Google Scholar]
- Piovant M, Lazdunsk C, Cailla H. Relationship between cell‐division and cyclic adenosine‐3. FEBS Lett. 1975;46:42–45. doi: 10.1016/0014-5793(74)80330-3. ., and ′,5′‐monophosphate in Escherichia coli. [DOI] [PubMed] [Google Scholar]
- Puech V, Bayan N, Salim K, Leblon G, Daffé M. Characterization of the in vivo acceptors of the mycoloyl residues transferred by the corynebacterial PS1 and the related mycobacterial antigens 85. Mol Microbiol. 2000;35:1026–1041. doi: 10.1046/j.1365-2958.2000.01738.x. [DOI] [PubMed] [Google Scholar]
- Qian J, Cai X, Chu J, Zhang Y, Zhuang S. Nucleotide mutations in purA gene and pur operon promoter discovered in guanosine‐ and inosine‐producing Bacillus subtilis strains. Biotechnol Lett. 2006;28:937–941. doi: 10.1007/s10529-006-9020-z. [DOI] [PubMed] [Google Scholar]
- Qureshi N, Maddox I.S, Freidl A. Application of continuous substrate feeding to the ABE fermentation: relief of product inhibition using extraction, perstraction, stripping and pervaporation. Biotechnol Prog. 1992;8:382–390. [Google Scholar]
- Radmacher E, Stansen K.C, Besra G.S, Alderwick L.J, Maughan W.N, Hollweg G. Ethambutol, a cell wall inhibitor of Mycobacterium tuberculosis, elicits l‐glutamate efflux of Corynebacterium glutamicum. Microbiology. 2005;151:1359–1368. doi: 10.1099/mic.0.27804-0. et al. [DOI] [PubMed] [Google Scholar]
- Reizer J, Reizer A. A voyage along the bases: novel phosphotransferase genes revealed by in silico analyses of the Escherichia coli genome. Res Microbiol. 1996;147:458–471. doi: 10.1016/0923-2508(96)84000-9. [DOI] [PubMed] [Google Scholar]
- Richardson J.P. Transcription termination. Crit Rev Biochem Mol Biol. 1993;28:1–30. doi: 10.3109/10409239309082571. [DOI] [PubMed] [Google Scholar]
- Roehr M. A century of citric acid fermentation and research. Food Technol Biotechnol. 1998;36:163–171. [Google Scholar]
- Rojo F, Dinamarca M.A. Catabolite repression and physiological control. In: Ramos J.‐L, editor. Springer; 2004. pp. 365–388. [Google Scholar]
- Rolfes R.J, Zalkin H. Autoregulation of Eschericia coli purR requires two control sites downstream of the promoter. J Bacteriol. 1990;172:5758–5766. doi: 10.1128/jb.172.10.5758-5766.1990. [DOI] [PMC free article] [PubMed] [Google Scholar]
- Rosenberg M, Court D. Regulatory sequences involved in the promotion and termination of RNA transcription. Annu Rev Genet. 1979;13:319–353. doi: 10.1146/annurev.ge.13.120179.001535. [DOI] [PubMed] [Google Scholar]
- Roukas T. Ethanol production from non‐sterilized molasses by free and immobilized Saccharomyces cerevisiae cells using fed‐batch culture. J Food Eng. 1996;27:87–96. doi: 10.1002/bit.260430302. [DOI] [PubMed] [Google Scholar]
- Ryu Y.‐W, Park C.Y, Park J.B, Kim S.‐Y, Seo J.‐H. Optimization of erythritol production by Candida magnoliae in fed‐batch culture. J Indust Microbiol Biotechnol. 2000;25:100–103. [Google Scholar]
- Saha B.C. Effect of salt nutrients on mannitol production by Lactobacillus intermedius NRRL B‐3693. J Indust Microbiol Biotechnol. 2006a;33:887–890. doi: 10.1007/s10295-006-0140-1. [DOI] [PubMed] [Google Scholar]
- Saha B.C. A low‐cost medium for mannitol production by Lactobacillus intermedius NRRL B‐3693. Appl Microbiol Biotechnol. 2006b;72:676–680. doi: 10.1007/s00253-006-0364-z. [DOI] [PubMed] [Google Scholar]
- Saha B.C, Bothast R.J. Pretreatment and enzymatic saccharification of corn fiber. Appl Biochem Biotechnol. 1999;76:65–77. doi: 10.1385/abab:76:2:65. [DOI] [PubMed] [Google Scholar]
- Sahm H. Metabolic design in the amino acid‐producing bacterium Corynebacterium glutamicum. Folia Microbiol. 1995;60:126–132. [Google Scholar]
- Sahm H. Construction of l‐lysine‐, l‐threonine‐, or l‐isoleucine‐overproducing strains of Corynebacterium glutamicum. Ann N Y Acad Sci. 1996;782:25–39. doi: 10.1111/j.1749-6632.1996.tb40544.x. [DOI] [PubMed] [Google Scholar]
- Sahm H, Eggeling L, Morbach S, Eikmanns B. Construction of l‐isoleucine‐overproducing strains of Corynebacterium glutamicum. Naturwissenschaften. 1999;86:33–38. [Google Scholar]
- Sahm H, Eggeling L, De Graaf A.A. Pathway analysis and metabolic engineering in Corynebacterium glutamicum. Biol Chem. 2000;381:899–910. doi: 10.1515/BC.2000.111. [DOI] [PubMed] [Google Scholar]
- Saito S, Ishida N, Onishi T, Tokuhiro K, Nagamori E, Kitamoto K, Takahashi H. Genetically engineered wine yeast produces a high concentration of l‐lactic acid of extremely high optical purity. Appl Environ Microbiol. 2005;71:2789–2792. doi: 10.1128/AEM.71.5.2789-2792.2005. [DOI] [PMC free article] [PubMed] [Google Scholar]
- Saito Y, Ishii Y, Hayashi H, Imao Y, Akashi T, Yoshikawa K. Cloning of genes for l‐sorbose and l‐sorbosone dehdrogenases – from Gluconobacter oxydans and microbial production of 2‐keto‐l‐gulonate, a precursor of l‐ascorbic acid, in a recombinant strain. Appl Environ Microbiol. 1997;63:454–460. doi: 10.1128/aem.63.2.454-460.1997. et al. [DOI] [PMC free article] [PubMed] [Google Scholar]
- Sanford K, Valle F, Ghirnikar R. Pathway engineering through rational design. Tutorial: designing and building cell factories for biobased production. Gen Eng News. 2004;24:44–45. [Google Scholar]
- Schaffer S, Burkovski A. Proteomics. In: Eggeling L, Bott M, editors. CRC Press; 2005. pp. 99–118. ., and . In Handbook of Corynebacterium glutamicum. ., and . (eds). Boca Raton, FL, USA: , pp. [Google Scholar]
- Schloesser T, Schmidt G, Stahmann K.‐P. Transcriptional regulation of 3,4‐dihydroxy‐2‐butanone 4‐phosphate synthase. Microbiology. 2001;147:3377–3386. doi: 10.1099/00221287-147-12-3377. [DOI] [PubMed] [Google Scholar]
- Schluesener D, Fischer F, Kruip J, Rogner M, Poetsch A. Mapping the membrane proteome of Corynebacterium glutamicum. Proteomics. 2005;5:1317–1330. doi: 10.1002/pmic.200400993. [DOI] [PubMed] [Google Scholar]
- Schmid R, Uhlemann E.‐M, Nolden L, Wersch G, Hecker R, Hermann T. Response to nitrogen starvation in Corynebacterium glutamicum. FEMS Microbiol Lett. 2000;187:83–88. doi: 10.1111/j.1574-6968.2000.tb09141.x. et al. [DOI] [PubMed] [Google Scholar]
- Schmidt G, Stahmann K.‐P, Sahm H. Inhibition of purified isocitrate lyase identified itaconate and oxalate as potential antimetabolites for the riboflavin overproducer Ashbya gossypii. Microbiology. 1996;142:411–417. doi: 10.1099/13500872-142-2-411. [DOI] [PubMed] [Google Scholar]
- Schreferl G, Kubicek C.P, Roehr M. Inhibition of citric acid accumulation by manganese ions in Aspergillus niger mutants with reduced citrate control of phosphofructokinase. J Bacteriol. 1986;165:1019–1022. doi: 10.1128/jb.165.3.1019-1022.1986. [DOI] [PMC free article] [PubMed] [Google Scholar]
- Schreferl‐Kunar G, Grotz M, Roehr M, Kubicek C.P. Increased citric acid production by mutants of Aspergillus niger with increased glycolytic capacity. FEMS Microbiol Lett. 1989;59:297–300. [Google Scholar]
- Schultz C, Niebisch A, Gebel L, Bott M. Glutamate production by Corynebacterium glutamicum: dependence on the oxoglutarate dehydrogenase inhibitor protein OdhI and protein kinase PknG. Appl Microbiol Biotechnol. 2007;76:691–700. doi: 10.1007/s00253-007-0933-9. [DOI] [PubMed] [Google Scholar]
- Schwarz W.H, Gapes J.R. Butanol – rediscovering a renewable fuel. BioWorld Eur. 2006;1:16–19. [Google Scholar]
- Scott A.I, Roessner C.A. Biosynthesis of cobalamin (vitamin B12. Biochem Soc Trans. 2002;30:613–620. doi: 10.1042/bst0300613. [DOI] [PubMed] [Google Scholar]
- Shiau S.P, Schneider B.L, Gu W, Reitzer L.J. Role of nitrogen regulator I (NtrC), the transcriptional activator of glnA in enteric bacteria, in reducing expression of glnA during nitrogen‐limited growth. J Bacteriol. 1992;174:179–185. doi: 10.1128/jb.174.1.179-185.1992. [DOI] [PMC free article] [PubMed] [Google Scholar]
- Shiio I, Otsuka S.I, Takahashi M. Effect of biotin on the bacterial formation of glutamic acid. I. Glutamate formation and cellular permeability of amino acids. J Biochem. 1962;51:109–111. doi: 10.1093/oxfordjournals.jbchem.a127500. [DOI] [PubMed] [Google Scholar]
- Shiio I, Sasaki A, Nakamori S, Sano K. Production of l‐isoleucine by AHV resistant mutants of Brevibacterium flavum. Agric Biol Chem. 1973;37:2053–2061. [Google Scholar]
- Shiio I, Sugimoto S.‐I, Kawamura K. Production of l‐tryptophan by azaserine‐resistant mutants of Brevibacterium flavum. Agric Biol Chem. 1982;46:1849–1854. [Google Scholar]
- Shiio I, Sugimoto S.‐I, Kawamura K. ) Production of l‐tryptophan by sulfonamide‐resistant mutants. Agric Biol Chem. 1984;48:2073–2080. [Google Scholar]
- Shimizu H, Tanaka H, Nakato A, Nagahisa K, Kimura E, Shioya S. Effects of the changes in enzyme activities on metabolic flux redistribution around the 2‐oxoglutarate branch in glutamate production by Corynebacterium glutamicum. Bioproc Biosyst Eng. 2003;25:291–298. doi: 10.1007/s00449-002-0307-8. [DOI] [PubMed] [Google Scholar]
- Shinagawa H, Makino K, Yamada M, Amemura M, Sato T, Nakata A. Signal transduction in the phosphate regulon of Escherichia coli: dual functions of PhoR as a protein kinase and a protein phosphatase. In: Torriani‐Gorini A, Yagil E, Silver S, editors. American Society for Microbiology; 1994. pp. 285–289. [Google Scholar]
- Silveira M.M, Jonas R. The biotechnological production of sorbitol. Appl Microbiol Biotechnol. 2002;59:400–408. doi: 10.1007/s00253-002-1046-0. [DOI] [PubMed] [Google Scholar]
- Simic P, Willuhn J, Sahm H, Eggeling L. Identification of glyA (encoding serine hydroxymethyltransferase) and its use together with the exporter ThrE to increase l‐threonine accumulation by Corynebacterium glutamicum. Appl Environ Microbiol. 2002;68:3321–3327. doi: 10.1128/AEM.68.7.3321-3327.2002. [DOI] [PMC free article] [PubMed] [Google Scholar]
- Skory C.D. Lactic acid production by Rhizopus oryzae transformants with modified lactate dehydrogenase activity. Appl Microbiol Biotechnol. 2004;64:237–242. doi: 10.1007/s00253-003-1480-7. [DOI] [PubMed] [Google Scholar]
- Somerson N, Phillips T. 1961.
- Sonntag K, Schwinde J, De Graaf A.A, Marx A, Eikmanns B.J, Wiechert W, Sahm H. 13C NMR studies of the fluxes in the central metabolism of Corynebacterium glutamicum during growth and overproduction of amino acids in batch cultures. Appl Microbiol Biotechnol. 1995;44:489–495. [Google Scholar]
- Spalla C, Grein A, Garofano L, Ferni G. Microbial production of vitamin B12. In: Spalla C, Vandamme E.J, editors. Elsevier; 1989. pp. 257–284. [Google Scholar]
- Sparrow C.P, Raetz C.R. A trans‐acting regulatory mutation that causes overproduction of phosphatidylserine synthase in Escherichia coli. J Biol Chem. 1983;258:9963–9967. [PubMed] [Google Scholar]
- Stahmann K.‐P. Vitamins. In: Osiewacz H.D, editor. Springer Verlag; 2002. pp. 231–246. [Google Scholar]
- Stemmer W.P. Rapid evolution of a protein in vitro by DNA shuffling. Nature. 1994;370:389–391. doi: 10.1038/370389a0. [DOI] [PubMed] [Google Scholar]
- Stephanopoulos G. Metabolic fluxes and metabolic engineering. Metab Eng. 1999;1:1–11. doi: 10.1006/mben.1998.0101. [DOI] [PubMed] [Google Scholar]
- Stewart G.C. Catabolite repression in the gram‐positive bacteria: generation of negative regulators of transcription. J Cell Biochem. 1993;51:25–28. doi: 10.1002/jcb.240510106. [DOI] [PubMed] [Google Scholar]
- Strauss J, Mach R.L, Zeilinger S, Hartler G, Stöffler G, Wolschek M, Kubicek C.P. Crel, the carbon catabolite repressor protein from Trichoderma reesei. FEBS Lett. 1995;376:103–107. doi: 10.1016/0014-5793(95)01255-5. [DOI] [PubMed] [Google Scholar]
- Sugimoto S.‐I, Shiio I. Enzymes of the common pathway for aromatic amino acid biosynthesis in Brevibacterium flavum and its tryptophan‐producing mutants. Agric Biol Chem. 1985;49:39–48. [Google Scholar]
- Sugimoto S, Yabuta M, Kato N, Seki T, Yoshida T, Taguchi H. Hyperproduction of phenylalanine by Escherichia coli: application of a temperature‐controllable expression vector carrying the repressor–promotor system of bacteriophage lambda. J Biotechnol. 1987;5:237–253. [Google Scholar]
- Sugita T, Komatsubara S. Construction of a threonine‐hyperproducing strain of Serratia marcescens by amplifying the phosphoenolpyruvate carboxylase gene. Appl Microbiol Biotechnol. 1989;30:290–293. [Google Scholar]
- Sugiura M, Takagi T, Kisumu M. Proline production by regulatory mutants of Serratia marcescens. Appl Microbiol Biotechnol. 1985a;21:213–239. [Google Scholar]
- Sugiura M, Imai Y, Takagi T, Kisumi M. Improvement of a proline‐producing strain of Serratia marcescens by subcloning of a mutant allele of the proline gene. J Biotechnol. 1985b;3:47–58. [Google Scholar]
- Sugiura M, Suzuki S.‐I, Kisumu M. Improvement of histidine‐producing strains of Serratia marcescens by cloning of a mutant allele of the histidine operon on a mini‐F plasmid vector. Agric Biol Chem. 1987;51:371–377. [Google Scholar]
- Suwannakham S, Yang S.‐T. Enhanced propionic acid fermentation by Propionibacterium acidipropionici mutant obtained by adaptation in a fibrous‐bed bioreactor. Biotechnol Bioeng. 2005;91:326–337. doi: 10.1002/bit.20473. [DOI] [PubMed] [Google Scholar]
- Switzer R.L. The inactivation of microbial enzymes in vivo. Annu Rev Microbiol. 1977;31:135–157. doi: 10.1146/annurev.mi.31.100177.001031. [DOI] [PubMed] [Google Scholar]
- Sybesma W, Burgess C, Starrenburg M, Van Sinderen D, Hugenholtz J. Multivitamin production in Lactococcus lactis using metabolic engineering. Metab Eng. 2004;6:109–115. doi: 10.1016/j.ymben.2003.11.002. [DOI] [PubMed] [Google Scholar]
- Tabuchi T, Tahara Y, Tanaka M, Yanagiuti S. Preliminary experiments on the mechanism of citrate fermentation in yeasts. J Agric Chem Soc. 1973;47:617–622. [Google Scholar]
- Taherzadeh M.J, Adler L, Liden G. Strategies for enhancing fermentative production of glycerol‐a review. Enzyme Microb Technol. 2002;31:53–66. [Google Scholar]
- Takac S, Calik G, Mavituna F, Dervakos G. Metabolic flux distribution for the optimized production of l‐glutamate. Enzyme Microb Technol. 1998;23:286–300. [Google Scholar]
- Tao L, Jackson R.E, Cheng Q. Directed evolution of copy number of a broad host range plasmid for metabolic engineering. Metab Eng. 2005;7:10–17. doi: 10.1016/j.ymben.2004.05.006. [DOI] [PubMed] [Google Scholar]
- Tao Y, Marzluf G.A. Synthesis and differential turnover of the CYS3 regulatory protein of Neurospora crassa are subject to sulfur control. J Bacteriol. 1998;180:478–482. doi: 10.1128/jb.180.3.478-482.1998. [DOI] [PMC free article] [PubMed] [Google Scholar]
- Torriani A, Rothman F. Mutants of Escherichia coli constitutive for alkaline phosphatase. J Bacteriol. 1961;81:835–836. doi: 10.1128/jb.81.5.835-836.1961. [DOI] [PMC free article] [PubMed] [Google Scholar]
- Tosaka O, Morioka H, Takinami K. The role of biotin‐dependent pyruvate carboxylase in l‐lysine production. Agric Biol Chem. 1979;43:1513–1519. [Google Scholar]
- Tsuchida T, Momose H. Improvement of an l‐leucine‐producing mutant of Brevibacterium lactofermentum 2256 by genetically desensitizing it to α‐acetohydroxy acid synthetase. Appl Environ Microbiol. 1986;51:1024–1027. doi: 10.1128/aem.51.5.1024-1027.1986. [DOI] [PMC free article] [PubMed] [Google Scholar]
- Tsuchida T, Kubota K, Yoshinaga F. Improvement of l‐proline production by sulfaguanidine resistant mutants derived from l‐glutamic acid‐producing bacteria. Agric Biol Chem. 1986;50:2201–2207. [Google Scholar]
- Urbance S.E, Pometto A.L, III, DiSpirito A.A, Denli Y. Evaluation of succinic acid continuous and repeat‐batch biofilm fermentation by Actinobacillus succinogenes using plastic composite support bioreactors. Appl Microbiol Biotechnol. 2004;65:664–670. doi: 10.1007/s00253-004-1634-2. [DOI] [PubMed] [Google Scholar]
- Vandamme E.J, Soetaert W. Personal care products via fermentation and biocatalysis processes. In: Lad R, editor. Taylor and Francis; 2006. pp. 27–56. [Google Scholar]
- Vemuri G.N, Eiteman M.A, Altman E. Succinate production in dual‐phase Escherichia coli fermentations depends on the time of transition from aerobic to anaerobic conditions. J Indust Microbiol Biotechnol. 2002;28:325–332. doi: 10.1038/sj/jim/7000250. [DOI] [PubMed] [Google Scholar]
- Vijaikishore P, Karanth N.G. Glycerol production by fermentation – a review. Proc Biochem. 1986;21:54–57. [Google Scholar]
- Vikar P.D, Panesar M.S. Glycerol production by anaerobic vacuum fermentation of molasses on a pilot scale. Biotechnol Bioeng. 1987;29:773–774. doi: 10.1002/bit.260290618. [DOI] [PubMed] [Google Scholar]
- Wada M, Takagi H. Metabolic pathways and biotechnological production of l‐cysteine. Appl Microbiol Biotechnol. 2006;73:48–54. doi: 10.1007/s00253-006-0587-z. [DOI] [PubMed] [Google Scholar]
- Wan H.‐M, Chen C.‐C, Chang T.‐S, Giridhar R.N, Wu W.‐T. Combining induced mutation and protoplasting for strain improvement of Aspergillus oryzae for kojic acid production. Biotech Lett. 2004;26:1163–1166. doi: 10.1023/B:BILE.0000035490.49252.38. [DOI] [PubMed] [Google Scholar]
- Wang Z.X, Zhuge J, Fang H, Prior B.A. Glycerol production by microbial fermentation. Biotechnol Adv. 2001;19:201–223. doi: 10.1016/s0734-9750(01)00060-x. [DOI] [PubMed] [Google Scholar]
- Wang Q, Peng H, Dajun L, An S, Ning J. Metabolic engineering of Torulopsis glabrata for improved pyruvate production. Enzyme Microb Technol. 2005;36:832–839. [Google Scholar]
- Wendisch V.F. Genome‐wide expression analysis in Corynebacterium glutamicum using DNA microarrays. J Biotechnol. 2003;104:273–285. doi: 10.1016/s0168-1656(03)00147-0. [DOI] [PubMed] [Google Scholar]
- Wendisch V.F. Towards improving production of fine chemicals by systems biology: amino acid production by Corynebacterium glutamicum. Chim Oggi Chem Today. 2005;23:49–52. [Google Scholar]
- Wendisch V.F. Genetic regulation of Corynebacterium glutamicum metabolism. J Microbiol Biotechnol. 2006;16:999–1009. [Google Scholar]
- Von Weymarn N, Hujanen M, Leisola M. Production of d‐mannitol by heterofermentative lactic acid bacteria. Proc Biochem. 2002;37:1207–1213. [Google Scholar]
- Woesten M.M.S. Eubacterial sigma‐factors. FEMS Microbiol Rev. 1998;22:127–150. doi: 10.1111/j.1574-6976.1998.tb00364.x. [DOI] [PubMed] [Google Scholar]
- Yanofsky C, Kelley R.L, Horn V. Repression is relieved before attenuation in the trp operon of Escherichia coli as tryptophan starvation becomes increasingly severe. J Bacteriol. 1984;158:1018–1024. doi: 10.1128/jb.158.3.1018-1024.1984. [DOI] [PMC free article] [PubMed] [Google Scholar]
- Yokota A, Terasawa Y, Takaoka N, Shimizu H, Tomita F. Pyruvic acid production by an F1‐ATPase‐defective mutant of E. coli W1485lip2. Biosci Biotechnol Biochem. 1994;58:2164–2167. doi: 10.1271/bbb.58.2164. [DOI] [PubMed] [Google Scholar]
- Yomano L.P, Cork S.W, Ingram L.O. Isolation and characterization of ethanol tolerant mutants of Escherichia coli K011 for fuel ethanol production. J Indust Microbiol Biotechnol. 1998;20:132–138. doi: 10.1038/sj.jim.2900496. [DOI] [PubMed] [Google Scholar]
- Yun J.W, Kim D.H. A comparative study of mannitol production by two lactic acid bacteria. J Ferm Bioeng. 1998;85:203–208. [Google Scholar]
- Zagustina N.A, Rodionova N.A, Mestechkina N.M, Shcherbukhin V.D, Bezborodov A.M. Xylitol production by a culture of Candida guilliermondii 2581. Appl Biochem Microbiol. 2001;37:489–492. [PubMed] [Google Scholar]
- Zeikus J.G, Jain M.K, Elankovan P. Biotechnology of succinic acid production and markets for derived industrial products. Appl Microbiol Biotechnol. 1999;51:545–552. [Google Scholar]
- Zhao H, Arnold F.H. Optimization of DNA shuffling for high fidelity recombination. Nucleic Acids Res. 1997;25:1307–1308. doi: 10.1093/nar/25.6.1307. [DOI] [PMC free article] [PubMed] [Google Scholar]
- Zhou S, Causey T.B, Hasona A, Shanmugam K.T, Ingram L.O. Production of optically pure d‐lactic acid in mineral salts medium by metabolically engineered Escherichia coli W3110. Appl Environ Microbiol. 2003;69:399–407. doi: 10.1128/AEM.69.1.399-407.2003. [DOI] [PMC free article] [PubMed] [Google Scholar]
- Zhuge J, Fang H.‐Y, Wang Z.‐X, Chen D.‐Z, Jin H.‐R, Gu H.‐L. Glycerol production by a novel osmotolerant yeast Candida glycerinogenes. Appl Microbiol Biotechnol. 2001;55:686–692. doi: 10.1007/s002530100596. [DOI] [PubMed] [Google Scholar]
- Znad H, Markos J, Bales V. Production of gluconic acid from glucose by Aspergillus niger. Proc Biochem. 2004;39:1341–1345. [Google Scholar]