Abstract
Phosphorylation-mediated signaling plays a crucial role in nearly every aspect of cellular physiology. A recent study based on protein microarray experiments identified a large number of kinase-substrate relationships (KSRs), and built a comprehensive and reliable phosphorylation network in humans. Analysis of this network, in conjunction with additional resources, revealed several key features. First, comparison of the human and yeast phosphorylation networks uncovered an evolutionarily conserved signaling backbone dominated by kinase-to-kinase relationships. Second, although most of the KSRs themselves are not conserved, the functions enriched in the substrates for a given kinase are often conserved. Third, the prevalence of kinase-transcription factor regulatory modules suggests that phosphorylation and transcriptional regulatory networks are inherently wired together to form integrated regulatory circuits. Overall, the phosphorylation networks described in this work promise to offer new insights into the properties of kinase signaling pathways, at both the global and the protein levels.
Keywords: phosphorylation network, kinase-substrate relationships (KSRs), network module, conservation
1. INTRODUCTION
Cells respond to a variety of signals, many of which are relayed from the cell membrane to specific intracellular targets. Protein phosphorylation, mediated by kinases, is one of the most important regulatory mechanisms during signal transduction. A kinase can be activated by incoming signals, and it subsequently alters the cellular function of other proteins through phosphorylation, which ultimately turn on genes that are responsive to the signals from their surroundings. Disruption in the signaling pathways has profound implications in a variety of human diseases [1–3]. For instance, mutations in kinase genes are frequently associated with human cancer [4, 5]. Therefore, identifying and characterizing kinase-mediated signal transduction pathways are critical for many aspects of cellular biology and also have potential clinical applications.
The model that depicts signaling pathways as a linear wiring diagram have been extremely useful to explain the properties of some biological systems; however, a large amount of genetic and biochemical data suggests that the network signaling model is a more complex one. For instance, a genome-wide RNAi screen of ERK/MAPK activity revealed that the contribution of each gene to the signaling output is continuous. In other words, various proteins participate in signal transduction with different levels of contribution [6]. Likewise, signaling networks underlying animal development are known to be resistant to both extrinsic and intrinsic perturbations; this robustness can be at least partially explained by a network model but not by a linear signaling model [7]. Finally, cancer genome sequencing projects have identified an average of 93 mutated genes per breast or colorectal tumor [8]. Because mutations in a few genes should sufficiently disrupt a signaling pathway, the finding of a large number of mutations per tumor suggests that signals are propagated through a signaling network, which needs many mutations to collapse the system. Together, this evidence strongly supports a network view of signal transduction rather than the canonical linear view. Constructing a phosphorylation-based signaling network will greatly help researchers perform a series of global analyses to gain new insights into the organization, specificity, and function of signaling networks.
The global analysis of phosphorylation networks in humans is limited due to our limited knowledge about KSRs in humans. Indeed, only ~2,000 human KSRs have been experimentally identified. In contrast, a large number of phosphorylation sites (>70,000) have been determined by MS/MS technology. Therefore, most of analysis of the phosphorylation events often focused on these sites, rather on the KSRs themselves. For example, evolutionarily conserved phosphorylation sites and their potential physiological functions were investigated by analyzing the phosphorylation sites in the human genome [9].
Recently, Newman et al published a study in which a large number of KSRs were determined by protein microarray technology and further refined by bioinformatics analysis [10]. This study resulted in 3,656 refined KSRs (refKSRs) that are likely to occur under physiological conditions, more than all KSRs generated from previous studies combined. In the present work, we used this comprehensive dataset to perform a series of global analyses of human phosphorylation networks.
2. METHODS
2.1 Datasets
In our previous study, we identified 24,046 kinase-substrate relationships (KSRs) using a protein microarray approach [10]. The complete set of in vitro KSRs were termed rawKSRs. The rawKSR dataset represents the biochemical relationships between kinases and their substrates. To enrich for physiologically relevant KSRs, we performed a Bayesian analysis by integrating other genomic and proteomic information such as sub-cellular localization, protein-protein interactions and tissue specificity [10, 11]. The resulting 3,656 KSRs were termed refined KSRs (refKSRs). We also integrated 744 known KSRs curated from the literature into the refKSR dataset to generate a combined KSR dataset (comKSR). The datasets are available in supplementary information as well as on a searchable web site (phosphonetworks.org).
2.2 Overlap of substrate sets of kinases
Supposing there are N candidate substrates in total, kinase A and B recognize MA and MB substrates, respectively, MAB of substrates are recognized by both kinases, the overlap rate (OR) of the two substrate sets can be computed by the Jaccard Index,
| (1) |
The significance of the overlap can be computed by cumulative Hypergeometric distribution (supposing MB ≥MA),
| (2) |
Here, N is equal to 4,191, the total number of proteins on our protein microarray.
2.3 Evolutionally conserved network modules
To investigate the properties of the phosphorylation network more thoroughly, we constructed network modules and analyzed their properties. Once all size-3 network modules including at least one kinase were enumerated, the statistical significance of each module was evaluated using the same method as described in [12]. In a similar manner, network module conservation analysis was carried out by comparing the modules identified in the human and yeast comKSR networks that involved homologs between these two organisms. Here, two proteins were considered to be homologous if the e-value of their primary amino acid sequence alignment (BLASTP) was lower than 10−20.
To obtain a dataset of yeast refined KSRs, we performed the same Bayesian analysis to the yeast KSRs obtained from the literature [13]. The gene expression is based on an integrated microarray expression dataset covering 255 different conditions [14], the cellular localization is based on GO annotation, and the protein-protein interactions are from databases and a recently published yeast kinase network [15]. We obtained 374 known yeast KSRs from the literature and various databases as positive controls and 20,000 protein pairs devoid of kinases as negative controls. After applying the Bayesian approach, we obtained 797 refKSR for yeast which, when combined with the 374 known KSRs, formed a comKSR dataset composed of 1167 yeast KSRs of high quality.
2.4 Comparison with conserved protein-protein interactions
To examine the relative conservation level of KSRs between human and yeast, we compared the conservation levels between KSR and protein-protein interactions (PPIs). We used the same standard to analyze conservation of the 55,048 human PPI that we collected before [11] relative to the 36,505 yeast PPI downloaded from the Intact database (http://www.ebi.ac.uk/intact). This analysis revealed that 1,068 of 55,048 human PPIs (1.94%) have orthologs in yeast, approximately three times lower than the KSR conservation rate (265/4375=6.06%).
2.5 Functional enrichment of a substrate set
If N is the number of proteins on our protein microarray, then M of them are annotated to have certain function by Gene Ontology. Likewise, if a kinase recognized Nk substrates and Mk of them are annotated to have that function by Gene Ontology, then the fold enrichment (FE) of the function in the substrate set can be computed by following formula,
| (3) |
The significance of the enrichment can be computed by cumulative Hypergeometric distribution,
| (4) |
2.6 Identification of network motifs with kinases and transcription factors
To examine the interplay between kinase-mediated phosphorylation and transcriptional regulation, ChIP-chip and ChIP-seq datasets were collected for a total of 94 transcription factors. CisGenome was then applied to each dataset in order to identify peaks in the genome [16]. The phosphorylation networks and the transcriptional regulatory networks were then superimposed and all size-2 and size-3 network modules which included at least one transcription factor and one kinase were evaluated. Finally, the statistical significance of 70 network modules was evaluated by comparing the occurrence of each module in the real and the randomized networks. The randomized network is a degree-preserving network in which the incoming degree (number of regulators on the node) and the outgoing degree (number of targets of the node) for each node are preserved relative to the real network [12].
3. RESULTS
3.1 General properties of kinase-substrate relationships
We identified KSRs in humans using protein microarray approach in our previous study [17]. The resulting dataset (comKSR) covers 4,375 KSRs. Using this dataset, we performed a series of global analyses to gain new insights into the organization, specificity, and function of human KSRs.
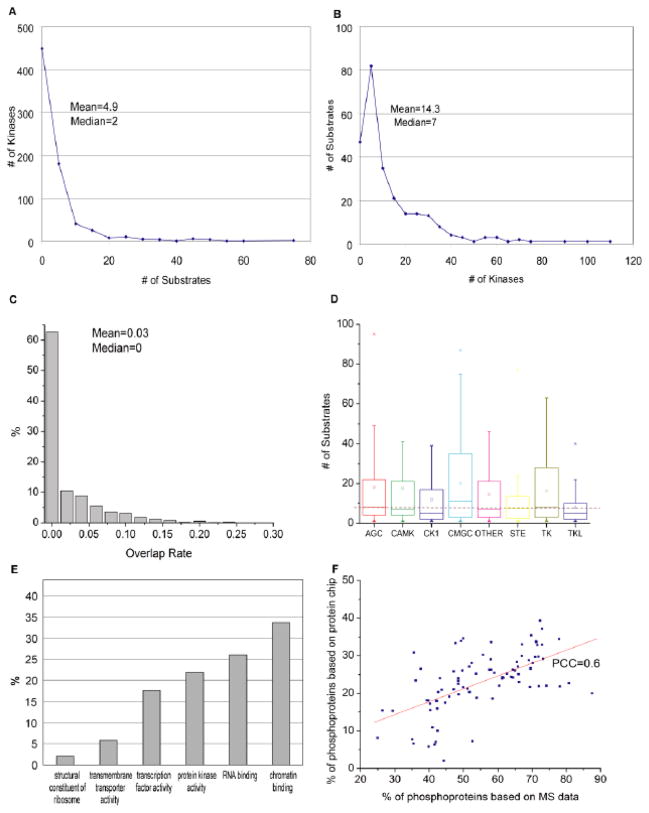
Based on this KSR dataset, we found that each kinase phosphorylated a distinct set of substrates, with the set sizes ranging from 1 to 134. On average, each kinase phosphorylated 14 substrates (Fig. 1A). Similarly, most substrates (87%) were recognized by fewer than 10 kinases, with each substrate being targeted by an average of 4.9 kinases (Fig. 1B). In general, there was little to no overlap between the specific substrates recognized by any given pair of kinases (Fig. 1C). Nonetheless, in some cases, we did observe substantial substrate overlap between a pair of kinases. For example, Erk2 and CHK2 checkpoint homolog (CHEK2), two kinases involved in the DNA damage response [18, 19], shared a subset of their substrates. Indeed, of the 30 and 15 substrates phosphorylated by Erk2 and CHEK2, respectively, six are shared between them (P<10−9). Overall, we found that, while the majority of kinases occupy distinct territories in the phosphorylation landscape, about 20% of kinase pairs among all possible kinase pairs (255×254/2=32,385) exert combinatorial regulation on certain substrates. These overlapped substrates tend to have various enriched functions, including “cellular response to stimulus”, “regulation of protein transport”, and “DNA metabolic process”.
Fig. 1. Statistics of human phosphorylation network.
(A) The number of kinases per substrate and (B) the number of substrates per kinase are plotted. Mean and median values are shown. (C) The distribution of substrate overlap rate among all possible kinase pairs. Supposing A and B are the substrate sets of a pair of kinases, the overlap rate is defined as Jaccard Index (A∩B)/(A∪B). (D) The distribution of substrate numbers per kinase among different kinase groups. The bottom and top of the boxes represent the 25th and 75th percentile of the distribution, respectively. The line near the middle of the box represents the 50th percentile. The empty squares in each box indicate the mean. The whiskers represent the 9th percentile and the 91st percentile. The dashed line across the figure indicates the overall average number of substrates per kinase identified in this study. (E) The distribution of phosphoproteins across various protein families. The Y-axis represents the fraction of proteins identified as kinase substrates in each of the six major protein families indicated. (F) The phosphoprotein percentage for different functional groups. Each point corresponds to one functional group (i.e., a GO term, such as “RNA-binding proteins”). The X-axis is the percentage calculated based on MS/MS data while the Y-axis is based on our protein microarray data. A good correlation between these two independent studies is observed. PCC, Pearson correlation coefficient.
This dataset also allowed us to determine whether a particular kinase group tends to recognize more substrates than other groups. While these analyses uncovered no obvious associations between the average number of substrates per kinase and the groups to which these kinases belong (p=0.24, ANOVA; Fig. 1D), they did reveal that the distribution of substrate number within a given kinase group can be quite broad. For example, whereas the CAMK group member, STK17A/Drak1, recognized 134 substrates, its fellow group member, STK33, phosphorylated only 3 substrates. These findings imply that, although the sequence similarity of the kinase domain within a particular kinase group is high, the mechanism of achieving substrate specificity may be unique for most kinases.
In contrast, when the KSRs were examined from the substrate perspective, we observed considerable variability in the percentage of phosphoproteins identified across different protein classes (Fig. 1E). For instance, while 34% (32/95) of the chromatin proteins tested were found in the KSRs, only 2% (2/96) of the ribosomal proteins in the dataset were phosphorylated. Interestingly, 22% (75/343) of kinases themselves were phosphorylated by other kinases. Note that the percentages of phosphoproteins in different protein classes correlate well with those identified by the MS/MS approach (PCC=0.6; Fig. 1F). These findings suggest that some protein families are more prone to kinase-mediated regulation than others.
3.2 Conserved kinase-to-kinase backbone
The construction of an extensive human phosphorylation network allowed us to explore the extent to which kinase-dependent signaling networks have been maintained throughout evolution. For instance, by comparing the human KSR dataset with an activity-based yeast KSR dataset [13] refined using our Bayesian approach [15], we discovered that, in general, KSRs are not well-conserved between yeast and humans. Indeed, of the 4,375 human comKSRs, only 265 (6.1%) are conserved between these two species (despite this relatively low degree conservation, the conservation rate among KSRs is still 3-fold higher than that of the protein-protein interactions between human and yeast (1.9%)).
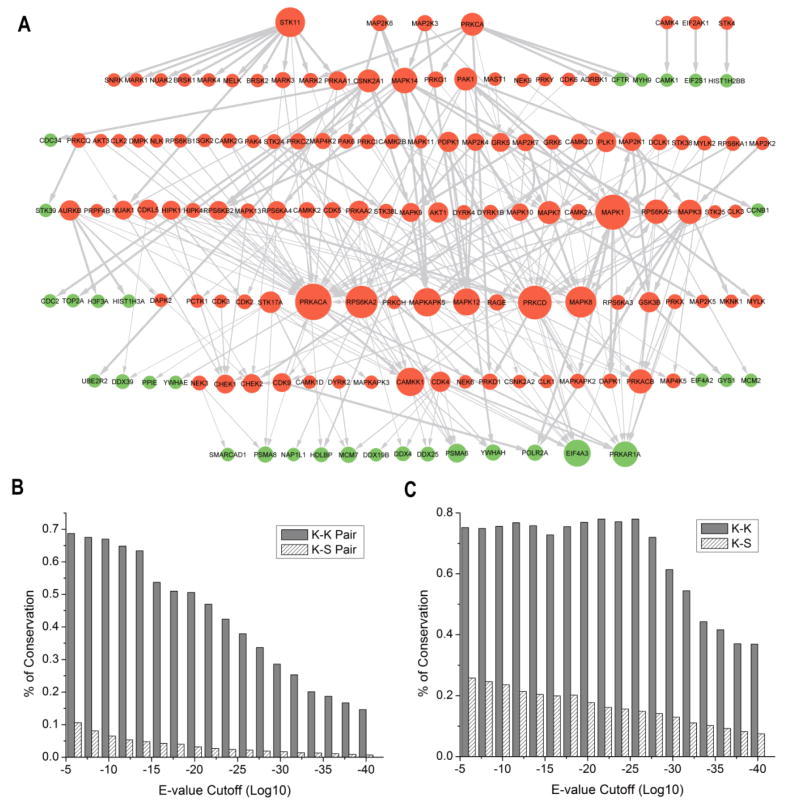
Strikingly, however, among the conserved KSRs, kinase-to-kinase relationships are much more highly represented than kinase-to-non-kinase relationships. In fact, 75% of the conserved KSRs correspond to kinase-to-kinase relationships (Fig. 2A). Moreover, the conservation rate observed for kinase-to-kinase relationships (34%, 198/581) is 19 times higher than that observed for kinase-to-non-kinase relationships (1.8%, 67/3794) (P=6.18×10−128). Similar results were also obtained when we compared our human phosphorylation network with another yeast network constructed using an orthogonal MS/MS-based approach [20]. According to this comparison, the fraction of conserved kinase-to-kinase relationships (38.6%; 224/581) is 15.6 times higher than that of kinase-to-non-kinase relationships (2.48%; 94/3794) (P=1.93×10−137). Together, these findings strongly suggest that a kinase backbone (i.e., kinase-to-kinase connections) within the phosphorylation networks has been highly conserved during evolution, whereas other KSRs are under less evolutionary constraint (Fig. 2A).
Fig. 2. Evolutionarily conserved core.
(A) Conserved core of phosphorylation networks identified by comparing the human and yeast KSR networks. Kinases and non-kinase proteins are represented in orange and green nodes, respectively. The size of the nodes is proportional to the number of associated interactions. (B) The overall conservation of K–K and K–S relationships. All human KSRs were compared with yeast and the percentage of conserved human KSRs was calculated for each cutoff. The conservation was defined as that the two proteins (kinase and substrate) have homologs in yeast and the homologous pairs also have the same KSR relationship in both species. (C) The conservation of human K–K and K–S in which the two proteins (kinase and substrate) both have homologs in yeast. Using this approach, we essentially removed the contribution from the protein sequence conservation and only considered the contribution from the kinase-substrate interaction conservation.
These observations can be attributed to conservation at the levels of both the protein sequence and the phosphorylation relationship (Fig. 2B and C). For instance, we examined the protein sequence conservation and found that the kinases are more conserved than other proteins. 83% of kinase proteins have orthologs in yeast, whereas only 41% of non-kinases proteins have orthologs in yeast. We also investigated whether the kinase-to-kinase relationships are also more conserved than kinase-to-non-kinase relationships beyond the protein sequence level. To exclude the contribution from protein sequence conservation, we examined the conservation level only for KSRs in which the two proteins (kinase and substrate) have homologs in yeast. For this comparison, we still found that kinase-to-kinase relationships are more conserved than kinase-to-non-kinase relationships (Fig. 2C), suggesting that the observed conservation level difference results from both protein sequences and phosphorylation relationships. The observation is not sensitive to the cutoff or methods used to define the ortholog, such as Ensembl (http://ensembl.org) and Inparanoid (http://inparanoid.sbc.su.se). For example, different BLAST E-values ranging from 1e–5 to 1e–40 were used to define homologs and the same trend was observed (Fig. 2B, C).
3.3 Functional conservation of kinase substrates
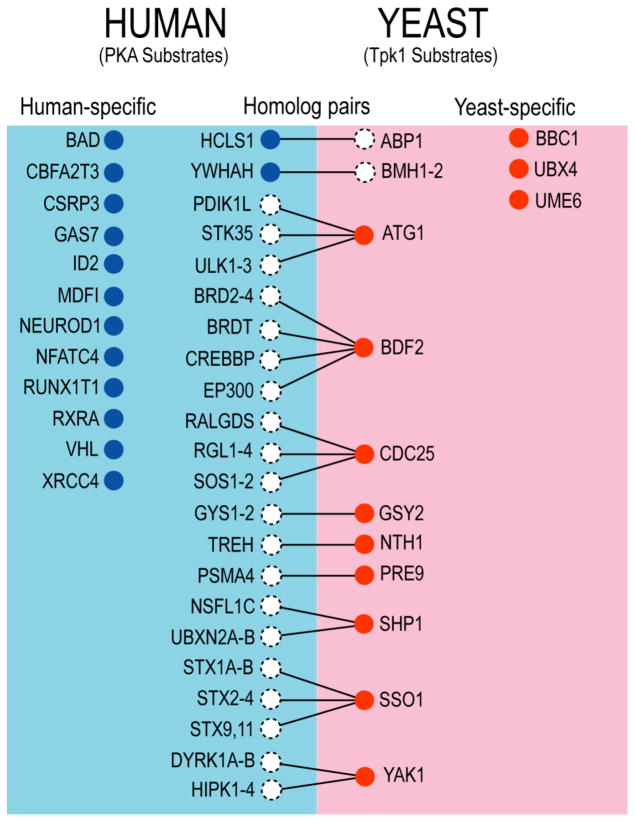
Among the kinases in the group composed of kinase-to-non-kinase relationships, some were found to be functionally conserved between humans and yeast, despite the fact that their identified substrates show little conservation. For example, 14 of the 71 substrates phosphorylated by PKA are known to be involved in cell differentiation (P<3×10⁻⁵); meanwhile, 12 of the 112 substrates phosphorylated by its yeast homolog, Tpk1, also belong to the same functional category (P<2×10⁻⁴) (Fig. 3). This observation suggests that the two homologous kinases are functionally conserved. However, there is little conservation between the two substrate groups. Indeed, PKA and Tpk1 each recognized distinct substrates involved in cell differentiation. In fact, many of the substrates phosphorylated by PKA have no homolog in yeast and vice versa. For instance, while three yeast-specific substrates of Tpk1 are not conserved in higher eukaryotes, most (9 of 12) human-specific substrates are only found in vertebrates. Consistently, many of the proteins phosphorylated by human PKA are involved in biological processes specific to multi-cellular organisms, such as regulation of tissue-specific gene expression (ID2), myogenesis (CSRP3), and neuronal development (GAS7 and NEUROD1). It is plausible that these proteins have evolved independently in higher eukaryotes to accommodate more complex processes of cell differentiation. Overall, 19 of the 27 orthologous kinase pairs defined by the Ensembl database were found to have conserved enriched function in their substrate sets, despite the fact that their identified substrates show little conservation (Table 1).
Fig. 3. Functional conservation between human PKA and yeast Tpk1.
The substrates involved in cell differentiation are shown for these two kinases. Short lines indicate for homologous relationships between proteins from human and yeast.
Table 1.
Ortholog kinase pairs with conserved enriched function in their substrate set.
| Human Kinase | Yeast Ortholog | Conserved enriched function in substrate set |
|---|---|---|
| CDK4 | Cdc28 | DNA binding; Protein binding |
| CDK5 | Cdc28 | Protein binding; DNA metabolism |
| CDKL5 | Ime2 | RNA metabolism |
| CSNK2A2 | Cka1 | Protein binding |
| MAPK1 | Fus3 | DNA metabolism; Chromosome Organization |
| MAPK1 | Kss1 | Protein modification; Macromolecule metabolism |
| MAPK3 | Fus3 | Macromolecule metabolism |
| MAPK3 | Kss1 | Protein modification; Macromolecule metabolism |
| MAPK7 | Fus3 | Macromolecule metabolism |
| MAPK7 | Kss1 | Protein modification; Macromolecule metabolism |
| PAK1 | Ste20 | Regulation of transport |
| PDPK1 | Pkh1 | Protein binding |
| PLK1 | YMR001C-A | Biological regulation |
| PRKAA1 | Snf1 | Development |
| PRKACA | Tpk1 | Cell differentiation; Transcriptional regulation |
| PRKACA | Tpk3 | Transcriptional regulation; Response to stimulus |
| PRKY | Tpk1 | Transcriptional regulation |
| PRKY | Tpk3 | Transcriptional regulation; regulation of RNA metabolism |
| WEE1 | Swe1 | Transcriptional regulation; Macromolecular metabolism |
In summary, our analysis suggests that conserved phosphorylation regulation can be found both at the molecular level in the form of direct kinase-to-kinase relationships, as well as at higher functional levels.
3.4 Conserved network modules
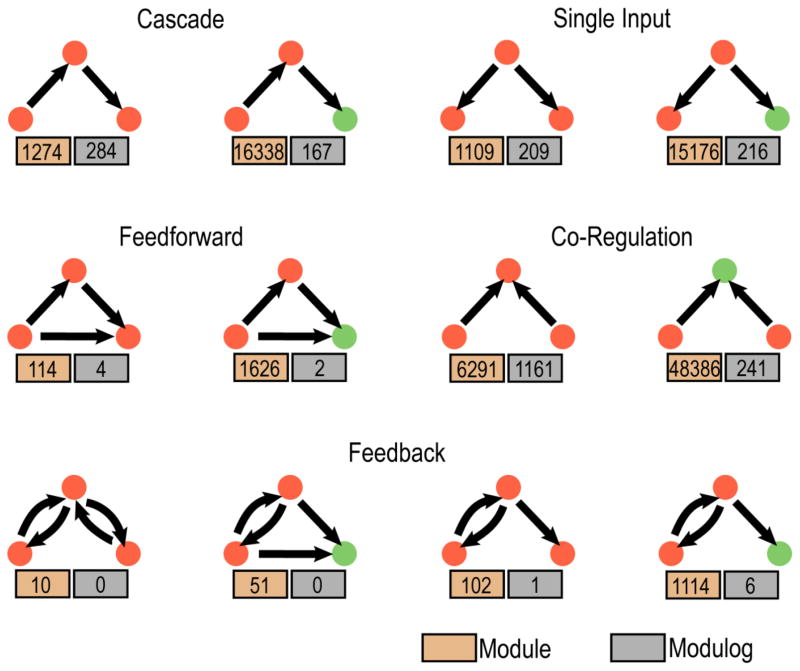
We next examined which types of interaction patterns (i.e., modules) are more conserved in the phosphorylation networks (see method for details). Among the modules that are widely used in the human KSR network, several are highly conserved (these conserved modules are termed “modulogs”) [21, 22]. The top three conserved modulogs are kinase cascades, single input (i.e., one kinase phosphorylates multiple proteins), and co-regulation (i.e., two kinases co-regulate one protein). Indeed, these three modulogs are conserved in 22.2%, 18.8%, and 18.5% of the cases, respectively (Fig. 4). The prevalence of conserved single input and co-regulation modulogs suggests that parallel or compensatory interactions are a conserved and widely used design principle in eukaryotic phosphorylation networks [23]. In addition, cascade and co-regulation motifs were found to be enriched in exogenous processes while single input and feedforward loops were enriched in endogenous processes [24]. Interestingly, feedforward and feedback modules, which play important roles in transcriptional regulatory networks, are utilized to a lesser degree in the phosphorylation network and are also less well-conserved [25, 26]. Together, our network module analysis not only offers important insights into the organization of intracellular signaling networks, but it also provides clues about the context and relative frequency with which different signaling architectures are utilized within these networks. Using this approach, we identified several significantly conserved modules between human and yeast which, based on their high degree of conservation, are likely to play an important role in the organization of signaling networks in eukaryotes.
Fig. 4. Representative conserved modulogs.
A modulog is defined as evolutionarily conserved regulatory modules (see text for more details). The two numbers under each module represent the number of this module found in the human comKSRs (orange box) and that found in the conserved core KSR networks (grey boxes), respectively.
3.5 Wired phosphorylation and transcription regulatory networks
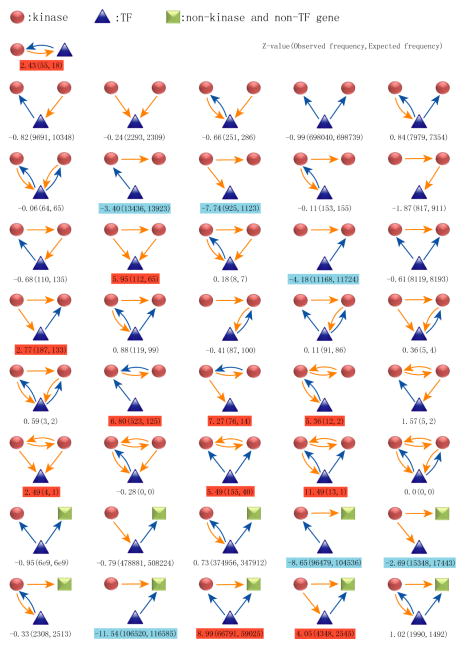
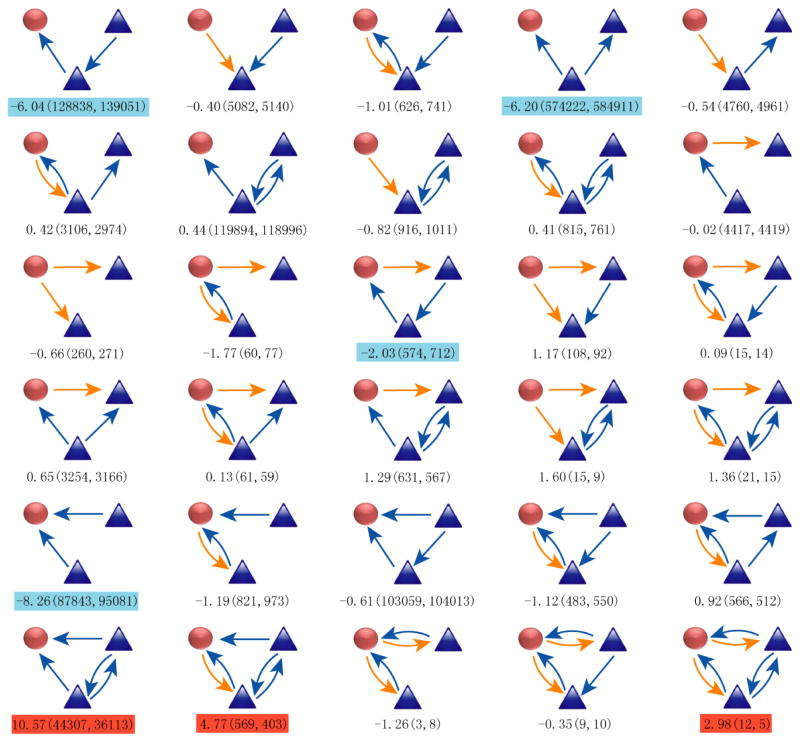
Next, we examined the interplay between protein phosphorylation and other biological processes, in particular transcriptional regulation. We first assembled a transcriptional regulatory network based upon genome-wide transcription factor binding data (see method for details) and then integrated these findings into our phosphorylation network. Searching this integrated network for common regulatory modules, we found several statistically significant recurring modules that include both kinase-substrate and transcriptional regulatory interactions (Fig. 5). For example, we found 55 kinase-transcription factor feedback modules in which the kinase phosphorylates a transcription factor and the transcription factor binds to the promoter of the kinase gene. This type of feedback module is of high statistical significance, as only 18 cases would be expected in a randomized network (P<10−20). In one such example, CHEK2 phosphorylates and activates E2F1 in response to DNA damage [27], while E2F1 targets the promoter of CHEK2 [28]. These results suggest that phosphorylation and transcriptional regulatory networks are inherently wired together to integrate controls at different macromolecular levels and distinct temporal scales.
Fig. 5. List of 71 modules that include at least one transcription factor (TF) and one kinase.
Arrows starting from kinases (orange) represent phosphorylation events, while arrows starting from TFs (blue) represent transcriptional activity. The three numbers below each module are the Z-score, the observed and expected numbers of the module in the network, respectively. The over- and under-represented modules are highlighted in red and blue, respectively.
4. DISCUSSION
An exciting finding in this study is the discovery that an evolutionarily conserved kinase backbone exists between yeast and humans. The conserved kinase backbone is enriched with proteins involved in certain biological functions, such as the MAPKK and MAPK isoforms that are known to participate in some of the most fundamental biological processes, including protein metabolism and cellular responses to stress (Table 2). Although one may argue that protein kinases tend to be more conserved at the sequence level, we note that the conservation level of kinase-to-kinase relationships can be attributed to conservation at the levels of both the protein sequence and the phosphorylation relationship, itself (Figure 2 B and C). On the other hand, we also found that kinase-to-non-kinase relationships are much less conserved. It is generally believed that linear motifs possess more evolutionary plasticity than protein domains because the former are more likely to appear or disappear via single point mutations [29]. In fact, many phosphorylation events have been mapped to unstructured loop regions [30], suggesting that KSRs might be subject to rapid evolution. However, we found that kinase homologs from different species often retain the same functions, despite the fact that their respective substrates are largely distinct. This may suggest that rewiring in the KSR subnetworks composed of proteins with the same biological function is subject to less evolutionary constraint, in analogy to synonymous substitution in biological sequence evolution.
Table 2.
Representative GO terms enriched in the conserved KSR network.
| GO Term | # Observed | # Expected | P-value | GO annotation |
|---|---|---|---|---|
| GO:0006468 | 146 | 16.99 | 1.16E-122 | Protein amino acid phosphorylation |
| GO:0019538 | 158 | 36.52 | 1.79E-82 | Protein metabolic process |
| GO:0000165 | 15 | 1.34 | 2.45E-10 | MAPKKK cascade |
| GO:0007254 | 8 | 0.51 | 3.26E-06 | JNK cascade |
| GO:0007265 | 12 | 1.39 | 4.07E-06 | Ras protein signal transduction |
| GO:0006950 | 52 | 22.88 | 5.16E-06 | Response to stress |
Supplementary Material
Highlights.
A conserved kinase-to-kinase backbone exists in the phosphorylation networks;
Functions of homologous kinases are often conserved, even with distinct substrates;
Phosphorylation networks are inherently wired with gene regulatory networks.
Footnotes
Publisher's Disclaimer: This is a PDF file of an unedited manuscript that has been accepted for publication. As a service to our customers we are providing this early version of the manuscript. The manuscript will undergo copyediting, typesetting, and review of the resulting proof before it is published in its final citable form. Please note that during the production process errors may be discovered which could affect the content, and all legal disclaimers that apply to the journal pertain.
References
- 1.Mullor JL, Sanchez P, Ruiz i Altaba A. Pathways and consequences: Hedgehog signaling in human disease. Trends Cell Biol. 2002;12:562–569. doi: 10.1016/s0962-8924(02)02405-4. [DOI] [PubMed] [Google Scholar]
- 2.Nusse R. Wnt signaling in disease and in development. Cell Res. 2005;15:28–32. doi: 10.1038/sj.cr.7290260. [DOI] [PubMed] [Google Scholar]
- 3.Smahi A, Courtois G, Rabia SH, Doffinger R, Bodemer C, Munnich A, Casanova JL, Israel A. The NF-kappaB signalling pathway in human diseases: from incontinentia pigmenti to ectodermal dysplasias and immune-deficiency syndromes. Hum Mol Genet. 2002;11:2371–2375. doi: 10.1093/hmg/11.20.2371. [DOI] [PubMed] [Google Scholar]
- 4.Tsatsanis C, Spandidos DA. The role of oncogenic kinases in human cancer (Review) Int J Mol Med. 2000;5:583–590. doi: 10.3892/ijmm.5.6.583. [DOI] [PubMed] [Google Scholar]
- 5.Richardson CJ, Gao Q, Mitsopoulous C, Zvelebil M, Pearl LH, Pearl FM. MoKCa database--mutations of kinases in cancer. Nucleic Acids Res. 2009;37:D824–831. doi: 10.1093/nar/gkn832. [DOI] [PMC free article] [PubMed] [Google Scholar]
- 6.Friedman A, Perrimon N. A functional RNAi screen for regulators of receptor tyrosine kinase and ERK signalling. Nature. 2006;444:230–234. doi: 10.1038/nature05280. [DOI] [PubMed] [Google Scholar]
- 7.Stelling J, Sauer U, Szallasi Z, Doyle FJ, 3rd, Doyle J. Robustness of cellular functions. Cell. 2004;118:675–685. doi: 10.1016/j.cell.2004.09.008. [DOI] [PubMed] [Google Scholar]
- 8.Sjoblom T, Jones S, Wood LD, Parsons DW, Lin J, Barber TD, Mandelker D, Leary RJ, Ptak J, Silliman N, Szabo S, Buckhaults P, Farrell C, Meeh P, Markowitz SD, Willis J, Dawson D, Willson JK, Gazdar AF, Hartigan J, Wu L, Liu C, Parmigiani G, Park BH, Bachman KE, Papadopoulos N, Vogelstein B, Kinzler KW, Velculescu VE. The consensus coding sequences of human breast and colorectal cancers. Science. 2006;314:268–274. doi: 10.1126/science.1133427. [DOI] [PubMed] [Google Scholar]
- 9.Tan CS, Bodenmiller B, Pasculescu A, Jovanovic M, Hengartner MO, Jorgensen C, Bader GD, Aebersold R, Pawson T, Linding R. Comparative analysis reveals conserved protein phosphorylation networks implicated in multiple diseases. Sci Signal. 2009;2:ra39. doi: 10.1126/scisignal.2000316. [DOI] [PubMed] [Google Scholar]
- 10.Newman RH, Hu J, Rho H, Xie Z, Woodard C, Neiswinger J, Cooper C, Shirley M, Clark HM, Hu S, Hwang W, Jeong J, Wu G, Lin J, Gao X, Ni Q, Goel R, Xia S, Ji H, Dalby KN, Birnbaum MJ, Cole PA, Knapp S, Ryazanov AG, Zack DJ, BlackShaw S, Pawson T, Gingras AC, Desiderio S, Pandey A, Turk BE, Zhang J, Zhu H, Qian J. Construction of Human Activity-Based Phosphorylation Networks. Mol Syst Biol. 2013 doi: 10.1038/msb.2013.12. In Press. [DOI] [PMC free article] [PubMed] [Google Scholar]
- 11.Hu J, Wan J, Hackler L, Jr, Zack DJ, Qian J. Computational analysis of tissue-specific gene networks: application to murine retinal functional studies. Bioinformatics. 2010;26:2289–2297. doi: 10.1093/bioinformatics/btq408. [DOI] [PMC free article] [PubMed] [Google Scholar]
- 12.Yu X, Lin J, Zack DJ, Mendell JT, Qian J. Analysis of regulatory network topology reveals functionally distinct classes of microRNAs. Nucleic Acids Res. 2008;36:6494–6503. doi: 10.1093/nar/gkn712. [DOI] [PMC free article] [PubMed] [Google Scholar]
- 13.Ptacek J, Devgan G, Michaud G, Zhu H, Zhu X, Fasolo J, Guo H, Jona G, Breitkreutz A, Sopko R, McCartney RR, Schmidt MC, Rachidi N, Lee SJ, Mah AS, Meng L, Stark MJ, Stern DF, De Virgilio C, Tyers M, Andrews B, Gerstein M, Schweitzer B, Predki PF, Snyder M. Global analysis of protein phosphorylation in yeast. Nature. 2005;438:679–684. doi: 10.1038/nature04187. [DOI] [PubMed] [Google Scholar]
- 14.Beer MA, Tavazoie S. Predicting gene expression from sequence. Cell. 2004;117:185–198. doi: 10.1016/s0092-8674(04)00304-6. [DOI] [PubMed] [Google Scholar]
- 15.Breitkreutz A, Choi H, Sharom JR, Boucher L, Neduva V, Larsen B, Lin ZY, Breitkreutz BJ, Stark C, Liu G, Ahn J, Dewar-Darch D, Reguly T, Tang X, Almeida R, Qin ZS, Pawson T, Gingras AC, Nesvizhskii AI, Tyers M. A global protein kinase and phosphatase interaction network in yeast. Science. 2010;328:1043–1046. doi: 10.1126/science.1176495. [DOI] [PMC free article] [PubMed] [Google Scholar]
- 16.Ji H, Jiang H, Ma W, Johnson DS, Myers RM, Wong WH. An integrated software system for analyzing ChIP-chip and ChIP-seq data. Nat Biotechnol. 2008;26:1293–1300. doi: 10.1038/nbt.1505. [DOI] [PMC free article] [PubMed] [Google Scholar]
- 17.Hu S, Xie Z, Onishi A, Yu X, Jiang L, Lin J, Rho HS, Woodard C, Wang H, Jeong JS, Long S, He X, Wade H, Blackshaw S, Qian J, Zhu H. Profiling the human protein-DNA interactome reveals ERK2 as a transcriptional repressor of interferon signaling. Cell. 2009;139:610–622. doi: 10.1016/j.cell.2009.08.037. [DOI] [PMC free article] [PubMed] [Google Scholar]
- 18.Wei F, Xie Y, Tao L, Tang D. Both ERK1 and ERK2 kinases promote G2/M arrest in etoposide-treated MCF7 cells by facilitating ATM activation. Cell Signal. 2010;22:1783–1789. doi: 10.1016/j.cellsig.2010.07.007. [DOI] [PubMed] [Google Scholar]
- 19.Matsuoka S, Huang M, Elledge SJ. Linkage of ATM to cell cycle regulation by the Chk2 protein kinase. Science. 1998;282:1893–1897. doi: 10.1126/science.282.5395.1893. [DOI] [PubMed] [Google Scholar]
- 20.Bodenmiller B, Wanka S, Kraft C, Urban J, Campbell D, Pedrioli PG, Gerrits B, Picotti P, Lam H, Vitek O, Brusniak MY, Roschitzki B, Zhang C, Shokat KM, Schlapbach R, Colman-Lerner A, Nolan GP, Nesvizhskii AI, Peter M, Loewith R, von Mering C, Aebersold R. Phosphoproteomic analysis reveals interconnected system-wide responses to perturbations of kinases and phosphatases in yeast. Sci Signal. 2010;3:rs4. doi: 10.1126/scisignal.2001182. [DOI] [PMC free article] [PubMed] [Google Scholar]
- 21.Bandyopadhyay S, Chiang CY, Srivastava J, Gersten M, White S, Bell R, Kurschner C, Martin CH, Smoot M, Sahasrabudhe S, Barber DL, Chanda SK, Ideker T. A human MAP kinase interactome. Nat Methods. 2010;7:801–805. doi: 10.1038/nmeth.1506. [DOI] [PMC free article] [PubMed] [Google Scholar]
- 22.Sharan R, Suthram S, Kelley RM, Kuhn T, McCuine S, Uetz P, Sittler T, Karp RM, Ideker T. Conserved patterns of protein interaction in multiple species. Proc Natl Acad Sci U S A. 2005;102:1974–1979. doi: 10.1073/pnas.0409522102. [DOI] [PMC free article] [PubMed] [Google Scholar]
- 23.Fiedler D, Braberg H, Mehta M, Chechik G, Cagney G, Mukherjee P, Silva AC, Shales M, Collins SR, van Wageningen S, Kemmeren P, Holstege FC, Weissman JS, Keogh MC, Koller D, Shokat KM, Krogan NJ. Functional organization of the S. cerevisiae phosphorylation network. Cell. 2009;136:952–963. doi: 10.1016/j.cell.2008.12.039. [DOI] [PMC free article] [PubMed] [Google Scholar]
- 24.Meshi O, Shlomi T, Ruppin E. Evolutionary conservation and over-representation of functionally enriched network patterns in the yeast regulatory network. BMC Syst Biol. 2007;1:1. doi: 10.1186/1752-0509-1-1. [DOI] [PMC free article] [PubMed] [Google Scholar]
- 25.Shen-Orr SS, Milo R, Mangan S, Alon U. Network motifs in the transcriptional regulation network of Escherichia coli. Nat Genet. 2002;31:64–68. doi: 10.1038/ng881. [DOI] [PubMed] [Google Scholar]
- 26.Alon U. Network motifs: theory and experimental approaches. Nat Rev Genet. 2007;8:450–461. doi: 10.1038/nrg2102. [DOI] [PubMed] [Google Scholar]
- 27.Stevens C, Smith L, La Thangue NB. Chk2 activates E2F-1 in response to DNA damage. Nat Cell Biol. 2003;5:401–409. doi: 10.1038/ncb974. [DOI] [PubMed] [Google Scholar]
- 28.Birney E, Stamatoyannopoulos JA, Dutta A, Guigo R, Gingeras TR, Margulies EH, Weng Z, Snyder M, Dermitzakis ET, Thurman RE, Kuehn MS, Taylor CM, Neph S, Koch CM, Asthana S, Malhotra A, Adzhubei I, Greenbaum JA, Andrews RM, Flicek P, Boyle PJ, Cao H, Carter NP, Clelland GK, Davis S, Day N, Dhami P, Dillon SC, Dorschner MO, Fiegler H, Giresi PG, Goldy J, Hawrylycz M, Haydock A, Humbert R, James KD, Johnson BE, Johnson EM, Frum TT, Rosenzweig ER, Karnani N, Lee K, Lefebvre GC, Navas PA, Neri F, Parker SC, Sabo PJ, Sandstrom R, Shafer A, Vetrie D, Weaver M, Wilcox S, Yu M, Collins FS, Dekker J, Lieb JD, Tullius TD, Crawford GE, Sunyaev S, Noble WS, Dunham I, Denoeud F, Reymond A, Kapranov P, Rozowsky J, Zheng D, Castelo R, Frankish A, Harrow J, Ghosh S, Sandelin A, Hofacker IL, Baertsch R, Keefe D, Dike S, Cheng J, Hirsch HA, Sekinger EA, Lagarde J, Abril JF, Shahab A, Flamm C, Fried C, Hackermuller J, Hertel J, Lindemeyer M, Missal K, Tanzer A, Washietl S, Korbel J, Emanuelsson O, Pedersen JS, Holroyd N, Taylor R, Swarbreck D, Matthews N, Dickson MC, Thomas DJ, Weirauch MT, Gilbert J, Drenkow J, Bell I, Zhao X, Srinivasan KG, Sung WK, Ooi HS, Chiu KP, Foissac S, Alioto T, Brent M, Pachter L, Tress ML, Valencia A, Choo SW, Choo CY, Ucla C, Manzano C, Wyss C, Cheung E, Clark TG, Brown JB, Ganesh M, Patel S, Tammana H, Chrast J, Henrichsen CN, Kai C, Kawai J, Nagalakshmi U, Wu J, Lian Z, Lian J, Newburger P, Zhang X, Bickel P, Mattick JS, Carninci P, Hayashizaki Y, Weissman S, Hubbard T, Myers RM, Rogers J, Stadler PF, Lowe TM, Wei CL, Ruan Y, Struhl K, Gerstein M, Antonarakis SE, Fu Y, Green ED, Karaoz U, Siepel A, Taylor J, Liefer LA, Wetterstrand KA, Good PJ, Feingold EA, Guyer MS, Cooper GM, Asimenos G, Dewey CN, Hou M, Nikolaev S, Montoya-Burgos JI, Loytynoja A, Whelan S, Pardi F, Massingham T, Huang H, Zhang NR, Holmes I, Mullikin JC, Ureta-Vidal A, Paten B, Seringhaus M, Church D, Rosenbloom K, Kent WJ, Stone EA, Batzoglou S, Goldman N, Hardison RC, Haussler D, Miller W, Sidow A, Trinklein ND, Zhang ZD, Barrera L, Stuart R, King DC, Ameur A, Enroth S, Bieda MC, Kim J, Bhinge AA, Jiang N, Liu J, Yao F, Vega VB, Lee CW, Ng P, Yang A, Moqtaderi Z, Zhu Z, Xu X, Squazzo S, Oberley MJ, Inman D, Singer MA, Richmond TA, Munn KJ, Rada-Iglesias A, Wallerman O, Komorowski J, Fowler JC, Couttet P, Bruce AW, Dovey OM, Ellis PD, Langford CF, Nix DA, Euskirchen G, Hartman S, Urban AE, Kraus P, Van Calcar S, Heintzman N, Kim TH, Wang K, Qu C, Hon G, Luna R, Glass CK, Rosenfeld MG, Aldred SF, Cooper SJ, Halees A, Lin JM, Shulha HP, Xu M, Haidar JN, Yu Y, Iyer VR, Green RD, Wadelius C, Farnham PJ, Ren B, Harte RA, Hinrichs AS, Trumbower H, Clawson H, Hillman-Jackson J, Zweig AS, Smith K, Thakkapallayil A, Barber G, Kuhn RM, Karolchik D, Armengol L, Bird CP, de Bakker PI, Kern AD, Lopez-Bigas N, Martin JD, Stranger BE, Woodroffe A, Davydov E, Dimas A, Eyras E, Hallgrimsdottir IB, Huppert J, Zody MC, Abecasis GR, Estivill X, Bouffard GG, Guan X, Hansen NF, Idol JR, Maduro VV, Maskeri B, McDowell JC, Park M, Thomas PJ, Young AC, Blakesley RW, Muzny DM, Sodergren E, Wheeler DA, Worley KC, Jiang H, Weinstock GM, Gibbs RA, Graves T, Fulton R, Mardis ER, Wilson RK, Clamp M, Cuff J, Gnerre S, Jaffe DB, Chang JL, Lindblad-Toh K, Lander ES, Koriabine M, Nefedov M, Osoegawa K, Yoshinaga Y, Zhu B, de Jong PJ. Identification and analysis of functional elements in 1% of the human genome by the ENCODE pilot project. Nature. 2007;447:799–816. doi: 10.1038/nature05874. [DOI] [PMC free article] [PubMed] [Google Scholar]
- 29.Neduva V, Russell RB. Linear motifs: evolutionary interaction switches. FEBS Lett. 2005;579:3342–3345. doi: 10.1016/j.febslet.2005.04.005. [DOI] [PubMed] [Google Scholar]
- 30.Holt LJ, Tuch BB, Villen J, Johnson AD, Gygi SP, Morgan DO. Global analysis of Cdk1 substrate phosphorylation sites provides insights into evolution. Science. 2009;325:1682–1686. doi: 10.1126/science.1172867. [DOI] [PMC free article] [PubMed] [Google Scholar]
Associated Data
This section collects any data citations, data availability statements, or supplementary materials included in this article.


