Abstract
Objective
Severely burned patients benefit from intensive insulin therapy (IIT) for tight glycemic control (TGC). We evaluated the clinical impact of automatic correction of hematocrit and ascorbic acid interference for bedside glucose monitoring performance in critically ill burn patients.
Methods
The performance of two point-of-care glucose monitoring systems (GMS): (a) GMS1, an autocorrecting device, and (b) GMS2, a non-correcting device were compared. Sixty remnant arterial blood samples were collected in a prospective observational study to evaluate hematocrit and ascorbic acid effects on GMS1 vs. GMS2 accuracy paired against a plasma glucose reference. Next we enrolled 12 patients in a pilot randomized controlled trial (RCT). Patients were randomized 1:1 to receive IIT targeting a TGC interval of 111–151 mg/dL and guided by either GMS1 or GMS2. GMS bias, mean insulin rate, and glycemic variability were calculated.
Results
In the prospective study, GMS1 results were similar to plasma glucose results (mean bias: −0.75[4.0] mg/dL, n=60, P=0.214). GMS2 results significantly differed from paired plasma glucose results (mean bias: −5.66[18.7] mg/dL, n=60, P=0.048). Ascorbic acid therapy elicited significant GMS2 performance bias (29.2[27.2], P<0.001). RCT results reported lower mean bias (P<0.001), glycemic variability (P<0.05), mean insulin rate (P<0.001), and frequency of hypoglycemia (P<0.001) in the GMS1 group than the GMS2 group.
Conclusions
Anemia and high dose ascorbic acid therapy negatively impact GMS accuracy and TGC in burn patients. Automatic correction of confounding factors improves glycemic control. Further studies are warranted to determine outcomes associated with accurate glucose monitoring during IIT.
Keywords: Ascorbic acid, hematocrit, point-of-care testing
INTRODUCTION
Successful tight glycemic control (TGC) is vital to burn critical care. Intensive insulin therapy (IIT) for TGC significantly reduces mortality and morbidity in critically ill patients.1,2 Glycemic dysregulation is associated with impaired wound healing and mortality.1,3,4 Burn patients stand to benefit from TGC by minimizing glycemic excursions and improving outcomes.5,6
Point-of-care glucose monitoring systems (GMS) provide the primary means for guiding IIT and maintaining appropriate TGC. The underlying analytical principles behind GMSs are identical to electrochemistry-based hospital laboratory methods (Figure 1).7–10 However, sample types differ between GMS and laboratory glucose testing methods. Laboratory samples consist of plasma, while GMSs are constrained to arterial, venous, or capillary sample types. Plasma samples are considered the “gold standard” due to the lack of confounding factors such as hematocrit, oxidizing substances (e.g., ascorbic acid), and oxygen tension effects.8–10
Figure 1. Electrochemical Glucose Biosensor Layout.
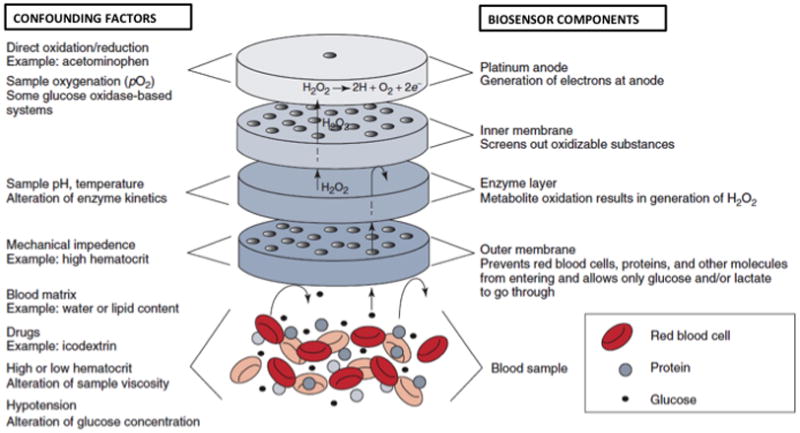
The figure illustrates a typical glucose oxidase-based electrochemical glucose biosensor. Biosensor components are identified on the right. Examples of confounding factors and the effect on each biosensor component are shown on the left.
Inaccurate glucose measurements during IIT precipitate dangerous glycemic excursions and poor outcomes as highlighted by the 2009 NICE-SUGAR study.11 Follow-up analyses reported the GMSs used for treatment were inappropriate for critical care and susceptible to known confounding factors.12,13 Abnormal hematocrit and oxidizing substances may contribute to these erroneous results. For example, high hematocrit falsely lowers GMS results, and low hematocrit falsely elevates results when compared to a plasma reference.9,14 Ascorbic acid, a well-known antioxidant and another confounding factor, falsely depresses measurements in comparison to laboratory results by electrochemically interfering with the glucose biosensor.8
Burn patients are at high-risk from glucose testing hematocrit interference. Hemoconcentration commonly occurs during the acute burn shock phase and is exacerbated by inflammation-mediated fluid redistribution and evaporative water loss. Moreover, burn patients routinely lose 2% of their blood volume for every percent body surface area surgically excised. Therefore, a patient with 20% total body surface area (TBSA) burns will lose 40% of their blood volume during surgical wound excision and grafting.
Burn patients may also be at risk for erroneous glucose readings due to ascorbic acid interference. High dose intravenously ascorbic acid therapy is believed to reduce fluid requirements by mitigating oxidative stress during burn shock.15,16 In this manner, both hematocrit and ascorbic acid interference lead to dangerous GMS errors during IIT in burn patients. We hypothesize that automatic correction for hematocrit and ascorbic acid interference optimizes IIT and improves TGC in patients with severe burns.
MATERIALS AND METHODS
We conducted a prospective observational study followed by a pilot randomized controlled trial comparing an auto-correcting modified glucose oxidase-based GMS (GMS1, StatStrip Glucose, Nova Biomedical, Waltham, MA) versus a non-correcting glucose dehydrogenase-based GMS (GMS2, AccuChek Advantage, Roche Diagnostics, Indianapolis, IN).7 GMS1 incorporates a novel 4-well gold biosensor that autocorrects for hematocrit, oxidizing substances, and oxygen tension effects.7,17 GMS2 is currently used for routine care at our institution. The hospital clinical chemistry laboratory analyzer (Synchron LX20, Beckman Coulter, Brea, CA) served as the plasma glucose reference method. All three systems measure glucose via electrochemical techniques (Figure 1). The local Institutional Review Board approved the study.
Prospective Observational Study
The goal of the prospective observational study was to quantify the effect of hematocrit and high dose ascorbic acid therapy on GMS measurements. Sixty unique remnant arterial blood gas samples were tested using GMS1, GMS2, and the laboratory analyzer. Hematocrit was determined in parallel using the hospital laboratory hematology instrument. Additionally, samples from two burn patients receiving high dose ascorbic acid therapy as part of routine care were tested on all 3 devices. Only laboratory analyzer results were used for patient care.
Randomized Controlled Trial
The goal of the pilot randomized controlled trial was to determine the clinical effect of auto-corrected GMS measurements during IIT. Twelve severely burned (≥20% TBSA) adult patients (age ≥18 years) were enrolled. Patients were randomized 1:1 to have IIT guided by either GMS1 or GMS2. The existing hospital IIT protocol targeting a TGC interval of 111 to 151 mg/dL was used for the study. GMS testing was performed every hour, while paired plasma glucose measurements were performed every 12 hours on the laboratory analyzer. All GMS and plasma glucose samples were derived from arterial blood collected from existing lines.
Data Collection
Age, burn size, presence of inhalation injury, gender, presence of diabetes, and disease severity as calculated by the multiple organ dysfunction score (MODS) were collected. Hourly GMS results, plasma glucose, hematocrit, and insulin infusion rates were recorded.
Glycemic Variability Measurement
M-value targeting an “ideal glucose value” of 131 mg/dL (i.e., median value for our TGC range), interquartile range (IQR), standard deviation (SD), coefficient of variation (CV), mean amplitude of glycemic excursions (MAGE), mean of daily differences (MODD), and the continuous overall net glycemic action (CONGAn) for hourly (n = 1 hour intervals) glucose measurements were used to calculate glycemic variability (Table 1).18–24 These seven methods represent proposed measures of glycemic variability as reported in current literature. We developed a MATLAB (Version R2012b, Mathworks, Natick, MA) computational engine to analyze the large glucose dataset and apply these seven methods for determining glycemic variability.
Table 1.
Measures of Glycemic Variability
| Method | Calculation | Description | Reference | |
|---|---|---|---|---|
| CV |
|
Standard deviation of glucose values divided by the mean of glucose values. | Rodbard et al.19 | |
| CONGAn | , dt = xt − xt–n hours | Standard deviation of differences between adjacent glucose values for n hour intervals apart. | McDonnell et al.20 | |
| IQR | x75th – x25th | Difference between the 75th and 25th percentiles from a distribution of glucose values. | Siegelaar et al.21 | |
| M-value |
|
Complex log transformation of deviations from an assigned “ideal glucose value” where Mx, if T ≥ 24, Mx − MW, if T < 24. | Schlichtkrull et al.22 | |
| MAGE |
|
Average of absolute values of differences between adjacent glucose peaks and nadirs for all differences that are greater than 1 standard deviation | Service et al.23 | |
| MODD |
|
Average of glucose differences across adjacent days. | Molnar et al.24 | |
| SD |
|
Average of the sum of squared deviations around mean glucose values. | Siegelaar et al.20 |
Abbreviations: Ad, amplitude greater than 1 SD between the dth peak and dth nadir; CV, coefficient of variation; CONGAn, continuous overall net glycemic action for n hour intervals; D, total number of amplitudes greater than 1 SD; IQR, interquartile range; MAGE, mean amplitude of glycemic excursions; MODD, mean of daily differences; SD, standard deviation; T, number of time points; x̄, mean blood glucose; x25th, 25th percentile of blood glucose values; x75th, 75th percentile of blood glucose values; x1, ideal blood glucose value (set at 131 mg/dL for the study); xt, blood glucose at time point t; xt–n hours, blood glucose n hours before time t; xmax, maximum blood glucose value; xmin, minimum blood glucose value.
Data Analysis
A modified Bland-Altman analysis was performed on the prospective observational study data comparing the bias (GMS – laboratory analyzer results) on the y-axis versus the sample hematocrit on the x-axis. Glucose data were stratified into three hematocrit ranges for anemia (<25%), normocythemia (25 to 45%), and polycythemia (>45%). R statistical package (www.r-project.org) was used for data analysis. One-way analysis of variance (ANOVA) compared GMS1, GMS2, versus the laboratory analyzer results from the bench study. Tukey’s HSD post-hoc analysis was performed to determine significant pair-wise comparisons. Time-series data (e.g., hourly glucose measurements) were analyzed using repeated measures ANOVA. The 2-sample t-test compared independent continuous variables. Discrete variables were analyzed by the Fisher’s Exact test. We defined hypoglycemic excursions as glucose values <70 mg/dL, severe hypoglycemic excursions as glucose <50 mg/dL, and hyperglycemic excursions as glucose values >151 mg/dL. The desired glycemic range was defined as our TGC interval of 111 to 151 mg/dL.
RESULTS
Prospective Observational Study
Figure 2 illustrates GMS1 and GMS2 biases versus sample hematocrit. Sample hematocrit ranged from 19 to 60% and glucose from 59 to 296 mg/dL. An inversely proportional relationship between GMS2 results and hematocrit was observed. In contrast, GMS1 was unaffected by hematocrit. GMS1 results were also similar to paired laboratory analyzer results (mean [SD] bias: −0.75 [4.0] mg/dL, n = 60, P = 0.214). GMS2 results were significantly higher than paired laboratory measurements (mean bias: −5.66 [18.7] mg/dL, n = 60, P = 0.048). Mean GMS2 bias for anemic samples was 9.6 [8.7] mg/dL. For normocythemic and polycythemic samples, mean GMS2 bias was −3.9 [9.2] and −21.8 [18.9] mg/dL respectively.
Figure 2. Hematocrit Effects on GMS1 and GMS2.
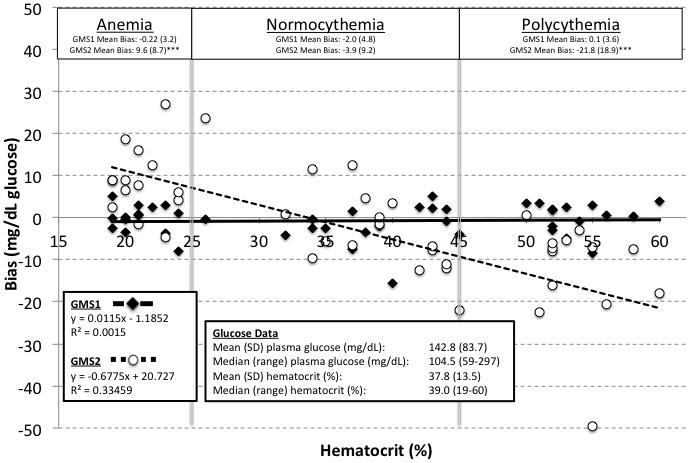
The figure shows data from the prospective observational study comparing GMS1 and GMS2 against paired plasma glucose values from the hospital laboratory. GMS bias for anemic, normocythemic, and polycythemic samples are identified. Bias is defined as the GMS minus the plasma glucose value.
Two additional patients received high dose ascorbic acid therapy (500 mg/mL in 1L Lactated Ringers) during the course of the prospective observational study. The ascorbic acid was infused over 24 hours following admission and titrated based on urine output. Figure 3 illustrates GMS1 and GMS2 results measured every 2 hours and compared to the laboratory analyzer. GMS2 results were significantly lower than laboratory results (mean bias: 29.2 [27.2], n = 15 paired measurements, P < 0.001). In comparison, results were similar between the laboratory analyzer and GMS1 (mean bias: 0.58 [4.3], n = 15 paired measurements, P = 0.564).
Figure 3. High Dose Ascorbic Acid Therapy Interference Case Examples.
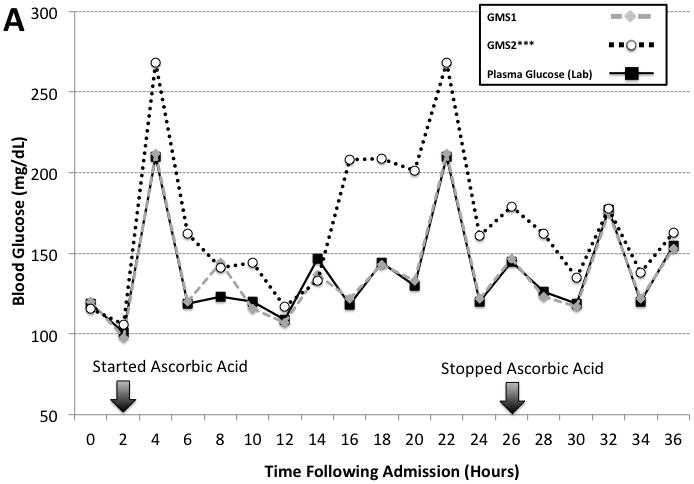
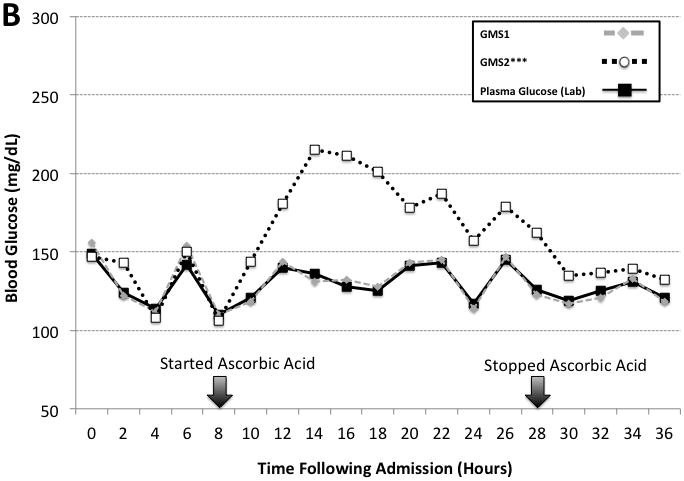
The figure shows two case examples of high dose ascorbic acid therapy interference on GMS1 vs. GMS2 when compared to paired hospital plasma glucose results. Panel A is a case involving a 21 year old woman with poly-trauma including 90% TBSA burns. Panel B is a case involving a 29 year old man with 90% TBSA burns. Arrows indicate the start and stop times for the high dose ascorbic acid therapy. Ascorbic acid dosing was 500 mg/kg in 1L of Lactated Ringers solution infused over a 24 hour period.
Interventional Study
Twelve patients were successfully recruited with 6 randomized to the GMS1 group and the remaining 6 randomized to the GMS2 group. Age, gender, burn size, and admission MODS were similar between the two study groups (Table 2). No cases of inhalation injury or high dose ascorbic acid therapy were reported. Diabetic status was similar between the two study groups. No study related adverse events were observed and all patients completed the study per protocol.
Table 2.
Comparisons Between GMS1 and GMS2 Study Groups
| GMS1 | GMS2 | P-value | |
|---|---|---|---|
| Patient Demographics | |||
| Mean (SD, np) Age (years) | 35.7 (6.2, 6) | 40 (15.1, 6) | NS |
| Mean (SD, np) TBSA burned (%) | 44.5 (6.5, 6) | 57.8 (12.4, 6) | NS |
| Mean (SD, np) MODS | 5.4 (4.3, 413) | 5.4 (12.4, 251) | NS |
| Mean (SD, nm) Hematocrit (%) | 26.1 (4.9, 263) | 25.3 (5.2, 424) | NS |
| Patients with Inhalation Injury | 0/6 | 0/6 | NS |
| Patients with diabetes | 1/6 | 1/6 | NS |
| Gender (M, F) | 4, 2 | 5, 1 | NS |
| Glucose Meter Performance | |||
| Mean (SD, nm) Glucose Bias (mg/dL) | −1.9 (9, 113) | 5.48 (11.1, 419) | <0.001 |
| Glycemic Excursions | |||
| # of Hypoglycemic Events | 2 | 14 | <0.001 |
| Mean Glycemic Variability | |||
| CONGA (SD, np) | 21.3 (6.4, 6) | 34.3 (11.4, 6) | 0.035 |
| CV (SD, np) | 0.17 (0.03, 6) | 0.19 (0.05, 6) | NS |
| IQR (SD, np) | 28.5 (7.0, 6) | 30.2 (7.1, 6) | NS |
| M-value (SD, np) | 0.004 (0.003, 6) | 0.005 (0.003, 6) | NS |
| MAGE (SD, np) | 28.9 (4.7, 6) | 44.4 (16.2, 6) | 0.049 |
| MODD (SD, np) | 13.2 (2.6, 6) | 22.4 (6.4, 6) | 0.009 |
| SD (SD, np) | 21.4 (3.5, 6) | 30.2 (7.1, 6) | NS |
| Mean (SD, nm) Insulin Rate (U/hour) | 2.66 (1.8, 2312) | 4.02 (3.68, 4641) | <0.001 |
Abbreviations: CONGA, continuous overall net glycemic action; CV, coefficient of variation; F, female; IQR, interquartile range; M, male; MAGE, mean amplitude of glycemic excursions; MODD, mean of daily differences; MODS, multiple organ dysfunction score; nm, number of measurements; np, number of patients; NS, not significant; SD, standard deviation; TBSA, total body surface area; and U, units.
Between study group comparisons are shown in Table 2. In brief, mean hematocrit was similar between the two study groups. Patients in the GMS2 group had significantly higher mean bias (P < 0.001), mean insulin rates (P < 0.001), and hypoglycemic excursions (P < 0.001), including 4 severe hypoglycemic events. Glycemic variability was significantly lower in the GMS1 group versus the GMS2 group as revealed by MAGE (P = 0.049), MODD (P = 0.009), and CONGA (P = 0.035) values.
Figure 4 highlights two example cases from the randomized control trial illustrating the impact of anemia on GMS1 and GMS2 when compared to paired plasma reference measurements performed every 12 over the initial 14 days in the intensive care unit. GMS2 exhibited significant mean bias (9.7 [6.4], n = 15 paired measurements, P < 0.001). By using the observed 9.6 mg/dL GMS2 bias obtained from our observational study data to correct GMS2 measurements; the apparent bias was reduced (0.11 [6.4], n = 15 paired measurements, P = 0.948). In contrast, GMS1 was not adversely affected by hematocrit.
Figure 4. Hematocrit Correction During Intensive Insulin Therapy.
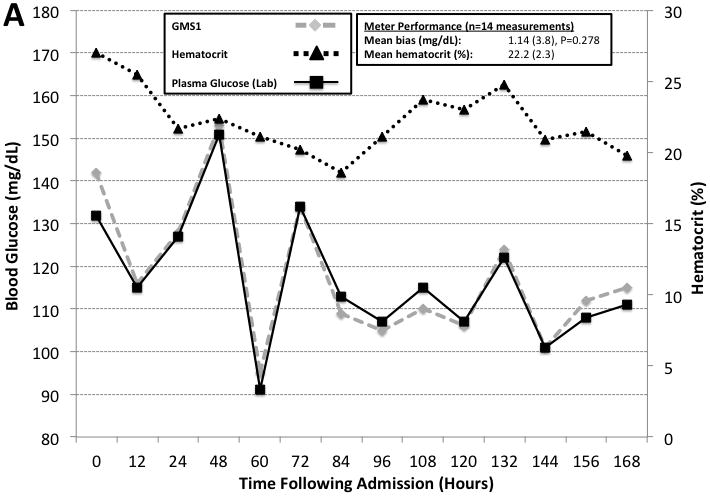
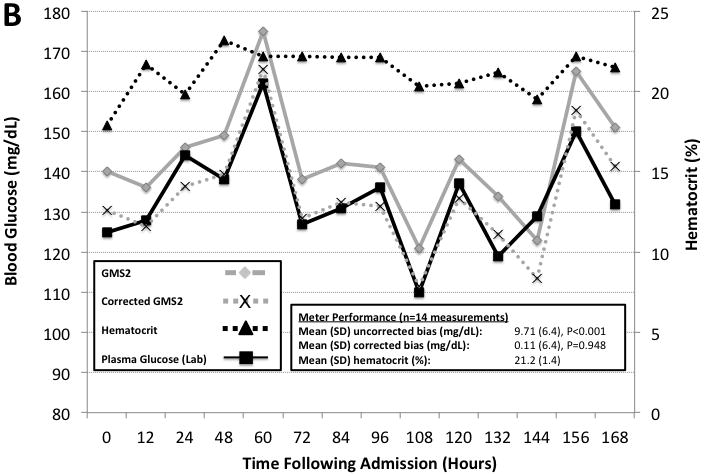
Two case examples illustrating hematocrit effects on GMS1 vs. GMS2 when compared to paired hospital plasma glucose measurements. Paired hematocrit measurements are also reported. All measurements were made every 12 hours. Panel A is a case involving a 37 year old man with 37% TBSA burns assigned to the GMS1 group. Panel B is a case involving a 38 year old woman with 45.5% TBSA burns assigned to the GMS2 group. GMS2 measurements exhibited significant bias. GMS2 bias was mitigated by applying the correction factor derived from the prospective observational study and representative of the patient’s mean hematocrit (−9.6 mg/dL for anemic samples).
DISCUSSION
Factors such as hypermetabolism, extensive wounds, and a high prevalence of sepsis make IIT and TGC instrumental to the survival of critically ill burn patients. However, these patients are frequently anemic from pathologic and iatrogenic mechanisms, and receive adjunctive therapies that cause erroneous glucose measurements, presenting additional challenges in maintaining TCG. Our study compared hourly glucose measurements performed using an auto-correcting GMS (GMS1) versus a traditional non-correcting GMS (GMS2) and reports the clinical effect of inaccurate glucose measurements in the burn patient population. We demonstrate the potential of hematocrit auto-correction to reduce glycemic variability, insulin rates, and hypoglycemia.
Our findings also support the recent United States Food and Drug Administration statement that current glucose meters should “not be used for patients who are dehydrated, hypotensive, in shock, critically ill, or in a hyperosmolar state.”25 These characteristics are all too common in the burn population. For example, in our study cohort, hematocrit <25% was common and representative of other surgical critical care populations.
We also characterize the clinical effect of high dose ascorbic acid therapy on POC glucose monitoring in burn patients. The antioxidant capacity of ascorbic acid had the inadvertent effect of significantly depressing GMS2 measurements. In contrast, GMS1 automatically corrected glucose measurements to yield accurate results. A consequence of ascorbic acid interference as reported by previous bench studies8, was that glucose measurement was limited to the laboratory at our institution and IIT discontinued for these patients, since TGC was infeasible with slower laboratory testing methods.
Seven measures of glycemic variability were evaluated in this study. Standard deviation is a common and convenient method for measuring glycemic variability.4 However, only MAGE, MODD, and CONGA were found to be significantly lower in the GMS1 group versus the GMS2 group. In contrast, other methods including SD were not significantly different between the two groups, suggesting that method- and/or population-specific considerations are necessary when measuring glycemic variability. For example, CV, IQR, and SD, all global determinants of variability, are unable to evaluate day-to-day or hour-to-hour burn patient glycemic variability.26 In contrast, MAGE, MODD, and CONGA are most sensitive to hourly and daily variations as suggested by their mathematical derivation and our study data. Therefore, MAGE, MODD, and CONGA measurements may be compatible with burn patient pathophysiology.
CONCLUSION
Anemia is common in surgical critical care and is exacerbated in the burn patient population. The study reports the implementation of an auto-correcting POC GMS robust to confounding factors enables proper IIT and improves glycemic control. Automatic GMS hematocrit correction reduced glycemic variability, insulin rates, and hypoglycemic events. Moreover, in patients receiving high dose ascorbic acid therapy, the auto-correcting GMS reported results comparable to “gold standard” plasma glucose values. In contrast, the non-correcting GMS generated erroneous results that could lead to excessive insulin dosing and increased risk for hypoglycemic events. We recommend caution when using non-correcting POC GMS’s in burn patients with anemia and/or receiving high dose ascorbic acid therapy. Larger clinical studies are warranted to verify the utility of various measures of glycemic variability and determine outcomes associated with highly accurate GMS testing in the burn patient population.
Acknowledgments
Funding Source: National Center for Advancing Translational Sciences, National Institutes of Health (K30 Mentored Clinical Research Training Program Scholarship), and a National Institutes for Biomedical Imaging and Bioengineering R25 grant.
The study was supported by a National Center for Advancing Translational Sciences (NCATS), National Institutes of Health (NIH), K30 Mentored Clinical Research Training Program (MCRTP) Scholarship, and the glycemic variability computational engine developed by the Department of Biomedical Engineering Senior Design Program. We thank Nova Biomedical for donating the glucose meters and strips for the study.
Footnotes
Conflicts of Interests: None
References
- 1.Van den Berghe G, Wouters P, Weekers F, et al. Intensive insulin therapy in critically ill patients. N Engl J Med. 2001;345:1359–1367. doi: 10.1056/NEJMoa011300. [DOI] [PubMed] [Google Scholar]
- 2.Gibson BR, Galiatsatos P, Rabiee A, et al. Intensive insulin therapy confers a similar survival benefit in the burn intensive care unit to the surgical intensive care unit. Surgery. 2009;146:922–930. doi: 10.1016/j.surg.2009.04.035. [DOI] [PubMed] [Google Scholar]
- 3.Meyfroidt G, Keenan DM, Wang X, et al. Dynamic characteristics of blood glucose time series course during the course of critical illness: effects of intensive insulin therapy and relative association with mortality. Crit Care Med. 2010;38:1021–1029. doi: 10.1097/CCM.0b013e3181cf710e. [DOI] [PubMed] [Google Scholar]
- 4.Krinsley JS. Glycemic variability: a strong independent predictor of mortality in critically ill patients. Crit Care Med. 2008;36:3008–3013. doi: 10.1097/CCM.0b013e31818b38d2. [DOI] [PubMed] [Google Scholar]
- 5.Ballian N, Rabiee A, Anderson DK, et al. Glucose metabolism in burn patients: the role of insulin and other endocrine hormones. Burns. 2010;36:599–605. doi: 10.1016/j.burns.2009.11.008. [DOI] [PubMed] [Google Scholar]
- 6.Pham TN, Warren AJ, Phan HH, et al. Impact of tight glycemic control in severely burned children. J Trauma. 2005;59:1148–1154. doi: 10.1097/01.ta.0000188933.16637.68. [DOI] [PubMed] [Google Scholar]
- 7.Tran NK, Promptmas C, Kost GJ. Biosensors, miniaturization, and noninvasive techniques. In: Cook KW, Lehmann C, Schoeff L, Williams R, editors. Clinical Diagnostic Technology: The Total Testing Process, Preanalytical, Analytical, and Post-Analytical Phases, Volume 3 of 3. Chapter 7. Washington DC: AACC; 2006. pp. 145–184. [Google Scholar]
- 8.Tang Z, Du X, Louie RF, Kost GJ. Effects of drugs on glucose measurements with handheld glucose meters and a portable glucose analyzer. Am J Clin Pathol. 2000;113:75–86. doi: 10.1309/QAW1-X5XW-BVRQ-5LKQ. [DOI] [PubMed] [Google Scholar]
- 9.Tang Z, Lee JH, Louie RF, et al. Effects of different hematocrit levels on glucose measurements with handheld meters for point-of-care testing. Arch Pathol Lab Med. 2000;124:1135–1140. doi: 10.5858/2000-124-1135-EODHLO. [DOI] [PubMed] [Google Scholar]
- 10.Tang Z, Louie RF, Lee JH, et al. Oxygen effects on glucose meter measurements with glucose dehydrogenase- and oxidase-based test strips for point-of-care testing. Crit Care Med. 2001;29:1062–1070. doi: 10.1097/00003246-200105000-00038. [DOI] [PubMed] [Google Scholar]
- 11.Finfur S, Chittock DR, Su SY, et al. Intensive versus conventional glucose control in critically ill patients. N Engl J Med. 2009;360:1283–1297. doi: 10.1056/NEJMoa0810625. [DOI] [PubMed] [Google Scholar]
- 12.Klonoff DC. Intensive insulin therapy in critically ill hospitalized patients: making it safe and effective. J Diabetes Sci Technol. 2011;5:755–767. doi: 10.1177/193229681100500330. [DOI] [PMC free article] [PubMed] [Google Scholar]
- 13.Kost GJ, Tran NK, Singh H. Mapping point-of-care performance using locally-smoothed median and maximum absolute difference curves. Clin Chem Lab Med. 2011;49:1637–1646. doi: 10.1515/CCLM.2011.655. [DOI] [PubMed] [Google Scholar]
- 14.Mann EA, Mora AG, Pidcoke HF, et al. Glycemic control in the burn intensive care unit: focus on the role of anemia in glucose measurement. J Diabetes Sci Technol. 2009;3:1319–1329. doi: 10.1177/193229680900300612. [DOI] [PMC free article] [PubMed] [Google Scholar]
- 15.Matsuda T, Tanaka H, Shimazaki, et al. High-dose vitamin C therapy for extensive deep dermal burns. Burns. 1992;18:127–131. doi: 10.1016/0305-4179(92)90009-j. [DOI] [PubMed] [Google Scholar]
- 16.Horton JW, White DJ, Maass DL, et al. Antioxidant vitamin therapy alters burn trauma-mediated cardiac NF-kappaB activation and cardiomyocyte cytokine secretion. J Trauma. 2001;50:397–406. doi: 10.1097/00005373-200103000-00002. [DOI] [PubMed] [Google Scholar]
- 17.Rao LV, Jakubiak F, Sidwell JS, et al. Accuracy evaluation of a new glucometer with automated hematocrit measurement and correction. Clin Chim Acta. 2005;365:178–183. doi: 10.1016/j.cccn.2005.01.027. [DOI] [PubMed] [Google Scholar]
- 18.Rausch JR. Measures of glycemic variability and links with psychological functioning. Curr Diab Rep. 2010;10:415–421. doi: 10.1007/s11892-010-0152-0. [DOI] [PubMed] [Google Scholar]
- 19.Robard D. New and improved methods to characterized glycemic variability using continuous glucose monitoring. Diabetes Technol Ther. 2009;11:551–565. doi: 10.1089/dia.2009.0015. [DOI] [PubMed] [Google Scholar]
- 20.McDonnell CM, Donath SM, Vidmar SI, et al. A novel approach to continuous glucose analysis utilizing glycemic variation. Diabetes Technol Ther. 2005;7:253–263. doi: 10.1089/dia.2005.7.253. [DOI] [PubMed] [Google Scholar]
- 21.Siegelaar SE, Holleman F, Hoekstra JB, et al. Glucose variability: does it matter? Endocr Rev. 2010;31:171–182. doi: 10.1210/er.2009-0021. [DOI] [PubMed] [Google Scholar]
- 22.Schlichtkrull J, Munch O, Jersild M. The M-value, an index of surgar control in diabetics. Acta Med Scand. 1965;177:95–102. doi: 10.1111/j.0954-6820.1965.tb01810.x. [DOI] [PubMed] [Google Scholar]
- 23.Service FJ, Molnar GD, Rosevear JW, et al. Mean amplitude of glycemic excursions, a measure of diabetic instability. Diabetes. 1970;19:644–655. doi: 10.2337/diab.19.9.644. [DOI] [PubMed] [Google Scholar]
- 24.Molnar GD, Taylor WF, Ho MM. Day-to-day variation of continuously monitored glycemia. Diabetologia. 1972;8:342–348. doi: 10.1007/BF01218495. [DOI] [PubMed] [Google Scholar]
- 25.FDA. [Accessed on January 3, 2013]; website: http://www.accessdata.fda.gov/cdrh_docs/reviews/K101299.pdf.
- 26.Farhy LS, Ortiz EA, Kovatchev BP, et al. Average daily risk range as a measure of glycemic risk is associated with mortality in the intensive care unit: a retrospective study in a burn intensive care unit. J Diabetes Sci Technol. 2011;5:1087–1098. doi: 10.1177/193229681100500509. [DOI] [PMC free article] [PubMed] [Google Scholar]


