Abstract
Many recent advances in DNA sequencing have taken advantage of single-molecule techniques using fluorescently-labeled oligonucleotides as the principle mode of detection. However, in spite of the successes of fluorescent-based sequencers, avoidance of labeled nucleotides could substantially reduce the costs of sequencing. This paper discusses the development of an alternative sequencing method in which unlabeled DNA can be manipulated directly on a massively-parallel scale using single-molecule force spectroscopy. We combine a wide-field optical detection technique (evanescent field excitation) with one of two methods of applying force in parallel, magnetic or dielectrophoretic (DEP) tweezers, to attain near single-base sensitivity in the double-stranded character of DNA. This article will discuss the developments of such a single-molecule force spectroscopy technique as a potential technology for genome sequencing.
Keywords: dielectrophoresis, DEP tweezers, DNA sequencing, highly parallel, label free, force spectroscopy
Introduction
The progress in DNA sequencing technology has been remarkable in the past decade, largely driven by the potential medical importance of the availability of low cost human genomes for use in personal genomics [1–3]. Low cost rapid sequencing requires miniaturization of the sequencing platforms, which, in turn, leads to orders of magnitude reductions in the amounts of reagents and time needed to run sequencing reactions. The ultimate sample size in any analysis is represented by a single molecule. It is natural, therefore, to see single molecule based techniques at the heart of many emerging sequencing technologies [4–12].
The two most widely used general approaches in analysis or detection of single molecules are the measurements of fluorescence and forces (i.e. force spectroscopy) [6–9]. In addition, sensing of DNA translocation through nanopores has received a lot of attention in the context of genome sequencing [13–16]. Yet only the fluorescence in various formats has been exploited so far for the purposes of the next generation sequencing technology [4, 6, 7, 17]. This disparity is due to the fact that fluorescence is a wide-field technique, whereas most advanced high resolution force spectroscopy techniques use a serial, one-molecule-at-a-time approach (for example, as in atomic force microscopy, where a molecule is manipulated by a nanoscopically-sharp probe controlled by a system of relatively complicated electronics and motion hardware that requires involved alignment and noise isolation) [18–23]. Highly localized detection volumes require long processing time of many experiments, which is not suitable for the manipulation of the millions of segments of DNA required to sequence the 3 billion base pair human genome.
Use of non-fluorescence approaches will eliminate specially designed, and often costly, DNA-processing enzymes and fluorescently labeled reagents in favor of common natural enzymes and substrates and should contribute to lowering the final cost of sequencing. We have proposed a sequencing strategy that uses force spectroscopy to detect the conformational changes of DNA in the course of a stepwise polymerization reaction (either via addition of a single base or ligation of a short oligomer). This approach queries the composition of the DNA strand by mechanically stretching individual molecules to determine the success or failure of the addition of a complement (as in sequencing by synthesis) through differentiation of the physical characteristics of double and single stranded DNA. To ensure that such analysis can be practiced on systems of many molecules, we are developing a highly-parallel single molecule force spectroscopy platform using magnetic [24, 25] or dielectrophoretic (DEP) tweezers [26, 27]. In this paper, we review the principles of proposed mechanical sequencing of DNA, report on initial experiments indicating its feasibility, and discuss challenges to demonstrating this technology.
Principle of Operation
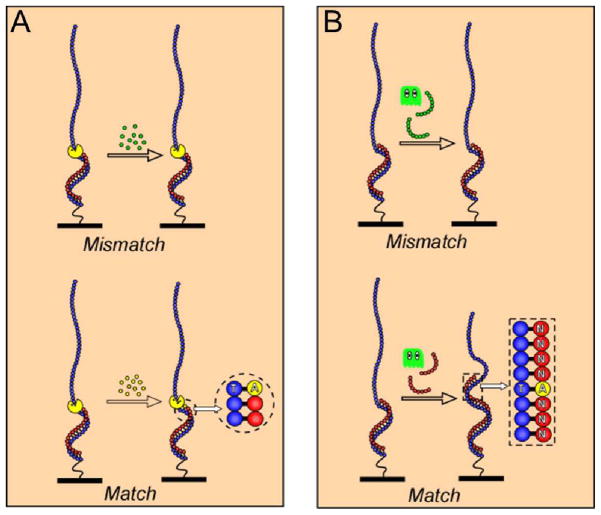
Mechanical approaches to sequencing exploit the physical differences in conformations of single and double stranded DNA [28, 29]. The molecular size (contour length) of the single stranded DNA (ssDNA) is dramatically different from the double stranded DNA (dsDNA): 0.58 nm versus 0.34 nm per base, e.g. replicating a 200 base long strand results in a change of the end-to-end distance of about 35–40 nm, if measured at high loading forces (>20 pN). Therefore, addition of complementary nucleotides by polymerase or complementary DNA oligomers by ligase could be detected by acquiring a force-extension curve and determining the number of bases in a double stranded form that would be required to describe the elastic properties of a given DNA molecule. Consequently, instead of observing a specific fluorescent label during successful incorporation of a complementary base, one can quantify the double-stranded character of a single DNA molecule and detect events of binding a single nucleotide (or oligomer) by repeatedly recording single molecule stretching curves (Figure 1).
Figure 1.
In a sequencing-by-synthesis scheme, a base in unknown sequence can be identified by adding a complementary base (A) or short oligomer (B) to a primer resulting in incremental change in the amount of the double stranded DNA by one (A) or 6–9 (B) bases. The sequence is built by controlling the composition of the buffer that contains only one (out possible four) matching substrate (e.g., only ATP in (A) or only NNNANNNN in (B), where N is every combination of DNA bases).
To achieve manipulation of many molecules, one can attach a microscopic force probe (superparamagnetic or dielectric bead) to each DNA strand and apply a force field, via either magnetic or electric field gradient [30, 31], to pull on these probes, thus generating force versus extension curves for multiple DNA molecules in parallel [27–34]. A uniform magnetic field gradient can be set up over relatively large areas (0.01–1 mm2). An electric field gradient can, in principle, even be set up on flat electrodes and, therefore, uniform DEP forces can be applied over even larger areas (cm2) [26]. A response from multiple force probes can be observed simultaneously using wide field microscopy. Given that the differences in the contour length of DNA on the order of 0.3 nm must be detected, the detection system should be highly sensitive (at sub-nanometer level) and differential (i.e. measuring the distance between two termini of the molecule rather than absolute positions of the two ends) to avoid problems of mechanical noise and drift. The system for force application and size measurement should ideally be self-referencing to remove concerns about calibration and repeatability.
We have combined evanescent wave excitation scheme with DEP tweezers (or magnetic tweezers) to build such a highly parallel force spectroscopy platform [24, 26]. The sequencing scheme (Figure 2) is based on detection of a decrease in the overall contour length of the target strand being sequenced. When the molecules are extended by the probe, the changes in the distance of the bead from the surface manifest themselves as changes in intensity of the fluorescent bead image (i.e. a lower intensity indicates a lower magnitude of the evanescent field and, therefore, a greater distance). The exponential distance dependence of the evanescent field, on the one hand, makes this technique extremely sensitive to small changes in conformations, on the other hand, it limits the method to relatively short molecules (<200 nm), setting the upper limit for the length of a DNA molecule of interest at several hundred bases (300–400).
Figure 2.
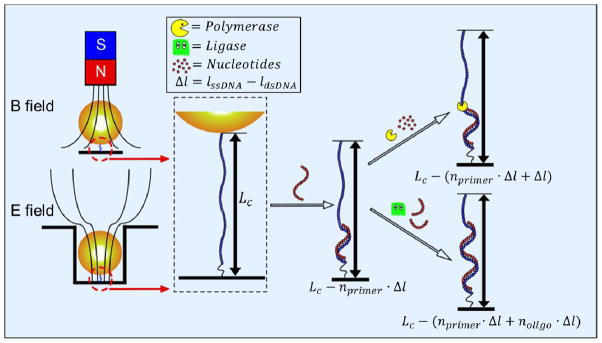
The forces on the DNA molecule can be generated using either magnetic (top) or DEP (bottom) tweezers. The DNA molecule is immobilized on the surface and bound to the surface of the bead. The contour length of the DNA can be measured at high applied forces. A primer is bound to the ssDNA, which is then polymerized in a stepwise manner. After elongation of the complementary strand, either by using polymerase (single nucleotide addition) or by using ligase (oligomer addition), in the target genomic DNA, the contour length (LC) of the partially hybridized DNA molecule decreases. ηprimer is the number of bases in the primer; ηprimer is the number of bases of the oligomer; Δl is the difference in length per base between ssDNA and dsDNA.
We chose evanescent wave excitation, because it does not require imaging the force probes with high lateral resolution and, in principle, can be implemented with low magnification objectives and with only a few pixels dedicated to each molecule-probe pair (since one needs integrated intensity, low lateral resolution is actually a benefit, because integration is then implemented in the hardware). The method is inherently differential by design (measures difference in position of the bead with respect to the solution-solid interface), thus, negating adverse drift effects for short acquisition times.
There are two main challenges in building a sequencing platform based on direct manipulation of single DNA molecules envisioned above: (i) fabrication of high-density arrays of DNA-force probe pairs to ensure parallelism; and (ii) demonstration of sensitivity of force spectroscopy using magnetic or DEP tweezers sufficient to discern the outcome of individual sequencing reactions (addition of a single base or ligation of a short 6 to 9 base long complement). The first challenge arises with the need to fragment genomic DNA into 300–400 base pair strands in order to sequence. Since genomic DNA is 3 billion base pairs long, sequencing would require the analysis of approximately 10 million DNA strands in parallel. A force spectroscopy platform designed for this purpose would require immense scalability. The second arises with the length change of only 0.24 nm/base pair with the addition of a single base. A system must be designed in which the lowest amount of bases could be ligated at once while staying within the limits of detection for the technique.
Materials and Methods
Probe synthesis
The polymer force probes used in this experiment were prepared by the emulsification of poly (methyl methacrylate-co-methacrylic acid) (35 kDa) with the methacrylic acid block constituting 1 % of the mass of the polymer along with a small percentage (< 1%) of fluorescent dye, oxazine-1. This process creates bulk probes of uniform size with smooth surfaces functionalized with methacrylic acid, which can be activated and subsequently reacted with DNA modified with amino groups.
Array preparation
The arrays were prepared by depositing a thin layer of Ti (4.5 nm) followed by a thick layer of Au (100 nm) on glass coverslips by physical vapor deposition. An array of 4 μm deep and 5 μm diameter round wells were fabricated on these substrates using standard photolithography techniques with SU-8 2005 (Microchem). The gold at the bottom of the wells was etched away using a standard gold etchant (4 g KI and 1 g I2 in 80 mL of water). Another layer of Ti (4.5 nm) followed by a thin layer of Au (11 nm) was then deposited on top of the SU-8 and the bottom of the wells for the electrode. A top electrode was fabricated by putting a thin layer of Ti and a thin layer of Au onto a second coverslip. The electrodes were assembled into a fluid cell with a 100 μm silicone gasket [26].
Probe attachment
DNA is connected to the surface of the substrate by methods described elsewhere [24, 27, 35]. A mixture of 3′ thiol modified DNA was combined in a 200:1 ratio with (11-Mercaptoundecyl)tetra(ethylene glycol) (MutEG) in pH 7.4 phosphate buffer with 1 M NaCl. This solution was allowed to incubate on the surface for 2 hours followed by a washing and an incubation in 1 mM MutEG for 1 hour. The carboxyl terminated probes were washed and promptly reacted with the 5′ amine modified end of the immobilized DNA using sulfo-NHS/EDC chemistry.
Force spectroscopy
Either magnetic of DEP tweezers force spectroscopy was conducted. To apply a force using magnetic tweezers an electromagnet was placed less than 0.5 mm above the sample surface and a current of up to 2 A was applied. For DEP tweezers, an AC electric field was applied to the two electrodes (at a frequency of 1 kHz) to exert a force that was modulated by ramping the amplitude of the AC voltage from 0 to 10 V. Probes were illuminated by an evanescent field using objective-style total-internal reflection fluorescence (TIRF). The out-of-plane positions of the probes were elucidated by measuring the integrated fluorescence intensities using an EMCCD camera (Andor iXon DU-888, Andor Technologies) [24, 26].
Results and Discussion
Assembly of force spectroscopy arrays
We investigated routes to construction of a force spectroscopy tool that would result in a high yield of active probes, i.e. beads bound to a single DNA molecule, rather than displaying multiple tethers or bound non-specifically to the surface where DNA is immobilized with one end (Figure 2). Although biomolecular conjugation (e.g. using biotin-avidin) is the most popular approach with magnetic (or optical) tweezers [36–39], we chose to use covalent chemistry to attain robust attachment that can withstand multiple buffer exchanges, allow the system remain stable for days, and resist disintegration under high pulling forces which we use in our DEP tweezers experiments. We developed DNA library preparation procedure that results in orthogonal binding chemistry at 3′ and 5′ ends of the ssDNA, for example, via end-modification with thiol and amino groups [36]. We then used gold-thiol chemistry [40] for attachment of the DNA to the surface of the solid support, while carboxyl-functionalized probes were attached to the amine groups of the opposite end of ssDNA molecules. To control the spacing between the DNA molecules and to reduce non-specific adhesion of the force probes, we optimized conditions of competitive binding of the thiol-terminated DNA and an inert thiol, forming a blocking layer. To ensure that only one molecule is interrogated by a single force probe, the surface density of the target molecules should have nearest neighbor distances similar to the force probe diameters (1–3 μm). The spacing can be controlled in a rational manner by adjusting the relative amount of the DNA and spacer thiol in solution.
In our experiments, we observed that the choice of the spacer molecule and the ratio of the concentrations of the DNA to this inert thiol are critical to providing desired density. Thiol with polyethyleneglycol (PEG) functionality proved substantially more effective in reducing the DNA density and aggregation on the surface than carboxylic acid or hydroxyl terminated thiols. Figure 3 shows spatial distribution of single DNA molecules on gold coated glass substrates after immobilization under conditions of competitive binding.
Figure 3.
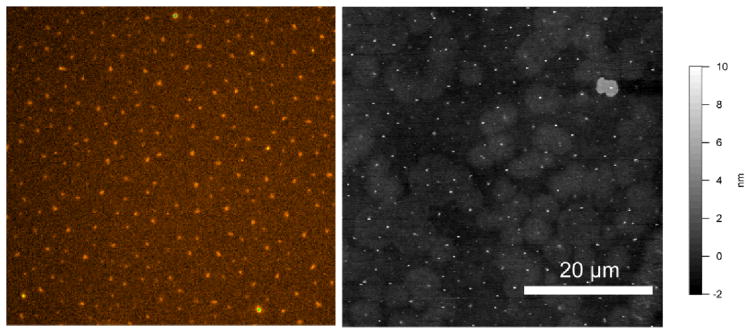
Distribution of the single ssDNA oligomers(150 bases) immobilized on Au surfaces is visualized using fluorescent (A) and tapping mode AFM (B) imaging after hybridization with a Cy5-labeled primer (21 bases, complementary to the end opposite to immobilization site). The density of ssDNA is comparable in both images.
One can then follow up with binding of the force probes to this well-spaced single molecule array. The attachment of the force probe must fulfill conflicting requirements: the probe must approach the target biomolecule for covalent attachment, but at the same time avoid binding to the substrate in a non-specific and irreversible manner. Therefore, probe-surface interactions should be repulsive at very short distances (< 5 nm), but attractive at long distances. We have determined that the optimal conditions for specific binding occur in solutions of ionic strength in the range of 10–100 mM, and when the surface potentials of the surface carrying the DNA molecules and the force probe both approach −35 mV. To prevent adhesion of probes after they contact the surface, the presence of a non-ionic surfactant at low concentration (0.01–0.1 %) is also critical. We demonstrated that under these conditions most (~80%) of the surface-bound probes are bound to the DNA molecules [27].
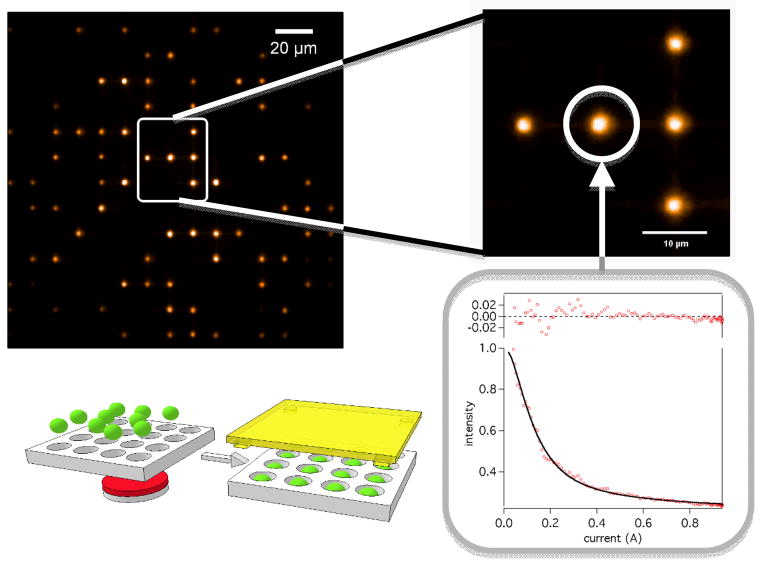
Use of the flat support surfaces leads to random arrays. For microscopic beads, a straightforward way to achieve high density of probes with predefined spacing is to use an array of microwells to arrange the beads in the regular pattern and then link them to DNA attached at the bottom surface of the wells. Figure 4 illustrates the implementation of this format for ordered bead-molecule arrays. DEP tweezers require use of microwells to increase the magnitude and range of forces that can be applied to the probes.
Figure 4.
Proposed scheme for a force spectroscopy array comprises an array of wells accommodating a single magnetic bead per well, with each bead in turn attached to a single oligomer. Application of a permanent magnet readily forces magnetic beads inside the wells. Gravity and DEP force of the proper sense (negative DEP) are also effective in assembly of the beads into the microwells. Plots of intensity (decreasing with distance) vs. current for magnetic tweezers or voltage squared for DEP tweezers (proportional to force) are generated for individual beads and fitted (Equation 1) to determine the outcome of the base or DNA oligomer addition. Uneven brightness of the beads in large area images reflects Gaussian intensity distribution in the laser beam illuminating the sample. Variations in the intensity of the neighboring beads reflect differences in their size and exact positioning inside the well.
Generation of force-extension curves
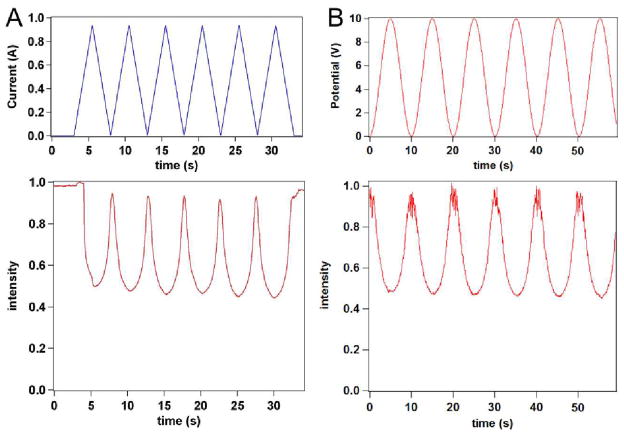
In a typical experiment, as the electromagnet current (magnetic tweezers) or AC voltage (DEP tweezers) is ramped, the force applied to the bead increases and stretches the DNA molecule. The instrument synchronously captures applied current (voltage) and a digital movie of the bead attached to a DNA anchored at the surface of the fluid cell. Each single molecule stretching curve is plotted as a normalized bead intensity (with respect to the maximum intensity) versus applied current (voltage) in order to perform side-by-side comparison of different evanescent field penetration depths, different beads or molecules, etc. The intensity versus current curve is the raw data that can be interpreted as an extension-versus-applied-force curve, if proper calibration parameters are available. A comparison of the force-extension loops conducted at different rates indicated that retraction curves align without a dependence on rate [24] and could be captured as fast as fast 1–10 sec per curve (Figure 5).
Figure 5.
The forces on the DNA molecule can be generated using either magnetic (A) or DEP (B) tweezers. The 200-base long ssDNA molecule is immobilized on the surface and bound to the surface of the bead. When the magnetic or DEP force is applied (via coil current or AC voltage amplitude changes – top panels), the brightness of the probe fluorescence in the evanescent field drops by approximately 50%, consistent with the probe being pulled away from the surface and the DNA molecule being stretched.
We observed that the two methods – DEP tweezers and magnetic tweezers – were effectively equivalent when we applied both methods of acquiring force-extension curves to the same molecule-bead construct in the same microwell. Resulting intensity-voltage and intensity-current curves (Figure 6) show the same dynamic range indicating that very similar extension of the molecule was reached in both cases. When analyzing the force extension curves, the method at which they were collected must be noted since the force is proportional to voltage squared for DEP tweezers and current for magnetic tweezers. We note that DEP tweezers, when to compared magnetic tweezers, have the advantage of incorporation of the critical alignment into the sample fabrication step. Lithographic procedures define electrode characteristics, which therefore should be uniform across centimeter-wide areas and independent of positioning of external elements (such as magnets).
Figure 6.
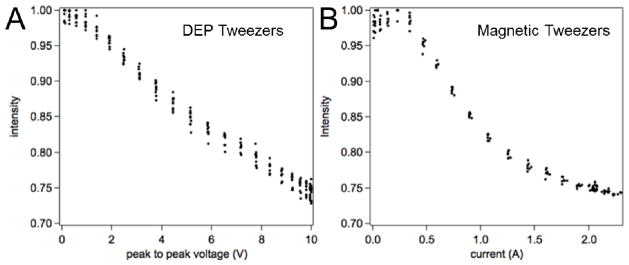
Direct comparison of the DNA stretching curves obtained with DEP tweezers (A) and magnetic tweezers (B) using the same superparamagnetic bead-ssDNA pair. Both experiments used a bead positioned inside a microwell and illuminated by the evanescent wave. Since the decrease in the probe intensity for both DEP and magnetic tweezers is the same, the range of forces achieved in the two molecular tweezers arrangements should also be the same.
Detection of ligation events using force curves
Raw data obtained with our instrument provides force curve data in the form of intensity of the image of the fluorescent bead versus current applied to the electromagnet. An equation to fit molecular (fraction of the dsDNA and contour length of the molecule) and instrumental parameters to these data can be constructed from (i) the dependence of bead image intensity on distance from the interface for an evanescent field (exponential), (ii) the relationship between applied current/voltage and force (force sensitivity), and (iii) the model for single molecule stretching of ssDNA (i.e. a freely-jointed chain with segment elasticity). By fitting experimental raw data to this relationship (see the fit in Figure 4), one can obtain the calibration parameters of the system— bead force sensitivity to applied current/voltage and penetration depth of the evanescent field (for the known number of bases). The error in fitted penetration depth was usually on the order of 0.3 nm, implying that the single-to-noise ratio in our setup limits the detection to 1–2 bases. Comparisons of penetration depth values from such fits to those measured independently using AFM agreed within a few nanometers [24].
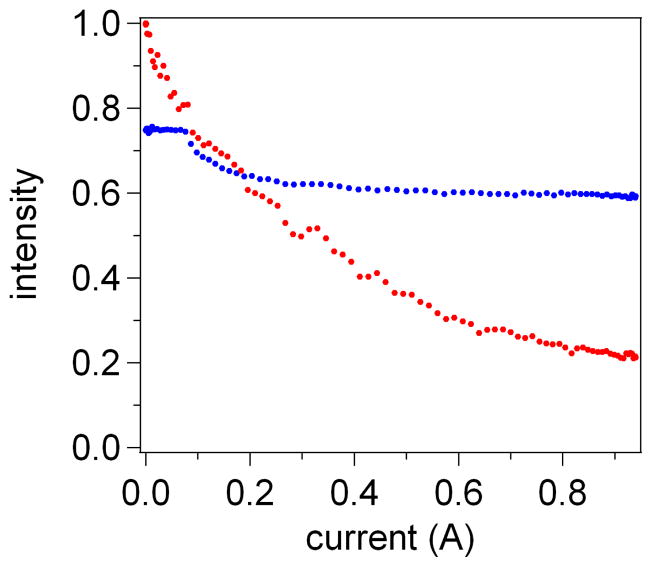
By incubating 200-mer ssDNA in the presence of polymerase and all four dNTPs (Figure 7), we found that the method clearly has a large dynamic range. The difference in response between the two extremes – fully single stranded and fully double stranded DNA – reached about 40% of the total intensity. To evaluate the sensitivity of our magnetic tweezers setup, we carried out hybridization experiments on a 200-mer ssDNA using a complementary 50-mer oligomer [24]. The overall contour length of the partially hybridized DNA (LC) can be represented by contributions from the length of ssDNA (Lss) and dsDNA (Lds) components comprising the mixed oligomer having χds fraction of the double-stranded form:
| (1) |
Figure 7.
Intensity (extension) vs. current (force) curves of 200 base long fully single stranded DNA (•••) and 200 base pairs fully double stranded DNA (•••), obtained from the same DNA molecule before and after incubation in a buffer containing polymerase and a mix of four deoxyribonucleoside triphosphates (dNTPs).
The ssDNA is treated as a freely-jointed chain with segment elasticity, while dsDNA is modeled as an elastic rod, since the persistence length of dsDNA is on the order of 50 nm. Setting the fraction of dsDNA, χds, as a fit parameter in a model that describes intensity-current curves, we found that the fraction of double stranded DNA in this case was 0.252 ± 0.006 corresponding to 50.4 ± 1.2 bases in the 200-mer strand. This result is a difference of only 0.4 ± 1.2 bases from the theoretical fraction of 0.250 for a double stranded character of DNA in this experiment. Thus, the length of the double stranded fragment can be recovered with close to a single base resolution [24]. Therefore, detection of hybridization or ligation by a short fragment (6–9 bases) is already possible with our magnetic tweezers setup and should be unambiguous. The experimental setup based on magnetic tweezers combined with evanescent wave excitation already meets the sensitivity requirements of sequencing by ligation.
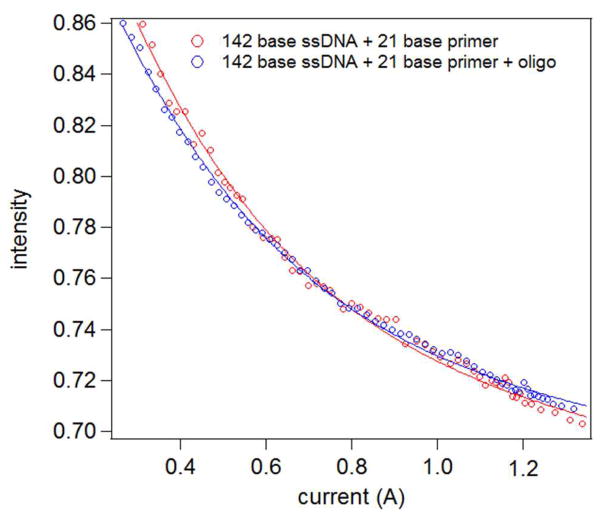
We have demonstrated the first two steps of the sequencing-by-ligation cycle: binding of a 21-base primer as well as the ligation of an octamer, both complementary to a 142-base ssDNA template of known sequence. Figure 8 shows intensity versus current plot of a probe in a microwell before and after ligation of an octamer DNA strand to the target strand. For this particular sample, the force curves were not taken before primer addition. When fitting the intensity-current curve obtained after hybridization of the primer, we fixed χds (Equation 1) at 0.148 (21/142). After finding the penetration depth and force sensitivity factor, we performed another fit on the force curve after ligation. For the second fit, the double-stranded character was left as a fitting parameter. The result was a double-stranded character χds = 0.234 ± 0.008, which is a difference of 12.3 ± 1.2 bases. Therefore, the differences before and after ligation of an 8-base long strand are readily detectable. One can then sensibly consider conventional cycling though buffers with different probe oligomers to uncover the sequence.
Figure 8.
Experimental intensity-current curves obtained for an active bead in the microwell array, before and after ligation of an octamer to 21-base primer bound to a 142-base long ssDNA. Four individual traces are averaged in each case. The lines indicate fits to Equation 1 with variable double stranded DNA content.
Conclusions
We demonstrated that single molecule force spectroscopy on oligonucleotides with mixed single stranded and double stranded composition is capable of defining its content to within one base. Such single-to-noise ratio is insufficient for single nucleotide addition sequencing, as in the case of fluorescent-based approaches, but is suitable for detection of short oligomer designed to enable single base specificity (i.e. containing one base mismatch). While individual force-extension curves can be acquired within seconds in our setup, the ligation reactions in commercial bead-based sequencing by ligation systems are typically very long (~1 h). Long times are justified by the need to achieve complete conversion of all DNA on a given bead to avoid the problem of de-phasing, thus limiting such systems to short reads. Single molecule approaches do not suffer from de-phasing problems and unsuccessful reaction will be completed in the next cycle with the same buffer [41, 42], therefore, the potential to achieve long 300–400 base reads exists. In our experiments in solution, we observed completion of ligation reactions within 1 min at 1 μM oligomers concentrations (even in low ionic strength buffers of 5 mM Tris and 2 mM MgCl2).
Current challenges
Although both magnetic and DEP tweezers have great potential for massive parallelization, the construction of practical force spectroscopy arrays poses a major challenge and is the subject of intense recent interest [20, 21, 43–45]. We believe that the problem is due to an orders of magnitude mismatch in the size scale between oligomers (~10 nm in a coiled state) and force probes (~1 μm). While either single molecules or force probes can be arranged individually with proper spacing or organization, we found in our experiments that the required alignment of the two to form the molecule-probe pair is a low yield process. One route to an improved array would be to reduce the probe size. This approach is unlikely to be suitable for magnetic tweezers, since the magnet is external to the fluid cell imposing upper limits on the field magnitude that can be achieved. Since forces scale with volume of the probe, micrometer sized beads are required to attained high force of ~ 20–100 pN. On the other hand, DEP tweezers could potentially use nanometer sized probes (~100 nm), since electrodes are incorporated into the sample surface, thus ensuring close proximity and ability to maintain high fields. Alternatively, our choice of covalent chemistry could be too restrictive, whereas the life-time of biomolecular attachment may prove to be sufficient for the purposes of implementing proposed sequencing scheme.
Future directions
We envision a move away from the objective-style TIRF detection scheme as the next logical step in further parallelizing our platform. Since objective-style TIRF limits the area of analysis to the small field-of-view of a high powered (60×−100×), high numerical aperture (NA) objective, we have begun testing a setup using a planar wave guide excitation combined with detection using a low magnification, low NA, objective (Figure 9). We were able to drastically increase the number of probes analyzed at any one time by using a forward scattering setup constructed using evanescently-guided light passed through the edge of a glass coverslip patterned with our array (Figure 9). For observation of probes, the low magnification objective (10×) was placed above the sample area. As a consequence of drastically increasing the area of analysis (from 4 · 104 μm2 to 2 · 106 μm2), it becomes far too difficult to maintain a laterally uniform magnetic field gradient, making the large electrodes fabricated for DEP the practical choice for the application of force. Lastly, using this technique we are no longer restricted to fluorescent detection of probes, eliminating the need for fluorescent dyes, which have the propensity to photobleach. Since we are now using a low magnification objective we can use the light scattered by the microspheres as a measure of distance. Like fluorescence, the intensity of forward scattered light is dependent of the probes position in the evanescent field making it a suitable choice for detection [25]. Therefore, we can integrate the highly parallel force spectroscopy method with a large sample area characterization method to achieve a highly parallel DNA sequencing platform.
Figure 9.
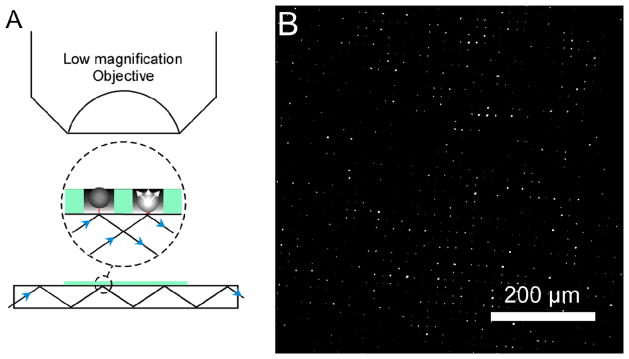
(A) The incident light undergoes total internal reflection at glass-water interface in a planar-waveguide implementation of a force spectroscopy array. Forward scattering of the evanescent field by dielectric microspheres maps their distance from the surface of the waveguide. (B) We used 10× objective to capture the intensity of light scattered by beads.
Acknowledgments
We acknowledge funding of this work by NIH grant HG004141.
References
- 1.Schloss JA. Nat Biotech. 2008;26:1113–1115. doi: 10.1038/nbt1008-1113. [DOI] [PubMed] [Google Scholar]
- 2.Mukhopadhyay R. Anal Chem. 2009;81:1736–1740. doi: 10.1021/ac802712u. [DOI] [PubMed] [Google Scholar]
- 3.Shendure J, Ji H. Nat Biotech. 2008;26:1135–1145. doi: 10.1038/nbt1486. [DOI] [PubMed] [Google Scholar]
- 4.Braslavsky I, Hebert B, Kartalov E, Quake SR. Proc Natl Acad Sci USA. 2003;100:3960–3964. doi: 10.1073/pnas.0230489100. [DOI] [PMC free article] [PubMed] [Google Scholar]
- 5.Cockroft SL, Chu J, Amorin M, Ghadiri MR. J Am Chem Soc. 2008;130:818–820. doi: 10.1021/ja077082c. [DOI] [PMC free article] [PubMed] [Google Scholar]
- 6.Harris TD, Buzby PR, Babcock H, Beer E, Bowers J, Braslavsky I, Causey M, Colonell J, DiMeo J, Efcavitch JW, Giladi E, Gill J, Healy J, Jarosz M, Lapen D, Moulton K, Quake SR, Steinmann K, Thayer E, Tyurina A, Ward R, Weiss H, Xie Z. Science. 2008;320:106–109. doi: 10.1126/science.1150427. [DOI] [PubMed] [Google Scholar]
- 7.Eid J, Fehr A, Gray J, Luong K, Lyle J, Otto G, Peluso P, Rank D, Baybayan P, Bettman B, Bibillo A, Bjornson K, Chaudhuri B, Christians F, Cicero R, Clark S, Dalal R, Dewinter A, Dixon J, Foquet M, Gaertner A, Hardenbol P, Heiner C, Hester K, Holden D, Kearns G, Kong X, Kuse R, Lacroix Y, Lin S, Lundquist P, Ma C, Marks P, Maxham M, Murphy D, Park I, Pham T, Phillips M, Roy J, Sebra R, Shen G, Sorenson J, Tomaney A, Travers K, Trulson M, Vieceli J, Wegener J, Wu D, Yang A, Zaccarin D, Zhao P, Zhong F, Korlach J, Turner S. Science. 2009;323:133–138. doi: 10.1126/science.1162986. [DOI] [PubMed] [Google Scholar]
- 8.Metzker ML. Nat Rev Genet. 2009;11:31–46. doi: 10.1038/nrg2626. [DOI] [PubMed] [Google Scholar]
- 9.Ding F, Manosas M, Spiering MM, Benkovic SJ, Bensimon D, Allemand JF, Croquette V. Nat Meth. 2012;9:367–372. doi: 10.1038/nmeth.1925. [DOI] [PMC free article] [PubMed] [Google Scholar]
- 10.Ramanathan A, Huff EJ, Lamers CC, Potamousis KD, Forrest DK, Schwartz DC. Anal Biochem. 2004;330:227–241. doi: 10.1016/j.ab.2004.03.029. [DOI] [PubMed] [Google Scholar]
- 11.Fan JB, Chee MS, Gunderson KL. Nat Rev Genet. 2006;7:632–644. doi: 10.1038/nrg1901. [DOI] [PubMed] [Google Scholar]
- 12.Branton D, Deamer D, Marziali A, Bayley H, Benner S, Butler T, Di Ventra M, Garaj S, Hibbs A, Huang X, Jovanovich S, Krstic P, Lindsay S, Ling X, Mastrangelo C, Meller A, Oliver J, Pershin Y, Ramsey J, Riehn R, Soni G, Tabard-Cossa V, Wanunu M, Wiggin M, Schloss J. Nat Biotechnol. 2008;26:1146–1153. doi: 10.1038/nbt.1495. [DOI] [PMC free article] [PubMed] [Google Scholar]
- 13.Kowalczyk SW, Tuijtel MW, Donkers SP, Dekker C. Nano Lett. 2010;10:1414–1420. doi: 10.1021/nl100271c. [DOI] [PubMed] [Google Scholar]
- 14.Meller A, Branton D. Electrophoresis. 2002;23:2583–2591. doi: 10.1002/1522-2683(200208)23:16<2583::AID-ELPS2583>3.0.CO;2-H. [DOI] [PubMed] [Google Scholar]
- 15.Benner S, Chen RJA, Wilson NA, Abu-Shumays R, Hurt N, Lieberman KR, Deamer DW, Dunbar WB, Akeson M. Nat Nano. 2007;2:718–724. doi: 10.1038/nnano.2007.344. [DOI] [PMC free article] [PubMed] [Google Scholar]
- 16.McNally B, Singer A, Yu Z, Sun Y, Weng Z, Meller A. Nano Lett. 2010;10:2237–2244. doi: 10.1021/nl1012147. [DOI] [PMC free article] [PubMed] [Google Scholar]
- 17.Shendure J, Porreca G, Reppas N, Lin X, McCutcheon J, Rosenbaum A, Wang M, Zhang K, Mitra R, Church G. Science. 2005;309:1728–1732. doi: 10.1126/science.1117389. [DOI] [PubMed] [Google Scholar]
- 18.Neuman KC, Nagy A. Nat Meth. 2008;5:491–505. doi: 10.1038/nmeth.1218. [DOI] [PMC free article] [PubMed] [Google Scholar]
- 19.Liang J, Fernandez JM. ACS Nano. 2009;3:1628–1645. doi: 10.1021/nn900294n. [DOI] [PMC free article] [PubMed] [Google Scholar]
- 20.Kruithof M, Chien F, De Jager M, Van Noort J. Biophys J. 2008;94:2343–2348. doi: 10.1529/biophysj.107.121673. [DOI] [PMC free article] [PubMed] [Google Scholar]
- 21.Gosse C, Croquette V. Biophys J. 2002;82:3314–3329. doi: 10.1016/S0006-3495(02)75672-5. [DOI] [PMC free article] [PubMed] [Google Scholar]
- 22.Noy A, Vezenov D, Lieber C. Chemical Force Microscopy Nanoscale Probing of Fundamental Chemical Interactions. In: Noy A, editor. Handbook of Molecular Force Spectroscopy. Springer; New York: 2008. pp. 97–122. [Google Scholar]
- 23.Conroy R. Force Spectroscopy with Optical and Magnetic Tweezers. In: Noy A, editor. Handbook of Molecular Force Spectroscopy. Springer; New York: 2008. pp. 23–96. [Google Scholar]
- 24.Oliver PM, Park JS, Vezenov D. Nanoscale. 2011;3:581–591. doi: 10.1039/c0nr00479k. [DOI] [PMC free article] [PubMed] [Google Scholar]
- 25.Bijamov A, Shubitidze F, Oliver PM, Vezenov DV. Langmuir. 2010;26:12003–12011. doi: 10.1021/la1015252. [DOI] [PMC free article] [PubMed] [Google Scholar]
- 26.Cheng P, Barrett MJ, Oliver PM, Cetin D, Vezenov D. Lab on a Chip. 2011:11. doi: 10.1039/c1lc20627c. [DOI] [PMC free article] [PubMed] [Google Scholar]
- 27.Barrett MJ, Oliver PM, Cheng P, Cetin D, Vezenov D. Anal Chem. 2012;84:4907–4914. doi: 10.1021/ac3001622. [DOI] [PMC free article] [PubMed] [Google Scholar]
- 28.Smith SB, Cui Y, Bustamante C. Science. 1996;271:795–799. doi: 10.1126/science.271.5250.795. [DOI] [PubMed] [Google Scholar]
- 29.Bustamante C, Bryant Z, Smith SB. Nature. 2003;421:423–427. doi: 10.1038/nature01405. [DOI] [PubMed] [Google Scholar]
- 30.Regtmeier J, Eichhorn R, Viefhues M, Bogunovic L, Anselmetti D. Electrophoresis. 2011;32:2253–2273. doi: 10.1002/elps.201100055. [DOI] [PubMed] [Google Scholar]
- 31.Lapizco-Encinas BH, Rito-Palomares M. Electrophoresis. 2007;28:4521–4538. doi: 10.1002/elps.200700303. [DOI] [PubMed] [Google Scholar]
- 32.Nelson PC, Zurla C, Brogioli D, Beausang JF, Finzi L, Dunlap D. J Phys Chem B. 2006;110:17260–17267. doi: 10.1021/jp0630673. [DOI] [PubMed] [Google Scholar]
- 33.Ribeck N, Saleh OA. Rev Sci Instrum. 2008;79:094301–094306. doi: 10.1063/1.2981687. [DOI] [PubMed] [Google Scholar]
- 34.Plénat T, Tardin C, Rousseau P, Salomé L. Nucleic Acids Res. 2012;40:e89. doi: 10.1093/nar/gks250. [DOI] [PMC free article] [PubMed] [Google Scholar]
- 35.Lim HI, Oliver PM, Marzillier J, Vezenov DV. Anal Bioanal Chem. 2010;397:1861–1872. doi: 10.1007/s00216-010-3733-5. [DOI] [PMC free article] [PubMed] [Google Scholar]
- 36.Schlingman DJ, Mack AH, Mochrie SGJ, Regan L. Colloids Surf B Biointerfaces. 2011;83:91–95. doi: 10.1016/j.colsurfb.2010.11.002. [DOI] [PMC free article] [PubMed] [Google Scholar]
- 37.Wilchek M, Bayer EA. Anal Biochem. 1988;171:1–32. doi: 10.1016/0003-2697(88)90120-0. [DOI] [PubMed] [Google Scholar]
- 38.Shumaker-Parry JS, Zareie MH, Aebersold R, Campbell CT. Anal Chem. 2004;76:918–929. doi: 10.1021/ac034964v. [DOI] [PubMed] [Google Scholar]
- 39.Kessler C. Mol Cell Probes. 1991;5:161–205. doi: 10.1016/0890-8508(91)90041-h. [DOI] [PubMed] [Google Scholar]
- 40.Petrovykh DY, Kimura-Suda H, Whitman LJ, Tarlov MJ. J Am Chem Soc. 2003;125:5219–5226. doi: 10.1021/ja029450c. [DOI] [PubMed] [Google Scholar]
- 41.Whiteford N, Skelly T, Curtis C, Ritchie ME, Löhr A, Zaranek AW, Abnizova I, Brown C. Bioinformatics. 2009;25:2194–2199. doi: 10.1093/bioinformatics/btp383. [DOI] [PMC free article] [PubMed] [Google Scholar]
- 42.Schadt EE, Turner S, Kasarskis A. Hum Mol Genet. 2010;19:R227–R240. doi: 10.1093/hmg/ddq416. [DOI] [PubMed] [Google Scholar]
- 43.Yang Y, Erb RM, Wiley BJ, Zauscher S, Yellen BB. Nano Lett. 2011;11:1681–1684. doi: 10.1021/nl200189w. [DOI] [PubMed] [Google Scholar]
- 44.De Vlaminck I, Henighan T, van Loenhout MTJ, Pfeiffer I, Huijts J, Kerssemakers JWJ, Katan AJ, van Langen-Suurling A, van der Drift E, Wyman C, Dekker C. Nano Lett. 2011;11:5489–5493. doi: 10.1021/nl203299e. [DOI] [PubMed] [Google Scholar]
- 45.Assi F, Jenks R, Yang J, Love C, Prentiss M. J Appl Phys. 2002;92:5584–5586. [Google Scholar]


