Abstract
Since Hounsfield's Nobel Prize winning breakthrough decades ago, X-ray CT has been widely applied in the clinical and preclinical applications - producing a huge number of tomographic gray-scale images. However, these images are often insufficient to distinguish crucial differences needed for diagnosis. They have poor soft tissue contrast due to inherent photon-count issues, involving high radiation dose. By physics, the X-ray spectrum is polychromatic, and it is now feasible to obtain multi-energy, spectral, or true-color, CT images. Such spectral images promise powerful new diagnostic information. The emerging Medipix technology promises energy-sensitive, high-resolution, accurate and rapid X-ray detection. In this paper, we will review the recent progress of Medipix-based spectral micro-CT with the emphasis on the results obtained by our team. It includes the state- of-the-art Medipix detector, the system and method of a commercial MARS (Medipix All Resolution System) spectral micro-CT, and the design and color diffusion of a hybrid spectral micro-CT.
Keywords: Multi-energy, spectral imaging, Medipix detector, Medipix all resolution system (MARS), hybrid spectral micro-CT, statistical iteration reconstruction, principle component analysis
While some people might consider the CT field as mature, it is still at its early stage. Since Hounsfield's Nobel Prize winning breakthrough decades ago[1], X-ray CT has been widely applied in the clinical and preclinical applications and produces a huge amount of tomographic gray-scale images. Annually, over 100-million medical CT scans are performed around the world, and a huge number of micro-CT scans are done in research institutions and pharmaceutical companies. However, these images are often insufficient to distinguish diagnostically crucial shading differences due to poor soft tissue contrast, inherent photon-count limitation, and radiation dosage needed. By physics, the X-ray spectrum is wide, and CT images need not be in gray-scale. Just as television technology is in true-color, the future of CT must be in true-color for much richer information.
The enabling technology that the European Organization for Nuclear Research (CERN) team has been developing is Medipix high-resolution X-ray energy-sensitive photon-processing detectors[2-4]. Previously, X-ray spectral imaging was only possible with a synchrotron radiation facility for its energy selectivity and brightness. Recently, the feasibility and utility of true-color CT (also referred to as color, spectral, spectroscopic, multi-energy, energy-selective or energy-sensitive CT) were reported based on regular X-ray tubes and Medipix detectors[4-5]. Compared to other X-ray photon-counting detectors, Medipix detectors define the finest spatial resolution and fastest imaging speed currently available. Furthermore they are ‘photon-processing’ in that they do not simply count photons in each pixel, but process adjacent pixels in their charge summing mode, to eliminate charge sharing between pixels. In contrast with dual-energy CT, where materials are differentiated by exposing them to two different X-ray spectra or using detectors with different energy ranges, spectral CT effectively utilizes a broad spectrum of an X-ray source and an energy-discriminating capability of a photon-counting detector. In other words, color CT counts all photons in a single exposure and is not limited in terms of the number of spectral channels.
With its unique Medipix detectors, the state-of-the-art spectral micro-CT scanner—Medipix All Resolution System (MARS)—has been designed and produced by MARS Bioimaging Ltd (MBI), in collaboration with the Christchurch School of Medicine and Health Sciences at the University of Otago (Radiology and Molecular Biology) and the University of Canterbury (Physics & Astronomy, Electrical and Computer Engineering, Biological Sciences, Mathematics & Statistics and the HIT Lab) in New Zealand. The gantry of this system supports a full-scan with an X-ray source (SourceRay–SB80-1k 80 kVp, or SB120∼350 120 kVp) and an X-ray spectral camera assembly under precise control around a specimen or animal up to 100 mm in diameter and 300 mm in length. The customized camera has a MARS gigabit readout accommodating up to 6 Medipix 2 or Medipix 3 detectors. In August 2010, the Biomedical Imaging Division (BID) at Virginia Tech (VT)-Wake Forest University (WFU) School of Biomedical Engineering and Sciences (SBES) purchased a MARS micro-CT scanner under a collaborative research agreement. In the last two years, the two groups worked closely as one team and produced fruitful results. In this paper, we will review the recent progress of spectral CT with the emphasis on the results obtained by our team.
The rest of this review paper is organized as follows. In the next section, we will briefly review the status of the Medipix detector family and its imaging model. In the third section, we will summarize the recent progress related to the MARS spectral micro-CT system. In the fourth section, we will introduce our newly designed hybrid micro-CT system and the related color diffusion phenomenon. In the last section, we will make some conclusions and complete this paper.
1 Energy-discriminating Detector
1.1 Medipix Detector Family
X-ray detection technology can be categorized into two groups: energy-integration and photon-counting. Almost exclusively, all current X-ray scanners use energy-integrating detectors where electrical signals, from interactions between an X-ray beam and materials, are accumulated over an entire spectrum. In contrast, the best photon-counting detectors recognize photons both individually and spectrally. The advantages of photon-counting, energy-discriminating detectors are evident relative to energy-integrating detectors[6]. First, energy-discriminating detectors record spectral responses of materials that are invisible to energy-integrating detectors. In energy-integrating detectors, low-energy photons carry more contrast information but receive lower weights due to beam hardening. All photon-counting detectors should not have any such bias in weighting X-ray photons[2-3]. Second, the best photon-counting detectors have an inherently higher signal-to-noise ratio (SNR) by utilizing spectral information, suppressing electronic and swank noise[7], and rejecting scattered photons[8]. The SNR improvement for photon-counting detectors can be up to 90%[3]. Third and most importantly, photon-counting detectors can reveal elemental composition of materials and support novel contrast-enhanced studies[9-10] and opening new possibilities for functional, cellular and molecular imaging with novel contrast agents such as gold nanoparticles (GNPs)[11-14].
Medipix is a series of state-of-the-art photon-counting detectors for X-ray micro-imaging from the CERN[4]. Medipix 1 has detector cells each measuring 170×170 μm[4]; Medipix 2 refines that to 55×55 μm[5]. The performance of Medipix 2 is limited by charge sharing over neighboring pixels, compromising energy resolution much more than spatial resolution. To address this issue, Medipix 3.0 was developed as a photon-processing chip[15]. Special circuitry for each pixel in Medipix 3.0 allows charge deposition in adjacent pixels to be summed and analyzed with two simultaneous energy thresholds without spectral distortion. The readout logic also supports eight energy thresholds over 110×110 μm for spectroscopic imaging. Medipix 3.1 is currently undergoing tests, with Medipix 3.2 due back from the IBM foundry mid 2012. It is underlined that the Medipix “flip-chip” design permits various sensors to be bump-bonded to the Medipix chip. Sensor materials include Si, GaAs, and CdTe for preclinical and clinical X-ray energy ranges[16-17].
1.2 Detector Imaging Model
It is well known that an X-ray projection is generated in two steps: modulated by chemical components, density and thickness of materials; then transformed by the imaging chains that include image intensifier, vidicon, and the data acquisition unit. Under the ideal imaging conditions, (a) X-ray energy is monochromatic, (b) there is no scattering in imaging process and (c) the imaging chains are linear, the relationship between the X-ray and the imaging object can be modeled by the so-called Lambert-Beer Law
| (1) |
where E0 is the monochromatic energy, I0(E0)is the photon intensity emitting from the X-ray source, D(E0)is the detector efficiency, I(E0) is the received photon intensity by the detector, l represents the X-ray path, and μ(E0, l) is the attenuation map depending on the energy E0 After a logarithm operation on Eq.(1), we can obtain
| (2) |
Eq.(2) is the well accepted mathematical model, Radon transfom, in the CT field. However, for practial applications, the X-ray source is polychromatic instead of monochromatic, which usually consists of a spectrum I0(E) for E ∊[0, ∞) As a result, Eq.(1) should be rewritten as
| (3) |
where I is the received photon intensity by the detector over all the energy range. Although μ(E, l) depends on the energy E in Eq.(3), the Radon tranfrom model is still well accepted and aplied as
| (4) |
where is a weightred average of the attenuation map independent of energy.
For a given energy threshold T1, the received photo intensity by a spectral detector (e.g. Medipix 3) can be expressed as:
| (5) |
By a simple subtraction operation, for a given energy bin defined by two energy thresholds 0<T1<T2, the received photon intensity can be modeled as[18],
| (6) |
Similar to the conventional CT, the Radon transform model can be applied to Eq.(6) and we obtain
| (7) |
where T1 < ET1T2(l) < T2 and is dependent on the X-ray path l. When T2−T1 trends to zero, Eq.(6) will become Eq.(1) and Eq.(7) will become Eq.(2). This Radon transfom model has been accepted in the CT field for spectral CT[19].
2 MARS Spectral Micro-CT System
2.1 System Geometrical Alignment
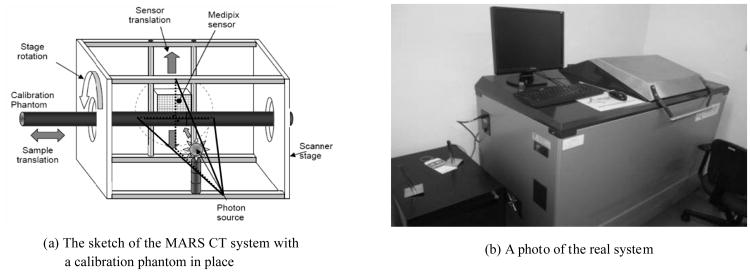
The MARS system is a desk-sized, free-standing machine consisting of a broad spectrum X-ray source and an energy discriminating detector in a fully shielded enclosure, along with supporting computer hardware, peripheral electronics, and viewing software (see Fig.1). The system provides a significant, new platform for biomedical imaging research by accurately differentiating atomic and density variation within the imaging tissues. The MARS system employs a Medipix detector which allows up to eight simultaneous energy sampling thresholds (bins) from a single exposure. The Medipix detector is a photon counting system with selectable thresholds, which depends on a threshold equalization mask to adjust each pixel to record different energy photons. The active area of the Medipix detector is 14×14 mm, comprising 256×256 pixels with each pixel covering an area of 55×55 μm.
Fig.1. MARS spectral micro-CT system.
The MARS CT unit consists of a rotating gantry holding an X-ray source and a Medipix detector on two opposite sides of the rotational axis (see Fig.1). Because the detector covers an area of 14×14 mm, the MARS system is in typical cone-beam geometry. Due to the inconsistency between the centers of the detector array and the X-ray beam, it is necessary for us to determine the relative positions among the X-ray source, the imaging object and the detector plane with physical phantoms (e.g. a metallic pin)[20]. First, we estimated the rotation axis in the sinogram to find the horizontal central plane. Then, we calculated the distance from the X-ray source to the system origin and the distance from the system origin to the detector from various projections. To determine the detector to axis distance and X-ray source to axis distance, we sought the horizontal central plane and vertical central plane of the cone-beam geometry. Because the X-ray source and detector have been aligned and fixed in the rotating vertical plane, we can consider the vertical detector central plane is the rotating plane and only need to find the horizontal detector central plane. After we determined the horizontal central plane of the cone-beam geometry, we put a physical phantom (a metallic pin) in the vertical central plane containing the vertical central line of the detector array. We used the detector position, X-ray source position and sample position to determine the detector to axis distance and X-ray source to axis distance.
2.2 Detector Energy Calibration
The Medipix detector is a photon-counting system with selectable energy thresholds (i.e. selective energy window/range). During initial calibration, each individual detector cell has a unique threshold equalization mask applied to adjust each pixel's energy threshold response to be homogeneous. For a selected energy threshold value, the detector counts photons whose energy is above that value (see Eq.(5)). Thus, it is necessary to calibrate each detector's threshold values to a known incident photon energy to determine the relationship between photon energy and threshold value[21].
We tested the K-edge characteristics of elemental Zirconium (Zr), Molybdenum (Mo) and Palladium (Pd) foils of varying thickness using the Medipix 2 silicon detector to determine the relationship between photon energies and the selectable thresholds[21]. We set the selectable threshold value from 450 to 599 to capture transverse projection images of these elemental foils. In our analysis, an energy bin covers six energy thresholds. As a result, we obtained 145 integrated attenuation coefficients from 150 projections. We calculated the attenuation- versus-energy curves of these materials using Eq.(7), and the peaks of attenuation- versus-energy curves were approximated as the material k-edge. The relationship between the k-edges of test materials and detector energy threshold values were fitted into a linear function[22-23] E=−0.20×T+128.35, where E is photon energy and T is energy threshold. The unit of E is keV[21].
2.3 Reconstruction Algorithm
Conventional analytical or iterative reconstruction methods can be used to reconstruct the spectral image for each energy channel (bin). Because of the low-count noise in the projections, our emphasis was put on the iterative algorithms. The simultaneous algebraic reconstruction techniques (SART) is a representative iterative algorithm, and the ordered-subset (OS) scheme is an effective method to accelerate the iterative reconstruction algorithm, hence OS-SART. The convergence of the OS-SART algorithm has been demonstrated and well accepted in the CT field[24-25]. It is worth noting that OS-SART uses index subsets in different orders to accelerate the convergence speed. In recent years, compressive sensing (CS)-based iterative reconstruction algorithms have been developed[26-27], which can reconstruct high-quality images from less projection data than what is usually considered necessary according to the Nyquist sampling theory; meanwhile, the CS-based iterative algorithm is very effective to deal with image artifact and noise. Here we combined OS-SART and CS to reconstruct the spectral images. In our application, the discrete gradient transform (DGT) was chosen to serve as the sparsifying transform, and the final images were reconstructed by minimizing the total variation (TV)[20-21, 28].
Due to the lower counts and higher noise in each spectral channel, it is important to accommodate the statistical property of the projections. We also employed a statistical iterative reconstruction (SIR) algorithm for each spectral channel[28]. The detected photons of each spectral channel s (s=1, 2, …, S, S is the number of spectral channels) can be approximately modeled as a Poisson distribution,
| (8) |
where is the measured data of the spectral channel s along the mth X-ray path, is the blank scan factor, is the integral of the X-ray linear attenuation coefficients, A={amn} is the system matrix, distribution of linear attenuation coefficients, accounts for read-out noise, and M and N are the number of projections and pixels. Combining the Poisson property of projection data and the TV regularization in the maximization of a posterior (MAP) framework, the image on each spectral channel s can be exactly reconstructed via minimizing the following objective function,
| (9) |
where is the statistical weight for each X-ray path, is the estimated line integral, βs is the regularization parameter to balance the data fidelity and TV terms, and TV(μs) is the operator of computing TV of the reconstructed image.
2.4 Image Rendering
After the reconstructed images of all spectral channels are obtained, the next important task is to extract features from these reconstructions to render a color/spectral image μc. Principle component analysis (PCA) is a simple and effective method to identify independent information from highly correlated data[29]. First, a covariance matrix C of the images set in spectral domain is computed. Applying singular value decomposition to C and arranging the eigenvalues in decreasing order, the corresponding eigenvectors form a new basis, which are called principal components. The original spectral images can be transformed to form the principal components image (PC-image) set. We can use the first several PC-images to discriminate between various materials. As for color mapping, we can either adopt the RGB or HSV mapping. The red, green, blue components or the hue, saturation, value components of the final color image can be linear/nonlinear mapped from the PC-images or the linear/nonlinear combinations of these images. Our team is working to optimize a general map scheme for better visualization based on computer vision theory.
2.5 Application Example
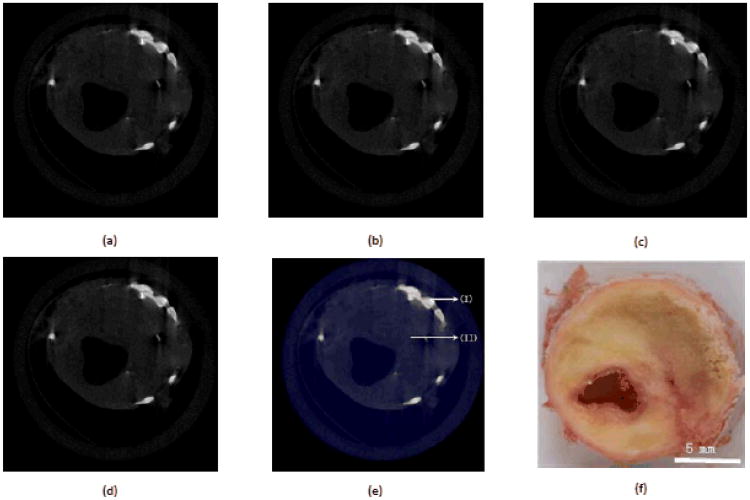
A human atheroma plaque sample was prepared and scanned by the MARS spectral micro-CT system with Medipix 3 silicon detector. The frozen plaque sample was placed in a 15mL tube, and the MARS scanner was used to capture the sample projections at four energy thresholds (10, 16, 22 and 28 keV). To keep the specimen frozen during the scan, cold gas was delivered from a cooling chamber filled with liquid nitrogen to the sample tube. This is a typical advanced-stage plaque which contains lipid, iron and calcium deposits. Fig.2(a)∼(d) show the reconstructed images of one slice at the four energy thresholds. From Fig.2(a)∼(d), we can see that the four reconstructed images are very similar because there is no additional contrast agents in the sample and the characteristics of spectrum at the four energy thresholds are similar. However, different energy thresholds mean different energy bins, in turn producing different attenuation values, so the gray values of atheroma images at the four energy thresholds are different. We can apply PCA to evaluate the maximal covariance in these data, and get the first three maximum eigenimages to generate a true-color image as in Fig.2(e), where there are several distinct classes of material shown. Fig.2(f) is a picture of the human atheroma plaque sample for reference.
Fig.2.
Spectral analysis result of the central slice of the human atheroma sample. (a)∼(d) are the reconstructed images in a display window[0, 0.02] for energy thresholds 10, 16, 22, and 28 keV, respectively. (e) is true-color image mapped from the three eigenimages, where (I) represents calcification (iron and calcium deposits) and (II) indicates lipid deposits. (f) is a picture of the human atheroma plaque sample for reference
3 Hybrid Spectral Micro-CT System
3.1 System Design
Given innumerable potential applications of spectral X-ray CT (e.g. tissue characterization, functional studies, cellular and molecular imaging), the transition from gray-scale to true-color is almost certain to occur sooner or later. However, there are two major challenges in this process: detector cost and radiation dose. First, the spectral detection technology is not yet mature for large area, high resolution, uniform performance and long duration operation. The replacement of a gray-scale X-ray detector array with a true-color spectral detector will be rather expensive in the near future. Second, radiation exposure is a public concern, and X-ray spectral detection would requires much higher radiation dosage if each spectral channel requires the same exposure as that for a corresponding energy-integrating detector. These issues will require further research and refinement, but are far from terminal limitations.
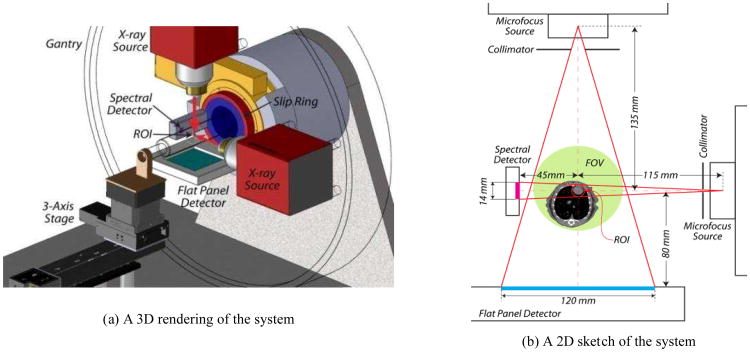
We proposed that the detector cost and radiation dose problems of X-ray spectral micro-CT can be solved by applying interior tomography. We designed a hybrid true-color micro-CT system[30]. The system consists of a wide-beam gray-scale imaging chain perpendicular to a narrow-beam true-color imaging chain on a rotating slip ring (Fig.3(a)). The wide-beam imaging chain is designed to have a field of view (FOV) of radius 36 mm, which provides conventional projection data for global gray-scale imaging. The narrow-beam imaging chain is designed to have a FOV of radius 5mm, which provides a set of spectral projection data for true-color ROI reconstruction (Fig.3(b)). The scanner's multi-spectral photon-counting X-ray detector was selected as Medipix 3. The gray-scale X-ray detector is a 120×120 mm sensitive area with a pixel size of 50×50 μm. The two X-ray tubes are identical and designed to allowing the K-edge imaging of gold nanoparticles (GNP) at 80.7 KeV. The targets of this system are 50 μm spatial resolution, 20 Hounsfield unit (Hu) noise deviation, 8 spectral channels, and up to 15 rotations per minute.
Fig.3. Hybrid spectral micro-CT system[28].
3.2 Reconstruction Method
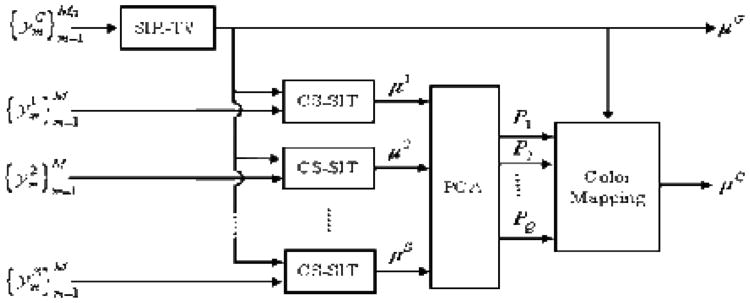
From the aforementioned hybrid spectral micro-CT system, one global polychromatic projection dataset and several local spectral projection datasets can be obtained. For the global projection data, the conventional analytical or iterative reconstruction methods can be used to reconstruct a gray-scale global image as summarized in subsection 3.3. For the locally spectral projection datasets, the interior tomography methods can be used to reconstruct an interior region-of-interest (ROI) image on each spectral channel[31]. After that, an interior spectral image can be rendered from this set of ROI reconstructions via some image analysis methods, such as PCA. On the other hand, the gray-scale global reconstruction can be used to improve the performance of the interior spectral reconstruction. The overall workflow of a reconstruction algorithm for the hybrid imaging system is shown in Fig.4[28], where SIR-TV presents the statistical iterative reconstruction regularized by total variation minimization (see Eq.(9)), CS-SIT is the compressive sensing based statistical interior tomography, is the projection dataset collected by the global imaging chain and (s=1, 2, ⋯, S) is the local spectral datasets. On each spectral channel, the image μs is reconstru ted by the CS-SIT with μG as the initial image. Then a PCA is performed on this set of spectral results . The first Q PC-images are picked out and combined with the global reconstruction μG to render a color image μC It should be pointed out that the CS-SIT can also be written in the form of Eq.(9) if we choose the discrete gradient transform as the sparse function. For this case, the major difference between SIR-TV and CS-SIT is the system geometry and available projection dataset.
Fig.4. An image reconstruction workflow for the hybrid spectral micro-CT system[28].
3.3 Color Diffusion
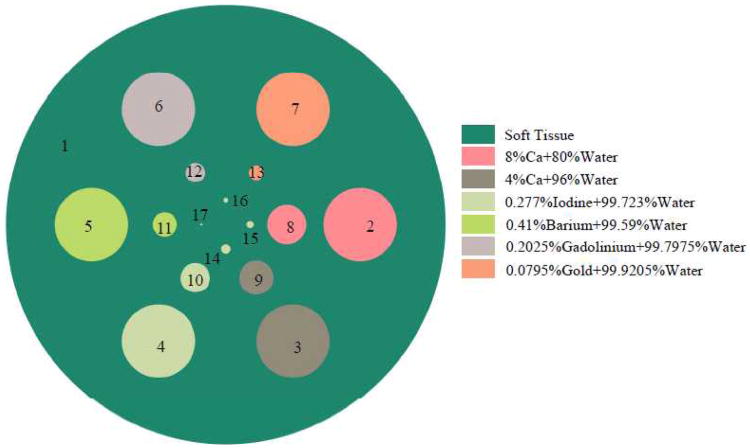
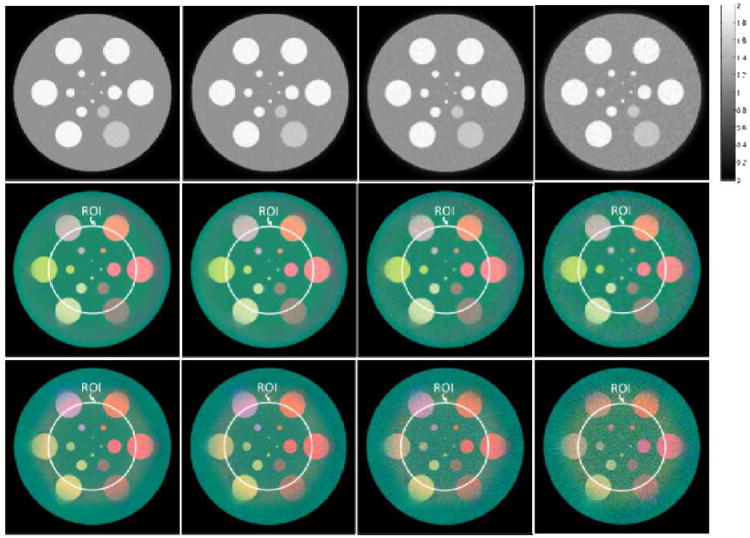
To demonstrate the feasibility of the hybrid true-color micro-CT system and evaluate the associated reconstruction method, a numerical simulation experiment was performed[28]. In this simulation, we designed a cylindrical phantom (Fig.5), containing several cylindrical inclusions of various radii and seven materials with different energy attenuation properties[28]. Taking into account the k-edges of materials in this phantom, which are iodine (33 keV), barium (37.4 keV), gadolinium (50.2 keV) and gold (80.7 keV), five spectral channels were selected in the spectral imaging chain: ≤ 32 keV, 33 ∼ 37 keV, 38 ∼ 42 keV, 51 ∼ 56 keV and ≥ 81 keV. In order to simulate various noisy scenarios, both the gray and spectral imaging chains were simulated with emitted photon counts along each X-ray path as 105, 5×10⁴, 2×10⁴ and 104. The image reconstruction process was implemented following the workflow illustrated in Fig.4. For comparison, images were also reconstructed by the conventional FBP (filtered-backprojection) method.
Fig.5. Transverse plane of the cylindrical phantom with seven different materials [28].
The reconstructed results are shown in Fig.6[28]. Given the results in Fig.6, one can see that a high quality spectral image is typically available in the neighboring region of the ROI, even as the spectral imaging chain only covers the ROI itself. This phenomenon was named as “color diffusion”, which appears to benefit from stabilizing the interior tomography of each spectral channel aided by the global gray-scale reconstruction. Using this color diffusion phenomenon, we can potentially use a smaller spectral detector for a given ROI and thus reduce system cost. For example, if we wanted to reconstruct an ROI of radius 20.0 mm, we may choose a smaller spectral detector which only covers a 14.0 mm radius field of view. Preclinical applications have confirmed those merits. The interested readers can refer to the reference [28] for more details.
Fig.6.
Reconstructed images in numerical simulation[28]. The 1st –3rd rows are the global gray-scale reconstructions by SIR-TV, the spectral interior reconstructions by the proposed method and the spectral CT results based on FBP reconstructions (with appropriate extrapolation and constant shift), respectively. From 1st to 4th columns are the results from the projections assuming 105, 5×10⁴, 2×10⁴, and 104 photons, respectively
4 Conclusion Remarks
Due to its energy-resolving power, high SNR, fine spatial resolution and fast readout speed, Medipix and MARS CT techniques have found a wide arrange of exciting applications in radiography[32], phase-contrast imaging[33], breast CT[34], and micro-CT including X-ray fluorescence analysis[6, 35-36]. It is underlined that the utility of spectral CT can be dramatically boosted with novel contrast agents such as GNPs for functional, cellular example, AuroVist™ is the first GNP contrast agent, enabling greatly enhanced X-ray imaging of tumors, blood vessels, and other structures. It consists of 1.9 or 15nm GNPs with a water soluble organic shell for high concentration (up to 1.5g Au/cc) and is well tolerated in vivo. Gains with AuroVist™ include higher contrast and longer residence time than iodine agents, clearance through kidneys with low toxicity (LD50>1.4g Au/kg), and, most excitingly, spectral imaging such as K-edge imaging.
Since Hounsfield's Nobel Prize winning work four decades ago, CT systems have traditionally collected photon-integrating data and produced gray-scale images in so-called “Hounsfield units (Hu)”. Furthermore, CT architectures have been dictated by large-width detector arrays to cover a transverse slice fully, even though most features of interest are energy-dependent, and ROIs are often small parts of whole cross-sections or volumes. The fundamental reasons behind such single channel imaging and large detector width used to be the lack of high-performance spectral detection and inability to produce exact interior reconstruction. The recently proposed hybrid spectral micro-CT will make solid steps forward from gray-scale to spectral CT imaging and from wide detector-based architectures to locally oriented scanning architectures. The integration of these components should produce a highly powerful and innovative new CT architecture for general use.
In conclusion, the Medipix-based spectral CT systems have a good energy-discriminative performance which identified the k-edge characteristics of various materials. The recent progress along this direction demonstrated the differences between the spectral CT and conventional CT, showing a great potential for preclinical and clinical applications including, but not limited, to tissue characterization and contrast studies. However, lots of efforts are needed to make these technologies available for clinical applications.
Acknowledgments
Foundation Item: This work was supported in part by NIH/NIBIB grant EB011785, the Ministry of Science and Innovation (New Zealand), and a seed grant from Wake Forest Institute for Regenerative Medicine.
Biography

Hengyong Yu✉ received his Bachelor degrees in information science & technology (1998) and computational mathematics (1998), and his PhD in information & telecommunication engineering (2003) from Xi'an Jiaotong University. He was Associate Research Scientist with the University of Iowa (2004 ∼ 2006), and Research Scientist with Virginia Tech (2006 ∼ 2010). Since 2010, he has been an Assistant Professor, the Director of CT Lab, Departments of Radiology and Biomedical Engineering, Wake Forest University Health Sciences. His interests include computed tomography and medical image processing. He has authored or coauthored >90 peer-reviewed journal papers. He is a senior member of the Institute of Electrical and Electronics Engineers (IEEE) and the IEEE Engineering in Medicine and Biology Society (EMBS), and member of the American Association of Physicists in Medicine (AAPM) and the Biomedical Engineering Society (BMES). In 2012, he received an NSF CAREER award for the development of compressive sensing based interior tomography.
References
- 1.Dichiro G, Brooks RA. 1979 Nobel-Prize in Physiology or Medicine[J] Science. 1979;206(4422):1060–1062. doi: 10.1126/science.386516. [DOI] [PubMed] [Google Scholar]
- 2.Cahn RN, Cederström B, Danielsson M, et al. Detective quantum efficiency dependence on X-ray energy weighting in mammography[J] Medical Physics. 1999;26(12):2680–2683. doi: 10.1118/1.598807. [DOI] [PubMed] [Google Scholar]
- 3.Giersch J, Niederlohner D, Anton G. The influence of energy weighting on X-ray imaging quality[J] Nuclear Instruments & Methods in Physics Research Section a-Accelerators Spectrometers Detectors and Associated Equipment. 2004;531(1-2):68–74. [Google Scholar]
- 4.Campbell M, Heijne EHM, Meddeler G, et al. A readout chip for a 64×64 pixel matrix with 15-bit single photon counting[J] IEEE Transactions on Nuclear Science. 1998;45(3):751–753. [Google Scholar]
- 5.Llopart X, Campbell M, Dinapoli R, et al. Medipix 2: A 64-k pixel readout chip with 55 μm2 elements working in single photon counting mode[J] IEEE Transactions on Nuclear Science. 2002;49(5):2279–2283. [Google Scholar]
- 6.Jakubek J. Semiconductor Pixel detectors and their applications in life sciences[J] Journal of Instrumentation. 2009;4:22. Article ID: P03013. [Google Scholar]
- 7.Swank RK. Calculation of modulation transfer functions of X-ray fluorescent screens[J] Applied Optics. 1973;12(8):1865–1870. doi: 10.1364/AO.12.001865. [DOI] [PubMed] [Google Scholar]
- 8.Shikhaliev PM. Beam hardening artefacts in computed tomography with photon counting, charge integrating and energy weighting detectors: A simulation study[J] Physics in Medicine and Biology. 2005;50(24):5813–5827. doi: 10.1088/0031-9155/50/24/004. [DOI] [PubMed] [Google Scholar]
- 9.Schlomka JP, Roessl E, Dorscheid R, et al. Experimental feasibility of multi-energy photon-counting K-edge imaging in pre-clinical computed tomography[J] Physics in Medicine and Biology. 2008;53(15):4031–4047. doi: 10.1088/0031-9155/53/15/002. [DOI] [PubMed] [Google Scholar]
- 10.Anderson NG, Butler AP, Scott NJ, et al. Spectroscopic (multi-energy) CT distinguishes iodine and barium contrast material in mice[J] European Radiology. 2010;20(9):2126–2134. doi: 10.1007/s00330-010-1768-9. [DOI] [PubMed] [Google Scholar]
- 11.Hainfeld JF, Slatkin DN, Focella TM, et al. Gold nanoparticles: A new X-ray contrast agent[J] British Journal of Radiology. 2006;79(939):248–253. doi: 10.1259/bjr/13169882. [DOI] [PubMed] [Google Scholar]
- 12.Akolekar DB, Foran G, Bhargava SK. X-ray absorption spectroscopic studies on gold nanoparticles in mesoporous and microporous materials[J] Journal of Synchrotron Radiation. 2004;11(Pt 3):284–290. doi: 10.1107/S0909049504001694. [DOI] [PubMed] [Google Scholar]
- 13.Wang Z, Wu L, Cai W. Size-tunable synthesis of monodisperse water-soluble gold nanoparticles with high X-ray attenuati on[J] Chemistry. 2010;16(5):1459–63. doi: 10.1002/chem.200902463. [DOI] [PubMed] [Google Scholar]
- 14.Xu C, Tung GA, Sun S. Size and concentration effect of gold nanoparticles on X-ray attenuation as measured on computed tomography[J] Chemistry of Materials. 2008;20(13):4167–4169. doi: 10.1021/cm8008418. [DOI] [PMC free article] [PubMed] [Google Scholar]
- 15.Ballabriga R, Campbel M, Heijne EHM, et al. The medipix 3 prototype, a pixel readout chip working in single photon counting mode with improved spectrometric performance[J] IEEE Transactions on Nuclear Science. 2007;54(5):1824–1829. [Google Scholar]
- 16.Zwerger S, Abu-Id MH, Kreusch T. Long-term results of fittig subperiosteal implants: report of twelve patient cases[J] Mund Kiefer Gesichtschir. 2007;11(6):359–362. doi: 10.1007/s10006-007-0081-5. [DOI] [PubMed] [Google Scholar]
- 17.Sorgenfrei R, Greiffenberg D, Bachem KH, et al. Growth of thick films CdTe from the vapor phase[J] Journal of Crystal Growth. 2008;310(7-9):2062–2066. [Google Scholar]
- 18.Bornefalk H, Danielsson M. Photon-counting spectral computed tomography using silicon strip detectors: A feasibility study[J] Physics in Medicine and Biology. 2010;55(7):1999–2022. doi: 10.1088/0031-9155/55/7/014. [DOI] [PubMed] [Google Scholar]
- 19.Gonzales B, Lalush D. Full-spectrum CT reconstruction using a weighted least squares algorithm with an energy-axis penalty[J] IEEE Transactions on Medical Imaging. 2011;30(2):173–183. doi: 10.1109/TMI.2010.2048120. [DOI] [PubMed] [Google Scholar]
- 20.He P, Yu HY, Thayer P, et al. Preliminary experimental results from a MARS micro-CT system[J] Journal of X-ray Science and Technology. 2012;20(2):199–211. doi: 10.3233/XST-2012-0329. [DOI] [PMC free article] [PubMed] [Google Scholar]
- 21.He P, Yu HY, Bennett J, et al. Energy-discriminative performance of a spectral micro-CT system[J] Journal of X-ray Science and Technology. 2012 doi: 10.3233/XST-130382. under review. [DOI] [PMC free article] [PubMed] [Google Scholar]
- 22.Fiederle M, Greiffenberg D, Idárraga J, et al. Energy calibration measurements of MediPix 2[J] Nuclear Instruments & Methods in Physics Research Section a-Accelerators Spectrometers Detectors and Associated Equipment. 2008;591(1):75–79. doi: 10.1016/j.nima.2008.03.072. [DOI] [PMC free article] [PubMed] [Google Scholar]
- 23.Ponchut C, Zontone F. Evaluation of medipix-1 in X-ray scattering and X-ray diffraction applications[J] Nuclear Instruments & Methods in Physics Research Section a-Accelerators Spectrometers Detectors and Associated Equipment. 2003;510(1-2):29–34. [Google Scholar]
- 24.Wang G, Jiang M. Ordered-subset simultaneous algebraic reconstruction techniques (OS-SART)[J] Journal of X-ray Science and Technology. 2004;12(3):169–177. [Google Scholar]
- 25.Jiang M, Wang G. Convergence studies on iterative algorithms for image reconstruction[J] IEEE Transactions on Medical Imaging. 2003;22:569–579. doi: 10.1109/TMI.2003.812253. [DOI] [PubMed] [Google Scholar]
- 26.Donoho DL. Compressed sensing[J] IEEE Transactions on Information Theory. 2006;52(4):1289–1306. [Google Scholar]
- 27.Yu HY, Wang G. Compressed sensing based Interior tomography[J] Physics in Medicine and Biology. 2009;54(9):2791–2805. doi: 10.1088/0031-9155/54/9/014. [DOI] [PMC free article] [PubMed] [Google Scholar]
- 28.Xu Q, Yu HY, Bennett J, et al. Image reconstruction for hybrid true-color micro-CT[J] IEEE Transactions on Biomedical Engineering. 2012;59(6):1711–1719. doi: 10.1109/TBME.2012.2192119. [DOI] [PMC free article] [PubMed] [Google Scholar]
- 29.Jolliffe IT. Springer Series in Statistics[M] 2nd. New York: Springer-Verlag; 2002. Principal component analysis. [Google Scholar]
- 30.Wang G. Tomography-based and MRI-based imaging systems, USA Patent Application, No: 12916458. 2010. [Google Scholar]
- 31.Xu Q, Mou XQ, Wang G, et al. Statistical Interior Tomography[J] IEEE Transactions on Medical Imaging. 2011;30(5):1116–1128. doi: 10.1109/TMI.2011.2106161. [DOI] [PMC free article] [PubMed] [Google Scholar]
- 32.Greiffenberg D, Fiederle M, Vykydal Z, et al. Detection efficiency of ATLAS-MPX detectors with respect to neutrons[J] Nuclear Instruments & Methods in Physics Research Section a-Accelerators Spectrometers Detectors and Associated Equipment. 2009;607(1):38–40. [Google Scholar]
- 33.Jakubek J, Granja C, Dammer J, et al. Phase contrast enhanced high resolution X-ray imaging and tomography of soft tissue[J] Nuclear Instruments & Methods in Physics Research Section a-Accelerators Spectrometers Detectors and Associated Equipment. 2007;571(1-2):69–72. [Google Scholar]
- 34.Frallicciardi PM, Jakubek J, Vavrik D, et al. Comparison of single-photon counting and charge-integrating detectors for X-ray high-resolution imaging of small biological objects[J] Nuclear Instruments & Methods in Physics Research Section a-Accelerators Spectrometers Detectors and Associated Equipment. 2009;607(1):221–222. [Google Scholar]
- 35.Dammer J, Frallicciardi PM, Jakubek J, et al. Real-time in-vivo mu-imaging with Medipix 2[J] Nuclear Instruments & Methods in Physics Research Section a-Accelerators Spectrometers Detectors and Associated Equipment. 2009;607(1):205–207. [Google Scholar]
- 36.Firsching M, Butler APH, Anderson NG, et al. Contrast agent recognition in small animal CT using the Medipix 2 detector[J] Nuclear Instruments & Methods in Physics Research Section a-Accelerators Spectrometers Detectors and Associated Equipment. 2009;607(1):179–182. [Google Scholar]


