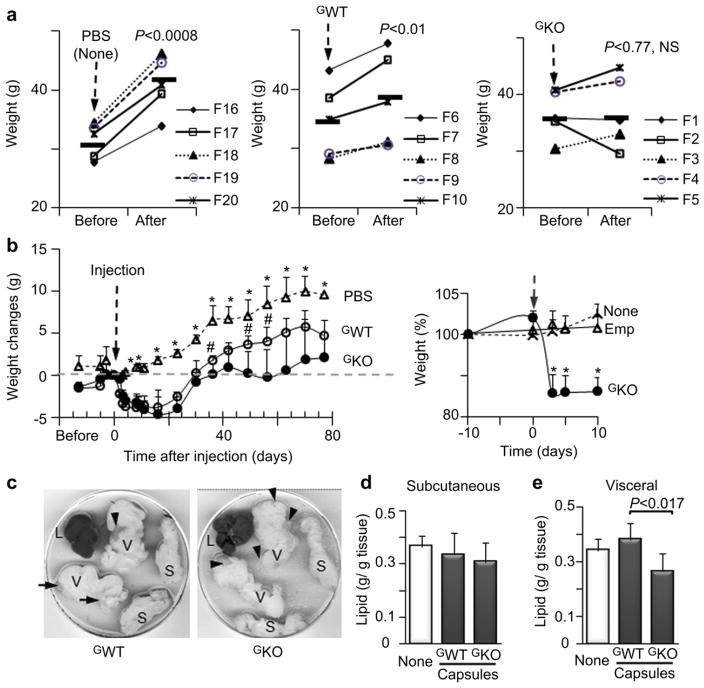
Fig. 4.
(a) Weight of obese mice on an HF before injections with PBS (mock-injection), and microcapsules containing GWT and GKO fibroblasts and 80 days after injection (Study 2). Mice were C57BL/6J (WT), n = 5 per group. Symbols represent individual mice encoded with F (number), ▬ indicates weight average in each group. Mice were on an HF throughout the study. P, significance values determined by paired t-test. NS, not significant. (b) Kinetics of weight gain in a control mouse group injected with 1 mL PBS (open triangles) and weight loss in mice injected with GWT microcapsules (open circles) or GKO microcapsules (closed circles). Black dashed line indicates the time of injection. Gray dashed line shows the weight on a day of injection. Data are shown as mean ± SD with five animals per group, significance levels (P < 0.05) were measured by Mann–Whitney U test.*, significant differences between the control and mouse groups treated with encapsulated cells. #, significant differences between mice injected with GWT and GKO microcapsules. Insert shows weight change in the non-treated obese mice (dashed line), and mice treated with acellular (emp, triangles) and GKO microcapsules (solid circles) in a pilot group of 9 female WT obese mice fed HF diet throughout study. Mice were injected with GKO or acellular (empty) microcapsules (Both groups: 4*105 in 0.5 mL PBS, n = 3, mean ± SD). The remaining mouse group was not injected (not treated, n = 3). Injection time is indicated by an arrow. Food consumption was similar in all mice before and after injection, while weight was reduced only in mice injected with GKO. Data are shown as mean ± SD. Weight change (%) was compared to weight of each mouse10 days prior to injection (100%). *, significant differences between the control and mouse groups treated with encapsulated cells. (c) Representative visceral (V) and subcutaneous (S) fat pads and liver (L) from Study 2. Organs were collected after dissection into P100 dishes. Arrow shows visible clusters of microcapsules that appeared at different amounts and locations on visceral fat pads. (d & e) Lipid weight per gram of subcutaneous (d) or visceral (e) fat pad dissected from mice from Study 2. One whole fat pad from each mouse was weighed, and, then, homogenized in equal volume of RIPA buffer. Lipids weights were determined after homogenate extraction and evaporation of organic phase under nitrogen gas. Protein content was also measured in the remaining homogenate to obtain lipid per gram protein ratio.

