

Abstract
Ecological momentary assessments (EMA) of anxiety and anger/hostility were obtained every 25–30 minutes over two 24-hour periods, separated by a median of 6 months, from 165 employees at a university in the Northeast. We used a multilevel trait-state-error structural equation model to estimate: (1) the proportion of variance in EMA anxiety and anger/hostility attributable to stable trait-like individual differences; (2) the correspondence between these trait-like components of EMA anxiety and anger/hostility and traditional questionnaire measures of each construct; and (3) the test-retest correlation between two 24-hour averages obtained several months apart. After adjustment for measurement error, more than half the total variance in EMA reports of anxiety and anger/hostility is attributable to stable trait-like individual differences; however, the trait-like component of each construct is only modestly correlated with questionnaire measures of that construct. The 6-month “test-retest” correlations of latent variables representing the true 24-hour EMA average anxiety and average anger are quite high (r ≥ 0.83). This study represents the longest follow-up period over which EMA-based estimates of traits have been examined. The results suggest that although the trait component (individual differences) of EMA momentary ratings of anxiety and anger is larger than the state component, traditional self-report questionnaires of trait anxiety and anger correspond only weakly with EMA-defined traits.
Keywords: Ecological momentary assessment, multilevel modeling, trait versus state measurement, assessment methods, anger, anxiety
1. Introduction
The distinction between traits and states is of fundamental theoretical importance in personality psychology and has important applied implications. Traits are stable and consistent individual characteristics or patterns of behavior, cognition, or affect that are thought to predict future observable phenomena across situations. States, in contrast, are behaviors, cognitions, and/or affects that result from an interaction of person characteristics and situational influences and have the potential to be manipulated and changed (Chaplin, John, & Goldberg, 1988). Though the conceptual distinction between the two seems clear, the differential assessment of traits and states has proven difficult. This difficulty arises, in part, because person characteristics are seldom pure states or traits, but instead vary on a continuum of more or less state-like or trait-like (Chaplin, John, & Goldberg, 1988). Historically the assessment of states and traits has relied on questionnaires in which subjects are asked to report on their behavior, cognition, and affect “right now” (for state assessment) or “in general” (for trait assessment). Such scales have, with appropriate modification of the timeframe, been used to assess both the state and trait aspects of constructs such as anger, anxiety, and depression.
Recent years have witnessed rapid developments in both data collection methodology (e.g. ecological momentary assessment (EMA)) and data analytic techniques (e.g. multilevel models (MLM), mixed effects regression models, structural equation models (SEM)) that now permit the appropriate partitioning of variation in reported behavior and emotion over time into between-person (trait) and within-person (state) variance components. Building on early conceptual work by Larson (1989), these developments were heralded by the work of Fleeson (2004) who recognized the importance of these developments for the “person-situation debate.” Early work by Eid and Diener (1999) on intra-individual variability in affect was another fore-runner of this work. Now, there are a number of applications of these techniques in a variety of areas including structural analyses of trait and state positive and negative affect (Merz & Roesch, 2010), coping (Roesch, et al, 2010, Schwartz, et al., 1999), and alcohol use (Arnell, Todd, and Mohr, 2005). A recent methodological summary by Bauer (2011) will no doubt further increase the application of these methods to new areas.
The purpose of the research reported here is to empirically assess the degree to which anxiety and anger are trait-like constructs over an extended period using EMA and a multilevel SEM. Specifically, we investigate (1) the extent to which momentary EMA reports of anxiety and anger, assessed on 2 days separated by 6 months, are trait-like, and (2) the convergent validity of the trait-like portion of EMA-assessed anxiety and anger with traditional questionnaire measures of these constructs (Figure 1). While many recent studies have used EMA and MLM to estimate state and trait variance in a number of psychological constructs, most have relied on relatively limited data collection time frames.
Figure 1.
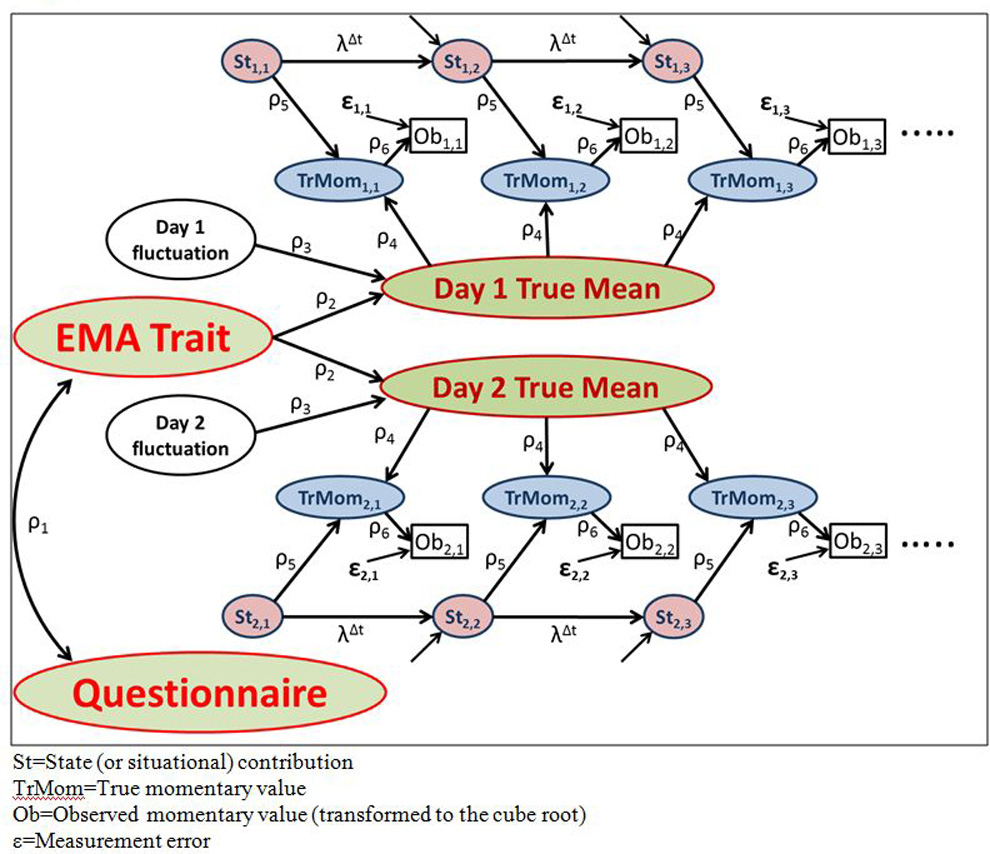
Multilevel trait-state-error model of momentary EMA data for anxiety or anger assessed during two 24-hour periods, and the correlation of the stable EMA trait component with a trait questionnaire
1.1 Elucidating the trait-state distinction with respect to anxiety and anger
Anxiety and anger have both trait and state properties (Endler & Kocovski, 2001; Freud, 1920). Consistent with the dispositional view of traits, trait anxiety and anger refer to tendencies for an individual to experience anxious or angry feelings with significant intensity (Spielberger, 1972, 1988). The separate assessment of trait and state anxiety and anger has been hampered by the use of retrospective traditional questionnaires.
Early empirical work seeking to distinguish state from trait anxiety relied on factor analyses of measures such as the State-Trait Anxiety Inventory (STAI) (e.g., Spielberger, Gorsuch, & Lushene, 1970; Spielberger, Jacobs, Russell, & Crane, 1983; Spielberger, 1972). The STAI measures trait and state anxiety by asking participants to report their experience of anxiety generally (trait) and currently (state). In one of the earliest studies using STAI, Gaudry and colleagues (Gaudry, Vagg, & Spielberger, 1975) measured trait anxiety at one time point and state anxiety once in each of three situations deemed to possess varying degrees of inherent stressfulness. Exploratory factor analysis (EFA) suggested that items representing trait anxiety comprised a distinct factor, that those representing state anxiety during each of the three situations represented three distinct factors, and that the trait factor was moderately related to each situation-specific state factor. Similarly, Deffenbacher and colleagues’ (Deffenbacher et al., 1996) adaptation of state-trait theory to anger found support for increased state anger, anger expression, physiological reactivity to anger, and daily diary anger reports in participants high on self-reported trait anger. However, the use of factor analysis of cross-sectional retrospective trait data to differentiate states from traits is limited, in that it only provides estimates of the degree of correspondence between how individuals perceive themselves generally and how they feel in a single moment or across different situations (Gaudry, et al., 1975).
1.2 Assessing states and traits: then and now
The use of daily retrospective reports and self-report questionnaires for the differential assessment of trait and state anxiety has been limited for several reasons. Across a number of studies (e.g., Barnes, Harp, & Jung, 2002), trait anxiety has been shown to be significantly higher among individuals assessed in high stress contexts (e.g., mothers of hospitalized children, students giving a speech) versus low stress contexts (e.g., students in a classroom, participants completing a mailed survey). Thus, an individual’s level of state anxiety may influence their responses to measures of trait anxiety (Gorin & Stone, 2001). In addition, trait anxiety questionnaires, like other trait affect measures, may capture other types of negative affect such as depression (e.g., Caci, Bayle, Dossios, Robert, & Boyer, 2003). Thus, retrospective questionnaire-based conclusions about trait and state components of anxiety may not be conclusive.
Similarly, research regarding the distinction between trait and state anger has been hampered by a reliance on retrospective self-report questionnaire measures, with most researchers using the Cook-Medley Hostility Scale (Cook & Medley, 1954), State-Trait Anger Scale (Spielberger, 1988), and Novaco Anger Scales (Eckhardt, Norlander, & Deffenbacher, 2004). Similar to studies of questionnaire measures of anxiety, several studies have shown the psychometric and theoretical limitations of these and related questionnaire measures (Barefoot, Dodge, Peterson, Dahlstrom, & Williams, 1989; Biaggio, 1980; Eckhardt, Barbour, & Stuart, 1997; Kneip et al., 1993; Miller, Smith, Turner, Guijarro, & Hallet, 1996; Smith, 1992). This evidence points to the need for alternative methods of assessment.
EMA represents one approach in which anxiety and anger as state and trait may effectively be measured across a wide range of situations/environments. Indeed, one of the few studies to report EMA data on anxiety found that categorizing participants based on EMA data was superior to categorizing participants based on questionnaire-based trait measures in the prediction of actual behaviors such as nicotine use (Henker, Whalen, Jamner, & Delfino, 2002). No studies however, have evaluated the correspondence between EMA-based and self-report questionnaire measures of trait anxiety or anger. Further, and most importantly, most studies have estimated trait-like stability in EMA assessments over fairly short periods. No study has estimated the trait-like stability of affective states over the course of 6 months.
1.4 Present study
In the present study, we fit a multilevel trait-state-error structural equation model to EMA reports of anxiety and anger collected during two 24-hour periods separated by 6 months to estimate the proportion of variance in the momentary experience of these two affects that could be attributed to stable trait-like individual differences versus state-like situational factors. Further, we estimate the degree of correspondence between the trait components of EMA-assessed anxiety and anger, and established retrospective self-report questionnaire measures of those traits. Finally, we conduct sensitivity analyses to assess the robustness of our estimates to missing data and very long-term (>10 months) follow up periods. The authors had diverse expectations as to what proportion of the total variance of momentary reports of anxiety and anger would be trait-like variance (i.e., between-person variance); of course, to the extent that the proportion of between-person variation approached 100% the construct (anxiety or anger) would exemplify a prototypical trait while to the extent that it approached 0% the construct would exemplify a prototypical state. Efforts to integrate the state concept into classic personality trait theory [e.g. Buss and Cantor’s (1989) “middle level personality units” or McAdams & Pals’ (2006) “characteristic adaptations”] have endorsed the similar notion that personality constructs vary in the extent to which they operate through these adaptations or middle-level units and thus the extent to which they will exhibit more between- or within-person variance.
2. Method
2.1 Participants
The present study uses data from the multi-site Masked Hypertension Study, an investigation of the prevalence and cardiovascular sequelae of individuals having higher blood pressure during normal everyday activities than they do in the clinic setting. Employees of Stony Brook University, Stony Brook Hospital, the Long Island State Veterans Home, and a private financial organization were recruited through department-specific workplace blood pressure screenings. Eligibility for the study was restricted to employees (at least 17.5 hours/week), aged 18 or older, with no history of overt cardiovascular disease and who were not taking medications known to affect blood pressure. Between March 2005 and September 2012, 780 eligible participants enrolled in the study, of which 697 completed the 24-hour ABPM/EMA assessment. Each consecutive cohort of 5 enrolled individuals was randomly ordered, and individuals were successively approached until someone agreed to participate in a substudy that included a second 24 hours of EMA data collection several months later. The present analyses are restricted to the 165 participants who provided EMA data for two 24-hour periods. The mean age was 47 ± 9 years (range 23–81), 15.8% identified as members of racial/ethnic minority groups (including 7.3% Hispanic, 6.1% African-American and 1.2% Native American), and 90.3% had more than a high school education, including 45.4% with 4 or more years of college.
2.2 Materials
Questionnaire battery
As part of a questionnaire battery completed by participants, trait anxiety was assessed with the 20-item Trait Anxiety Inventory (TAI Form X; Spielberger, et al., 1970). TAI items each describe an experience or symptom of anxiety. On a scale of 1 (”not at all”) to 4 (”very much so”), respondents indicate the degree to which they generally have this experience or symptom. The test-retest correlation for the TAI ranges from 0.73 to 0.86 (Spielberger, et al., 1970). Internal consistency as indexed by Cronbach’s alpha is greater than 0.90 for standardization subsamples (Novy, Nelson, Goodwin, & Rowzee, 1993), and was 0.87 in the present sample.
Trait anger and hostility (hereafter: anger/hostility)1 was assessed with a modified 20-item version of the Cook-Medley Hostility Scale (Ho Scale; Cook & Medley, 1954) derived from 3 subscales described by Barefoot et al (1989). This version includes a 6-item Cynicism subscale, 5-item Hostile Affect subscale, and 9-item Aggressive Responding subscale, as these three subscales are better predictors of cardiovascular health outcomes than the complete 50-item scale (Barefoot, et al., 1989). Participants used a “True/False” response option to answer Cook-Medley items such as “I have at times had to be rough with people who were rude or annoying” (Aggressive Responding), “I am not easily angered” (Hostile Affect; reverse-scored), and “I think most people would lie to get ahead” (Cynicism). Scores on the total Cook-Medley are stable over time, with test-retest correlations greater than 0.80 (Barefoot, Dahlstrom, & Williams, 1983; Shekelle, Gale, Ostfeld, & Paul, 1983). In the current study, internal consistency, as assessed by the Kuder-Richardson 20 statistic, for the Cynicism, Hostile Affect, and Aggressive Responding subscales was 0.73, 0.44, and 0.51, respectively. Internal consistency of the total score, derived from all 20 items, was 0.74 in this study.
2.3 Ecological momentary assessment (EMA) of anxiety and anger
On a pre-programmed electronic diary (Palm Pilot Tungsten 3), participants answered a series of questions regarding their activities and affect every 25–30 minutes (immediately after each blood pressure measurement taken while awake) over two 24-hour periods separated by several months. These questions were worded so that participants responded with regard to their immediate situation and affective state. Participants rated their affect on a 2.5” horizontal visual analog scale (VAS) with anchors of “not at all” and “very much.” The two affective items (of 8) that were used in this analysis were “Just before [your] BP [was taken], how anxious/tense were you feeling?” and “Just before BP, how angry/hostile were you feeling?” The inclusion of these and the other affect items in the EMA diary was informed by Russell’s (1980) circumplex model of affect. Such items are typically included in EMA studies of smoking and mood (work of Shiffman and colleagues [Shiffman, 2009]) and ambulatory blood pressure studies in behavioral medicine (Schwartz, Warren & Pickering, 1994; Stone, Smythe, Pickering & Schwartz, 1996; Shapiro, Jamner, Goldstein & Delfino, 2001; Pollard and Schwartz, 2003), the latter consistently demonstrating a within-person association between assessment-to-assessment fluctuations in mood and blood pressure.
2.4 Procedure
Participants completed the psychosocial questionnaire battery at home, and made entries in the electronic diary approximately twice/hour (while awake) while wearing an ambulatory blood pressure monitor (ABPM) over 24 hours. All participants were given the psychosocial questionnaire during their first visit to the clinic and nearly all returned it prior to the day of blood pressure monitoring and EMA. Participants returned the ABPM and electronic diary at the end of the 24-hour monitoring period. Those who were invited and agreed to participate in the substudy then repeated the 24-hour blood pressure monitoring with EMA. The median duration between assessments was 6.5 months (interquartile range 5.0 to 8.6, range 2.1 to 28.5).
2.5 Analytic strategy
The three questions examined in the present work were: (1) To what extent are EMA reports of anxiety/tenseness and anger/hostility trait- and/or state-like over an extended period?, (2) What is the relation between the trait-like portion of participants’ EMA ratings of anxiety/tenseness and anger/hostility and traditional questionnaire-based trait measures of these constructs?, and (3) What is the test-retest correlation of the 24-hr averages of EMA anxiety/tenseness or anger/hostility performed several months apart? Although these questions are conceptually distinct, they were addressed by estimating a single multilevel structural equation model (SEM; see Figure 1) for each EMA/questionnaire affect pair (e.g., EMA anxious/tense and Trait Anxiety Inventory). The EMA portion of the model is an extension of Kenny and Zautra’s trait-state-error (TSE) model for multiwave data (Kenny & Zautra, 1995). The estimates of this SEM partition the total variance of EMA reports of anxiety/tenseness and anger/hostility into stable (across days) between-person variance (trait-like individual differences in mean levels of anxiety/tenseness and anger/hostility), day-specific between-person variance (the extent to which each participant was having a better- or worse-than-normal day), and within-person, within-day variance (fluctuations in momentary anxiety/tenseness and anger/hostility around each individual’s mean scores). The within-person (and within-day) variance is further decomposed into “reliable”, serially correlated state variance (a la Kenny & Zautra) and uncorrelated residual variance that Kenny & Zautra attribute to random measurement error, but which may also include serially uncorrelated state variance.2 The first component conforms to the expected pattern wherein two momentary reports from the same individual obtained nearer in time will tend to be more similar than two assessments taken further apart in time, whereas the second allows for random measurement error and/or random situational factors in the momentary responses which, by definition, should not be autocorrelated (Schwartz & Stone, 2007). This within-person portion of the SEM corresponds to a “quasi-simplex” or modified first-order autoregressive model (Jöreskog, 1970).3 For the sake of exposition, we will initially treat the second component as entirely attributable to measurement error, but will revisit this assumption in the Discussion.
If a sizable proportion of the total variance of a momentary measure is attributable to stable individual differences (EMA Trait in Figure 1), we will conclude that there is a substantial trait component to the construct. If only a small proportion of the variance in momentary reports of these constructs is attributable to stable individual differences, we will conclude that these two affects are predominantly determined by day-to-day variability or situational factors.
To address the second question, we examine the correlation (ρ1 in Figure 1) between each trait questionnaire measure and the EMA Trait latent variable representing stable individual differences in average levels of the corresponding momentary assessments. The test-retest correlation between the latent variables representing the two true 24-hour mean levels of the construct equals (ρ2)2 (Figure 1) and provides an estimate of the reliability of a single day of EMA reports for assessing the stable trait.
The unstandardized version of the SEM shown in Figure 1 is estimated using the PROC MIXED procedure in SAS. Of note, by specifying a “spatial power” error structure for the within-day fluctuations of diary reports, the first-order autoregressive portion of the model makes the appropriate adjustment for differences in the time intervals between assessments; by measuring time in 30-minute units, the parameter λ corresponds to the correlation of the state component of pairs of assessments obtained 30 minutes apart. Thus, for each trait measure/EMA pair, we generated full-information maximum likelihood (FIML) estimates of 1) the stable between-person variance, 2) the day-to-day variance of 24-hour mean levels, 3) the within-person, within-day state variance of the momentary assessments (exhibiting first-order autocorrelation), 4) the remaining random within-person, within-day variance (measurement error), 5) the variance of the corresponding trait questionnaire measure, and 6) the covariance of the stable between-person component of the momentary assessments with the corresponding trait measure. The correlation between the trait questionnaire measure and the stable between-person (trait-like) component of the momentary assessments was then calculated as the ratio of the covariance to the square root of the product of the two respective variances. (Appendix I contains the SAS syntax and key results, along with a summary of how the results are used to calculate the model parameters.)
We have argued elsewhere (Schwartz, Neale, Marco, Shiffman, & Stone, 1999) that this approach for estimating the relationship between the trait questionnaire measure and the trait-like component of momentary assessments is preferable to the simpler strategy of aggregating momentary assessments to the individual level and then computing the correlation between the trait measure and the mean of individuals’ momentary assessments. This is because the former approach corrects for the anticipated attenuation of the correlation that would be caused by the random sampling variation of an individual’s momentary assessments, the magnitude of which depends on (1) the variance of the within-person fluctuations in mood, (2) the number of momentary assessments an individual completes and (3) the magnitude of the serial autocorrelation of the within-person fluctuations in mood. In practice, however, with an average of approximately 30 EMA assessments for each 24-hour period, the difference between the two approaches is relatively small; this will be illustrated by presenting the Pearson correlation between the mean of all EMA reports and the trait questionnaire measure.
There was a strong correlation between participants’ mean response and the variability of their responses for both anxiety/tenseness and anger/hostility (see Figure 2); this heteroscedasticity was minimized by applying a cube root transformation to the EMA reports. Therefore, except for descriptive statistics, all reported analyses are based on the cube root of the EMA measures. Sensitivity analyses (not reported) demonstrate that the results are only slightly affected by this transformation.
Figure 2.
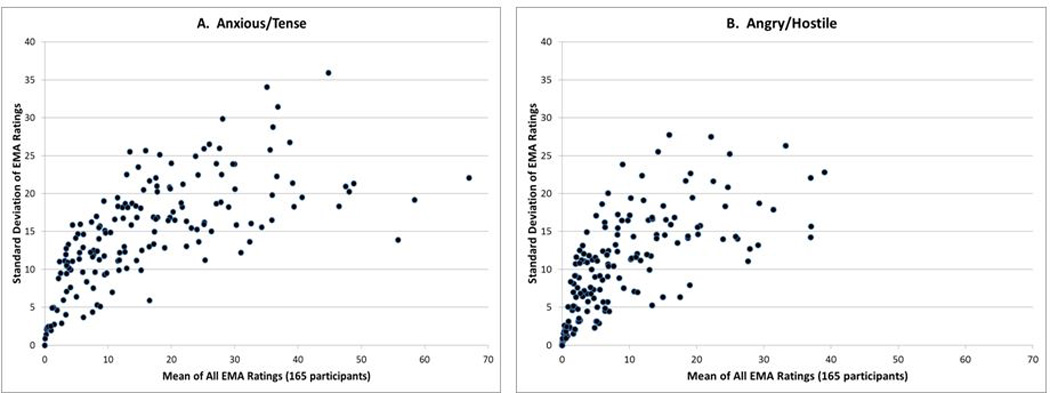
Scatterplots of the positive association of the within-person standard deviation of the untransformed EMA measures with the within-person average, N=165
3. Results
3.1 EMA reports of anxiety/tenseness and anger/hostility
The 165 participants provided a total of 4849 EMA reports during the first 24-hour monitoring period, a median of 30 reports per participant, and 4650 EMA reports during the second monitoring period (median = 29). Compliance was calculated as the number of EMA reports divided by the expected number given the total awake time during the monitoring period. The median compliance rate was 83.9% for the first day and 79.8% for the second day of monitoring; 82.4% and 77.0% of participants were at least 70% compliant during the two monitoring periods. Because mixed models appropriately weight those with fewer observations, we did not exclude those with poor compliance or few EMA reports (under the assumption that the "missing" diary entries are missing at random). However, in sensitivity analyses, we repeated all analyses after excluding those whose compliance was less than 70% during either monitoring period (N=48). We also repeated the analyses excluding those (N=29) whose second monitoring period was more than 10 months after the first. During the first day of monitoring, the mean anxiety/tenseness score in the sample was 15.3 on the 0–100 scale, and the mean anger/hostility score was 8.1; the corresponding means for the second day were 17.4 and 10.1. Table 1 provides additional summary statistics for the EMA and trait questionnaire data.
Table 1.
Summary of Data
| First 24 hours | Second 24 hours | |||
|---|---|---|---|---|
| Visit-level measures | Mean (SD) | Median (lq, uq) | Mean (SD) | Median (lq, uq) |
| N of EMA reports | 29.4 (5.6) | 30 (26, 33) | 28.2 (5.7) | 29 (25, 33) |
| EMA compliance, percent | 80.7 (14.6) | 83.9 (75.8, 90.9) | 78.2 (14.6) | 79.8 (71.1, 89.4) |
| Anxious/Tense (100-pt VAS) | ||||
| Individual reports | 15.3 (20.2) | 6 (0, 22) | 17.4 (20.8) | 9 (0, 27) |
| Person means | 15.7 (13.3) | 11.8 (6.1, 22.1) | 17.8 (14.9) | 12.9 (5.9, 26.4) |
| Person standard deviation | 13.7 (7.9) | 14.1 (7.1, 19.6) | 13.6 (7.7) | 13.3 (7.7, 18.6) |
| Angry/Hostile (100-pt VAS) | ||||
| Individual reports | 8.1 (13.8) | 2 (0, 9) | 10.1 (15.5) | 3 (0, 12) |
| Person means | 8.4 (8.4) | 5.5 (1.9, 12.6) | 10.3 (10.8) | 6.4 (1.7, 14.4) |
| Person standard deviation | 8.9 (7.1) | 8.0 (2.9, 13.6) | 9.3 (7.5) | 7.9 (2.5, 15.5) |
| Person-level measures | Mean (SD) | Median (lq, uq) | ||
| Months between two assessments | 7.5 (4.1) | 6.5 (5.0, 8.6) | ||
| Spielberger Trait Anxiety Score | 19.3 (6.7) | 19 (15, 23) | ||
| Cook-Medley | ||||
| Cynical Aggression | 2.5 (1.9) | 2 (1, 4) | ||
| Hostile Affect | 1.9 (1.3) | 2 (1, 3) | ||
| Hostile Aggression | 3.2 (1.8) | 3 (2, 4) | ||
| Total Score | 7.6 (3.7) | 7 (5, 10) | ||
N=165 participants who performed ambulatory blood pressure monitoring with electronic EMA monitoring for two 24-hour periods. EMA reports were completed after each blood pressure reading, which were programmed to occur at 28-minute intervals.
SD=standard deviation, lq=lower quartile, uq=upper quartile
3.2 How trait-like are anxiety/tenseness and anger/hostility?
Figure 3 presents 1 day of EMA anxiety/tenseness data for two subjects who differ on their level of anxiety. This figure illustrates both the within-person variability and between-person differences that form the basis for the analyses reported here. Table 2 summarizes the results and Figures 4a and 4b present the path diagrams for the analyses of anxious/tense with the Spielberger Trait Anxiety Instrument and angry/hostile with the Cook-Medley 20-item total hostility score. The estimated reliability of a single EMA report of anxiety/tenseness was 0.73; it was 0.74 for anger/hostility. With 90% or more participants making at least 20 reports during the 24-hour monitoring period, individuals’ average levels for the day will be very reliably estimated. For anxiety/tenseness, 56% of the total reliable variability in momentary assessments was due to stable trait-like differences between individuals. For anger/hostility, 58% of the total reliable variability in momentary assessments was due to stable trait-like differences between individuals. Table 2 shows that only a small amount of the momentary variance in EMA reports is due to day-to-day differences in average level of anxiety or anger (i.e., the extent to which people have good days versus bad days); as a result, the test-retest correlation for the latent variables representing the mean levels of affect on the two days of monitoring are correlated 0.90 for anxious/tense and 0.83 for angry/hostile.4 For anxiety/tenseness, 38% of the reliable momentary variance is situation-specific (i.e., state variance), and the estimate is that the correlation between the extent to which someone’s affect at one moment is above (or below) her average for the day is correlated 0.83 (the estimate of γ) with what it will be 30 minutes later. For anger/hostility, 30% of the reliable momentary variance is attributable to situational factors and the 30-minute autocorrelation is 0.78.
Figure 3.
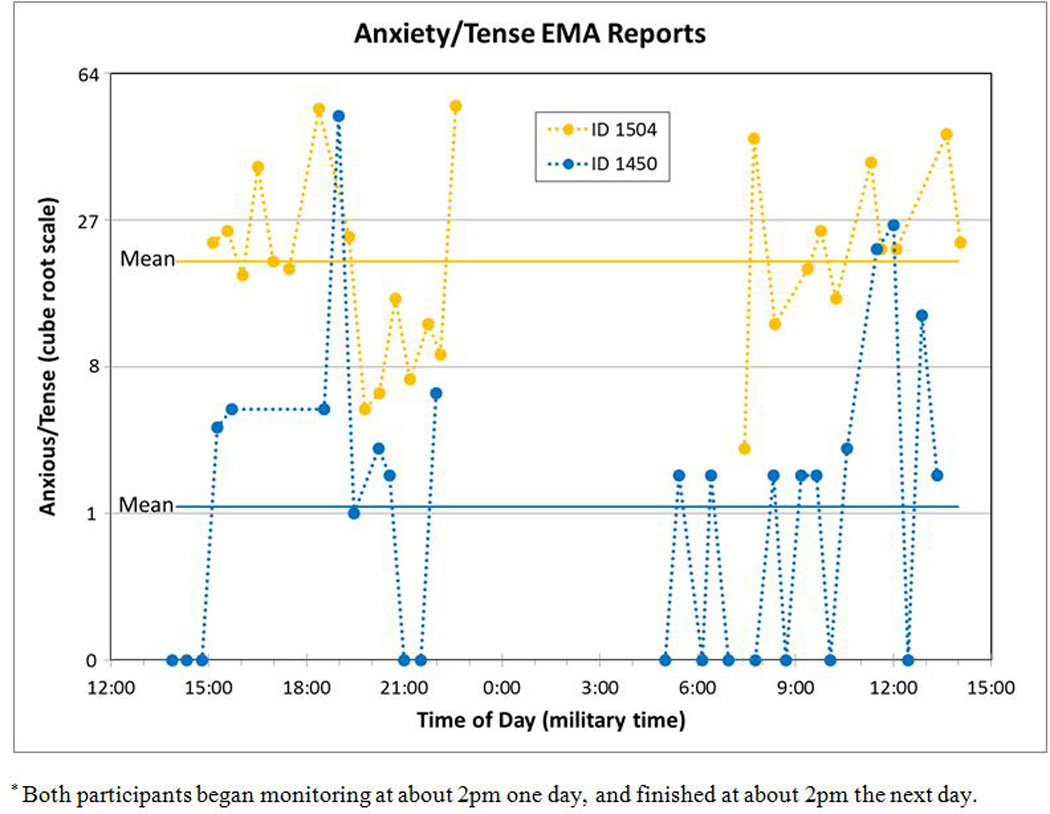
24-hour anxious/tense ecological momentary assessment (EMA) reports of two Participants*
Table 2.
Model Estimates
| EMA affect item (100-pt VAS) | Anxious/Tense | Angry/Hostile |
|---|---|---|
| Trait questionnaire scale | Spielberger Trait Anxiety | Cook-Medley Total Hostility |
| EMA Trait variance | 0.49 | 0.37 |
| EMA Day-to-day variance | 0.05 | 0.07 |
| EMA State variance | 0.34 | 0.19 |
| 30-min autocorrelation (λ) | 0.83 | 0.78 |
| EMA Measurement error variance | 0.33 | 0.23 |
| Trait questionnaire variance | 44.55 | 13.69 |
| Covariance(EMA Trait, Trait questionnaire) | 1.17 | 0.49 |
| Calculated estimates | ||
| Total EMA variance | 1.21 | 0.86 |
| Total reliable EMA variance | 0.88 | 0.63 |
| Reliability of individual EMA reports | 0.73 | 0.74 |
| EMA Trait variance (% of reliable variance) | 55.7% | 57.9% |
| EMA State variance (% of reliable variance) | 38.4% | 30.3% |
| Correl (EMA Trait, Trait questionnaire), ρ1 | 0.25 | 0.22 |
| ρ2 | 0.95 | 0.91 |
| ρ3 | 0.31 | 0.41 |
| ρ4 | 0.78 | 0.83 |
| ρ5 | 0.62 | 0.55 |
| ρ6 | 0.85 | 0.86 |
| Test-retest correlation of 24-hr average EMA [=(ρ2)2] | 0.90 | 0.83 |
N=165 participants who performed ambulatory blood pressure monitoring with electronic EMA monitoring for two 24-hour periods. EMA reports were completed after each blood pressure reading, which were programmed to occur at 28-minute intervals
Figure 4.
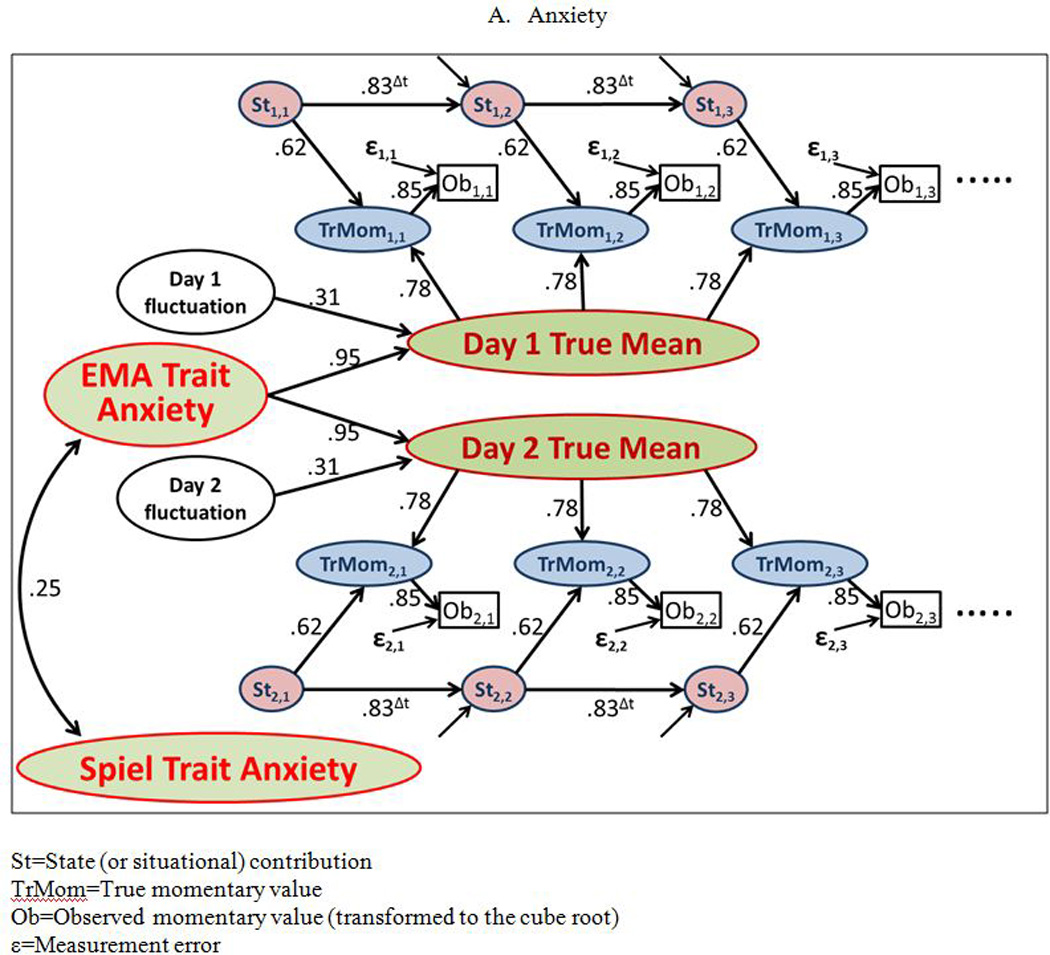
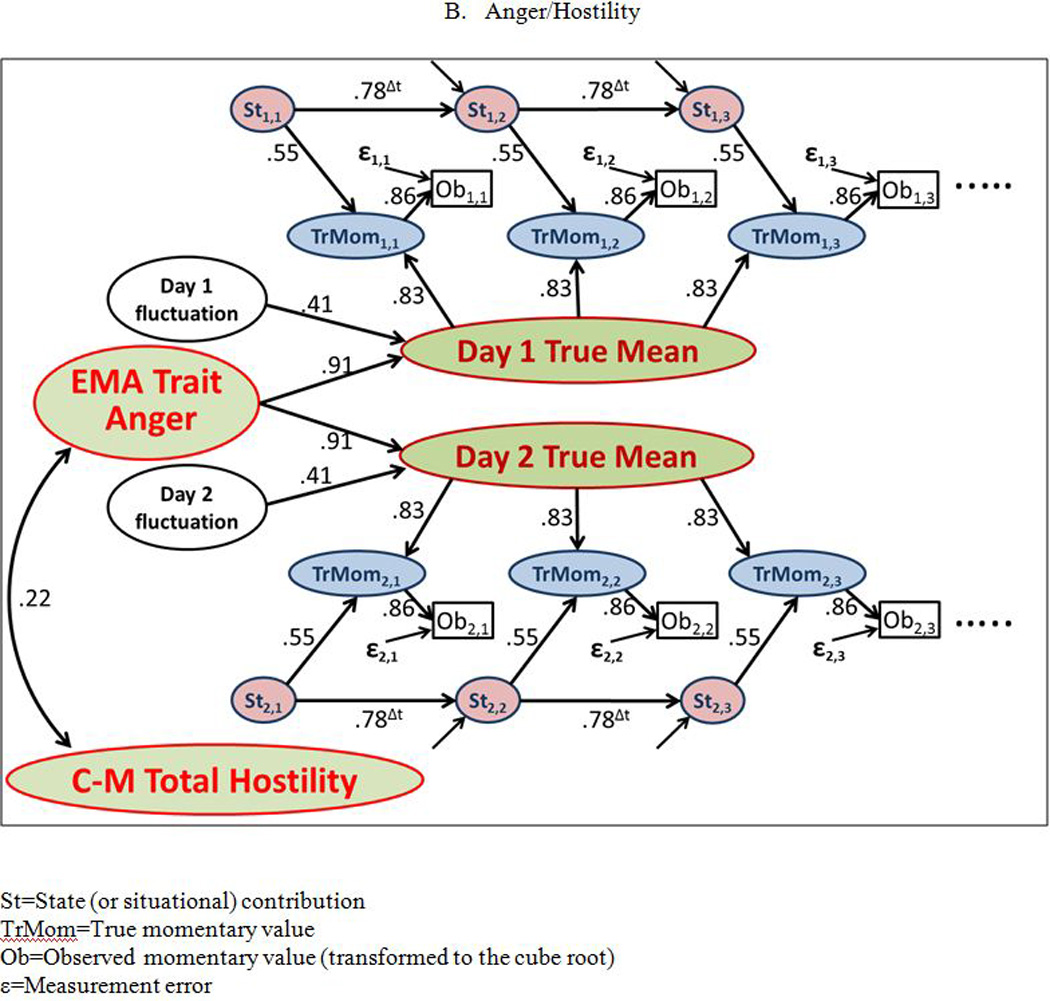
Path diagrams of the trait-state-error model of momentary anxiety and anger assessed during two 24-hour periods, and the correlations of their stable EMA trait components with traditional trait questionnaires
Figure 5 shows four variograms, portraying the implications of the estimated first-order serial autocorrelation for EMA reports of anxiety/tension. The solid blue line corresponds to the projected within-person pattern of autocorrelation; that is, the anticipated autocorrelation of the fluctuations in people’s reported affect around their mean affect for the day. The fact that it intersects the Y-axis at approximately 0.50 indicates that the estimated state variance is nearly the same as the estimated measurement error variance. The anticipated correlation of these fluctuations decreases to less than 0.10 after about four hours. The dotted blue line portrays the projected within-person pattern of autocorrelation if there were no measurement error. This line intersects the Y-axis at 1.0, indicating perfect agreement between two reports made at the same instant. Both blue lines approach a correlation of 0 for the within-person association between reports made more than 10 hours apart. The solid red line shows the projected pattern of autocorrelation for the raw momentary data, which includes the stable trait component, the daily component, and the state component of anxiety/tenseness. This line intersects the Y-axis at 0.73, corresponding to the overall reliability of the momentary reports. The dotted red line portrays the projected pattern of autocorrelation for the raw momentary data if there were no measurement error. In the absence of measurement error, reports would be perfectly reliable (reflected in the fact that this line also intersects the Y-axis at 1.0), and reports obtained many hours apart on the same day from the same person would still exhibit a correlation of about 0.62 (due to the fact that they share the same EMA trait component and daily component).
Figure 5.
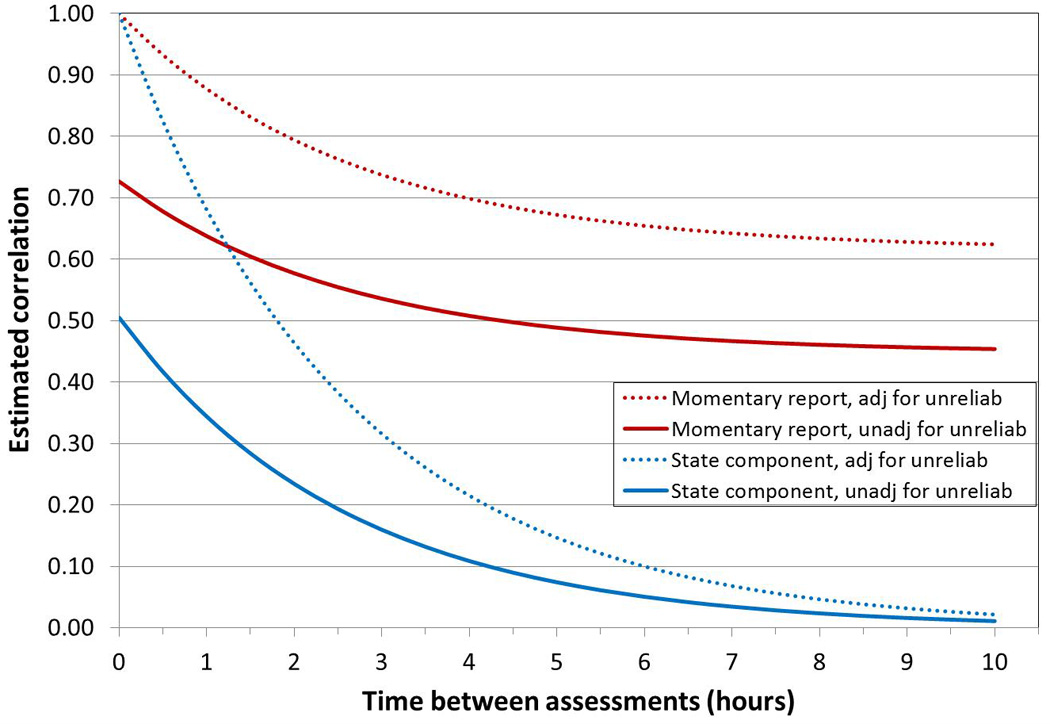
Variograms portraying the dependence of the autocorrelation between two momentary reports from the same person on the time interval between the reports, before and after adjusting for measurement error. The “state component” curves present the same information after subtracting each person’s average score for the monitoring period from their momentary reports.
3.3 Correspondence between EMA and standard questionnaires
Table 2 also shows the estimated correlations between questionnaires that assess trait anxiety and anger, and the stable EMA trait components of the corresponding EMA measures. The correlation between the Spielberger Trait Anxiety Inventory and the stable EMA trait component of anxiety/tenseness is 0.25. The correlation between the Cook-Medley 20-item total hostility score and the stable EMA trait component of anger/hostility is 0.22. We re-ran the anger analyses to estimate the correlation of the EMA trait component with the three subscales of the Cook-Medley instrument and these ranged from 0.09 to 0.22. While the stable EMA trait components are latent variables, corrected for unreliability, the trait questionnaires are not. If we adjust the above correlations for attenuation due to unreliability of the trait questionnaires, using Cronbach’s alpha as the estimate of each scale’s reliability, the correlation for anxiety increases from 0.25 to 0.27 and the correlation of anger/hostility with the Cook-Medley total hostility score increases from 0.22 to 0.25.
Although we are fond of the model used in this analysis, one might ask “What happens if you simply average all the momentary EMA reports, over both monitoring periods, for each participant (an average of 58 reports/person) and correlate these with the trait questionnaire scores?” When we do this, the correlation of the Spielberger Trait Anxiety Inventory with the empirical average of all momentary ratings of anxious/tense feelings is 0.23, and the correlation of the Cook-Medley 20-item total hostility score with the empirical average of all momentary ratings of angry/hostile feelings is 0.20. Although we expect these empirical correlations to be somewhat less than the model estimates, the differences are quite small, due to the large number of ratings provided by participants (range 25 to 78).
3.4 Sensitivity analyses
We repeated the analyses reported in Table 2 after excluding the 48 participants who had less than 70% of the expected number of EMA reports during either the first or second 24-hour monitoring period. The changes in the parameter estimates pertaining exclusively to the EMA data were all quite small. However, the correlation of the stable EMA trait with the trait questionnaire increased from 0.25 to 0.30 for anxiety and from 0.22 to 0.25 for anger.
We also repeated the analyses after excluding the 29 participants for whom the interval between the two monitoring period was greater than 10 months. We anticipated that this might result in higher test-retest correlations between the latent variables representing the mean affect of the two monitoring periods; the correlations for anxiety and for anger each increased by a modest 0.02. All other changes were negligible.
We also tested whether some of the assumptions built into our highly constrained structural equation model (Figure 1) needed to be relaxed. We investigated 1) whether the trait questionnaire might be more highly correlated with the first EMA monitoring period than with the second (because the questionnaire was completed nearer the time of the former); 2) whether the amount of state variance and/or the autocorrelation parameter might differ between the two monitoring periods; and 3) whether the day-specific variance might be greater for one period than the other. Using the BIC criterion, there was no evidence that any of the equality constraints built into the model of anxiety needed to be relaxed. For the anger model, there was some evidence (BIC decreased by 3.6) that the day-specific variance was greater for the second monitoring period than the first; when this difference was incorporated into the model, the correlation between the Cook-Medley total hostility score and the EMA trait increased from 0.22 to 0.23. In summary, the results reported above do not appear to be sensitive to a variety of assumptions built into the model.
4. Discussion
The results of the research reported here provide support for the traditional view that anxiety and anger exhibit variation that has both trait and state components. In addition, there is a relatively small component of day-to-day variation in average levels of anxiety and anger, such that the mean levels of both anxiety and anger for one day correlate highly (r = 0.90 and .83, respectively) with the corresponding mean levels on another day several months later. These findings are in line with expectations, given recent work on the importance of person and situation factors, and their interaction, on momentary behavior (e.g., Fleeson, 2004). An unexpected finding is that the trait components of anxiety and anger estimated from EMA data were only modestly correlated with the corresponding questionnaire measures of those traits.
The findings that momentary reports of anxiety and anger, which have always been viewed as resulting from substantial situational influence, have a large stable trait component is of considerable theoretical importance. This finding challenges those of earlier studies (e.g. Sarason, Smith, & Diener, 1975), which concluded that situations account for substantially more behavioral variance than individual differences. Indeed, our findings differ from the earlier work of Endler and colleagues on anxiety (Endler & Hunt, 1969; Endler, Hunt, & Rosenstein, 1962) and anger (Endler & Hunt, 1968), which found that trait variance plays a minor role in people’s anxious and angry feelings. Had we included constructs in this study such as extraversion or conscientiousness that are viewed as being largely (rather than only partially) trait-like, the proportion of between-person variance would probably have been even greater than that reported here for anxiety and anger. Future studies should include constructs that represent a range of expected trait and state-like influences on behavior to evaluate this conjecture.
The fact that only a small proportion of the variance in momentary reports of anxiety and anger is attributable to day-to-day variance in 24-hour average levels is noteworthy for two reasons. First, it means that the extent to which people sometimes have good days and other times have bad days contributes only modestly to the overall variability of momentary reports of their anxiety or anger. Second, it implies that the average rating of anxiety or anger from a single day of extensive monitoring provides a relatively reliable estimate of the individual’s trait level of that affect. Stated differently, the individual differences that exist in average levels of anxiety and anger are quite well captured by a single 24-hour period of monitoring. To be conservative, these conclusions may only apply to people’s affect on weekdays (workdays). There is a literature on weekday/weekend differences (e.g., Ryan, Bernstein, & Brown, 2010), and the fact that weekends were excluded from this study eliminated an important source of state variability. The consistency of individual differences in average affect from one workday to another may not generalize to comparisons between a workday and a non-workday.
The interpretation of our estimates of the stable trait-like component of EMA reports of anxiety and anger should be supplemented by an understanding of the analytic methods by which they were derived. Although the use of EMA methodology reduces at least one source of unreliability (memory distortion/recall bias), other measurement issues may have inflated the magnitude of trait component or deflated the magnitude of the state component. First, to the extent that person-specific response biases to the EMA scales are operating—that is, that individuals are systematically over- or under-reporting their momentary experience of anxiety/tension or anger/hostility across assessments—these biases would serve to inflate the estimates of trait-like variance. For instance, individuals may vary in their ability to recognize and report on these affects, may be differentially susceptible to the influence of social desirability on their willingness to report these affects, or may differentially anchor their later reports to earlier reports. They may have also varied in the way that they used the VAS scale to report their momentary affect. Such response bias influences on questionnaire measures, however, were widely studied in the 1960s and 70s, and the general conclusion was that response bias influences were far smaller than the influences of the item content (Rorer, 1965). This conclusion has recently been reaffirmed (McGrath, Mitchell, Kim, & Hough, 2010), and is likely true for EMA responses as well. Similarly, systematic (stable) differences in situations/environments across individuals, which surely exist, will also inflate the estimate of trait-like variance. As noted above, both assessment periods were done on weekdays (i.e., workdays); it is likely that if we had included a weekend (non-work) day, we would have found less stable trait variance and more day-to-day variance in 24-hour mean levels of affect.
Secondly, consistent with the Kenny and Zautra trait-state-error model, we treated all of the within-person variance that does not exhibit autocorrelation as measurement error. However, it is possible, perhaps even likely, that there are situational factors that influence affect and vary on a time scale that is much shorter than 25–30 minutes. If these factors only have an acute effect on affect and their 30-minute serial autocorrelation is approximately zero, then their effect on the present EMA data will be indistinguishable from measurement error.5 Thus, some (probably small) portion of what we have labeled as measurement error may in fact be acute-acting state variance.
4.1 The disconnect between questionnaires and EMA for assessing traits
A somewhat unexpected finding from this study is that stable individual differences derived from a person’s responses on numerous occasions, and in a variety of contexts over the course of two days many months apart, were poorly correlated with scores derived from standard trait questionnaires; these weak associations were not limited to anxiety and anger in our data.6 This low degree of correspondence (r ≤ 0.25) perhaps reflects that the single EMA questions did not include the broad content domain of these constructs featured in traditional questionnaires. On the other hand, recent research suggests that brief (e.g., single item) measures correlate well with multi-item scales of the same construct (Yarkoni, 2010). Thus, the lack of correspondence between these two strategies of assessing traits is still of concern.
Although other studies have found low to moderate correlations between trait questionnaires and EMA data (e.g., Schwartz et al, 1999; Shiffman, Stone, & Hufford, 2008; Solhan, Trull, Jahng, & Wood, 2009), a few issues in our study may partially explain some of the discrepancy between the two measurement strategies. First, in our EMA protocol, we asked participants to report every 25–30 minutes on a VAS how anxious/tense and angry/hostile they were in the moments immediately prior. By coupling these terms, we may have inadvertently attenuated the relations we would have observed between EMA reports and the conceptually “purer” assessment of the separate constructs of anger and hostility by their corresponding questionnaires. Second, although we believe that the three subscales of the Cook-Medley that we used adequately measured trait anger, it might have been preferable to measure trait anger with a questionnaire that more comprehensively measures one’s perception of the frequency and intensity with which they experience anger (e.g., the Trait Anger Scale; Spielberger, 1988).
4.2 Future research and implications for personality assessment
The results reported above should be replicated on a broader and more representative sample of constructs. Future studies should further consider longer durations, more heterogeneity in situational contexts (e.g., by including weekend along with weekday sampling), and more nuanced measurements of the multiple behavioral and cognitive indicators of anxiety and anger. In particular, constructs such as dominance and dependability that are viewed as having strong trait-like properties may well exhibit much greater correspondence between their EMA and questionnaire based measures. Second, although our bias is to view the EMA assessments more favorably than questionnaire measures (e.g., less subject to recall bias and social desirability effects), we could be mistaken. At least one limitation of these measures is their limited coverage of the construct domains. Ultimately, future research must address the validity of questionnaire and EMA-based trait measures for the prediction and understanding of important outcomes. Only if the EMA measures outperform questionnaires in these contexts will our position be justified. To our knowledge only one such comparison exists in the current literature. Specifically, Henker and colleagues (Henker, et al., 2002) showed that EMA based measures of anxiety predicted adolescent smoking better than a trait anxiety questionnaire. Clearly, replication and extension of this work is needed.
In addition to establishing the criterion validity of EMA and questionnaire measures, it may also prove worthwhile to further explore the discrepancies between these methods. We have previously argued that aspects of personality and self-image may color the data that people provide when completing some measures of dispositions (Schwartz, et al., 1999), and we believe that this is likely the case for anxiety and anger as well. To the extent that a person’s standing on a criterion variable is better predicted by how they view themselves rather than how they actually behave, autobiographical reports may prove to be better predictors.
EMA assesses the experience of affect as it occurs in real time. As such, the EMA approach accomplishes the goal of the act-frequency approach to personality assessment (Block, 1989). Traditional personality questionnaires do not accomplish this goal. Thus, we are inclined to infer that the low correlations we observed between the questionnaire and EMA-derived trait measures is the fault of the questionnaires. If so, the field of personality assessment may want to consider foregoing the efficiencies of questionnaires for the greater validity of EMA assessment. Alternatively, new questionnaires could be designed that ask much more specifically about how a respondent reacts in different situations. The work of Mischel, Shoda and colleagues (Mischel & Shoda, 1995; Shoda, Mischel, & Wright, 1994), in which respondents were asked for reactions conditional on specific situational stimuli, may provide a prototype for the future of personality assessment, although this line of research needs to confront the issue that in the real world, different individuals are exposed to different situations.
4.3 Conclusion
The current findings highlight the importance of considering both situational influences and individual differences in the analysis of human experience, and that people’s 24-hour average levels of anxiety and anger are quite stable over many months. Moreover, these findings show that the trait components of anxiety and anger assessed by EMA share little variance with corresponding questionnaire-based assessments. Further research targeting the replicability, differential predictive validity, and reasons for this discrepancy should be given high priority.
Supplementary Material
Acknowledgments
We are indebted to the study participants and research staff of the Masked Hypertension Study, without whose cooperation and dedication this study would not have been possible. We thank Jerry Suls, Ph.D. for his valuable feedback on an earlier version. This work was supported by grants P01-HL47540 (PI: J Schwartz) and R24-HL076857 (PI: K Davidson) from the National Heart, Lung, and Blood Institute. The research was also supported in part by National Center for Advancing Translational Sciences (formerly the National Center for Research Resources) of the National Institutes of Health, through Grant MO1-RR10710 (Stony Brook University) and Grant UL1-TR000040 (formerly Grant UL1-RR024156, Columbia University). The content is solely the responsibility of the authors and does not necessarily represent the official view of the NIH.
Footnotes
Publisher's Disclaimer: This is a PDF file of an unedited manuscript that has been accepted for publication. As a service to our customers we are providing this early version of the manuscript. The manuscript will undergo copyediting, typesetting, and review of the resulting proof before it is published in its final citable form. Please note that during the production process errors may be discovered which could affect the content, and all legal disclaimers that apply to the journal pertain.
Although models have been proposed in which hostility is independent from anger, empirical support for these models has been lacking. Rather, terms such as anger, hostility, and aggression may serve as convenient, heuristic labels to differentiate between the affective, cognitive, and behavioral components of a single construct (LeDoux, 1994). Indeed, several studies have shown substantial associations between anger and hostility (Spielberger, et al., 1983; Pope, Smith, & Rhodewalt, 1990; Smith & Frohm, 1985), and those circumplex models that include both locate them close together.
Kenny and Zautra used a standard structural equation modeling program (LISREL 7) to estimate their trait-state-error model, but it could also be estimated in EQS, AMOS, or MPlus (as well as other SEM software). Of note, their original model had many fewer observations per person, typically 4–7 waves of data collected at fixed times over months/years; in contrast, we have an average of almost 30 reports per person, at each visit. Nevertheless, their TSE model is essentially identical to the model that we estimate at Time 1, and again at Time 2. We extend this model to include a higher order latent trait factor 1) to account for the stability of the 24-hour means from Time 1 to Times and 2) to relate to the traditional questionnaire score, making this effectively a 3-level model. It would be very difficult to use a structural equation modeling program to estimate our model because 1) there are too many assessments per person and 2) the assessments are not necessarily evenly spaced. As described below, the SP(POW) error structure in SAS’ PROC MIXED handles this first-order auto-correlation model with uneven spacing of observations appropriately, unlike any of the SEM or other MLM software that we are aware of. Except for the uneven spacing of the repeated measures and different number of observations per person, our model is identical to Joreskog’s quasi-simplex model which is, in turn, the Kenny and Zautra TSE model. (Although recent versions of MPlus have the capability of estimating both SEM and MLM, it cannot incorporate the autoregressive within-person component of the TSE model.)
The Kenny and Zautra trait-state-error model and Jöreskog’s quasi-simplex model are extensions of Heise’s (1969) approach for differentiating instability from unreliability in repeat assessments of a single item.
For the sake of comparison, we have computed the mean of the EMA reports for the initial 24-hour assessment period and the mean for the second 24-hour assessment for each participant. These means are imperfect estimates of the latent variables representing the true means for the two 24-hour periods, due both to sampling variability of exactly which moments of the day were being reported on and to measurement error of the individual reports. Therefore, the test-retest correlation between these two sample means is expected to be somewhat lower than the estimated (true) correlations between the corresponding latent variables reported in the text. This is what is observed, with the test-retest correlation of the empirical means being 0.78 for anxiety/tense and 0.76 for anger/hostility (after excluding one subject who had fewer than 10 EMA reports at the second assessment).
In the cardiovascular field, a typical heart rate is 70 beats/minute whereas people typically breathe at a rate of 12–18 breaths/minute. It is thought that one’s blood pressure is slightly affected by where in the breathing cycle one is at the time the heart contracts. From the perspective of ambulatory blood pressure readings taken every 30 minutes, this small, but real, effect of the breathing cycle on each reading (true state variance) will not exhibit any autocorrelation, and will therefore be indistinguishable from measurement error.
The correlation of the Beck Depression Inventory (BDI) score with the average of all EMA responses to the prompt Depressed/Blue (after cube root transformation) across the two 24-hour monitoring periods was 0.29. See online supplementary tables for supplemental descriptive analyses of Depressed/Blue and BDI, and model estimates of state and trait components of EMA Depressed/Blue and the correspondence of EMA trait Depressed/Blue with BDI score.
References
- Allport G. Personality: A psychological interpretation. New York: Holt, Rinehart & Winston; 1937. [Google Scholar]
- Barefoot JC, Dahlstrom WG, Williams RB., Jr Hostility, CHD incidence, and total mortality: A 25-year follow-up study of 255 physicians. Psychosomatic Medicine. 1983;45:59–63. doi: 10.1097/00006842-198303000-00008. [DOI] [PubMed] [Google Scholar]
- Barefoot JC, Dodge KA, Peterson BL, Dahlstrom WG, Williams RB., Jr The Cook-Medley hostility scale: item content and ability to predict survival. Psychosomatic Medicine. 1989;51:46–57. doi: 10.1097/00006842-198901000-00005. [DOI] [PubMed] [Google Scholar]
- Barnes LL, Harp D, Jung WS. Reliability generalization of scores on the Spielberger State-Trait Anxiety Inventory. Educational and Psychological Measurement. 2002;62:603–618. [Google Scholar]
- Bauer DJ. Evaluating individual differences in psychological processes. Current Directions in Psychological Science. 2011;20:115–118. [Google Scholar]
- Bernstein IH, Eveland DC. State vs trait anxiety: A case study in confirmatory factor analysis. Personality and Individual Differences. 1982;3:361–372. [Google Scholar]
- Biaggio MK. Assessment of anger arousal. Journal of Personality Assessment. 1980;44:289–298. doi: 10.1207/s15327752jpa4403_12. [DOI] [PubMed] [Google Scholar]
- Block J. Critique of the act frequency approach to personality. Journal of Personality & Social Psychology. 1989;56:234–245. doi: 10.1037//0022-3514.56.2.234. [DOI] [PubMed] [Google Scholar]
- Caci H, Bayle FJ, Dossios C, Robert P, Boyer P. The Spielberger trait anxiety inventory measures more than anxiety. European Psychiatry. 2003;18:394–400. doi: 10.1016/j.eurpsy.2003.05.003. [DOI] [PubMed] [Google Scholar]
- Chaplin WF. Moderator and mediator models in personality research: A basic introduction. In: Robbins R, Krueger R, Fraley C, editors. Handbook of Personality Research. New York: Guildford; 2007. pp. 602–632. [Google Scholar]
- Chaplin WF, John OP, Goldberg LR. Conceptions of states and traits: Dimensional attributes with ideals as prototypes. Journal of Personality & Social Psychology. 1988;54:541–557. doi: 10.1037//0022-3514.54.4.541. [DOI] [PubMed] [Google Scholar]
- Cook W, Medley D. Proposed hostility and pharisaic-virtue scales for the MMPI. Journal of Applied Psychology. 1954;38:414–418. [Google Scholar]
- Deffenbacher JL, Oetting ER, Thwaites GA, Lynch RS, Baker DA, Stark RS, Eiswerth-Cox L. State-trait anger theory and the utility of the Trait Anger Scale. Journal of Counseling Psychology. 1996;43:131–148. [Google Scholar]
- Eckhardt C, Norlander B, Deffenbacher J. The assessment of anger and hostility: A critical review. Aggression and Violent Behavior. 2004;9:17–43. [Google Scholar]
- Eckhardt CI, Barbour KA, Stuart GL. Anger and hostility in maritally violent men: Conceptual distinctions, measurement issues, and literature review. Clinical Psychology Review. 1997;17:333–358. doi: 10.1016/s0272-7358(96)00003-7. [DOI] [PubMed] [Google Scholar]
- Endler NS, Hunt J. S-R inventories of hostility and comparisons of the proportions of variance from persons, responses, and situations for hostility and anxiousness. Journal of Personality & Social Psychology. 1968;9:309–315. doi: 10.1037/h0026100. [DOI] [PubMed] [Google Scholar]
- Endler NS, Hunt J. Generalizability of contributions from sources of variance in the S-R inventories of anxiousness. Journal of Personality. 1969;37:1–24. doi: 10.1111/j.1467-6494.1969.tb01728.x. [DOI] [PubMed] [Google Scholar]
- Endler NS, Hunt J, Rosenstein AJ. An S-R inventory of anxiousness. Psychological Monographs. 1962;76:33. (17, Whole No. 536) [Google Scholar]
- Endler NS, Kocovski NL. State and trait anxiety revisited. Journal of Anxiety Disorders. 2001;15:231–245. doi: 10.1016/s0887-6185(01)00060-3. [DOI] [PubMed] [Google Scholar]
- Fleeson W. Moving persoanlity beyond the person-situation debate: The challenge and opportunity of within person variability. Current Directions in Psychological Science. 2004;13:83–87. [Google Scholar]
- Freud S. General introduction to psychoanalysis. New York: Boni & Liveright; 1920. [Google Scholar]
- Gaudry E, Vagg P, Spielberger CD. Validation of the state-trait distinction in anxiety research. Multivariate Behavioral Research. 1975;10:331–341. doi: 10.1207/s15327906mbr1003_6. [DOI] [PubMed] [Google Scholar]
- Goldberg LR. Some recent trends in personality assessment. Journal of Personality Assessment. 1972;36:547–560. doi: 10.1080/00223891.1972.10119810. [DOI] [PubMed] [Google Scholar]
- Golding SL. Flies in the ointment: Methodological problems in the analysis of the percentage of variance due to persons and situations. Psychological Bulletin. 1975;82:278–288. [Google Scholar]
- Gorin AA, Stone AA. Recall biases and cognitive errors in retrospective self-reports: A call for momentary assessments. In: Baum A, Revenson T, Singer J, editors. Handbook of Health Psychology. Mahwah, NJ: Lawrence Erlbaum Associates; 2001. pp. 405–413. [Google Scholar]
- Hampson SE, John OP, Goldberg LR. Category breadth and hierarchical structure in personality: Studies of asymmetries in judgments of trait implications. Journal of Personality & Social Psychology. 1986;51:37–54. doi: 10.1037/0022-3514.51.1.37. [DOI] [PubMed] [Google Scholar]
- Heise DR. Separating reliability and stability in test-retest correlation. American Sociological Review. 1969;34:93–101. [Google Scholar]
- Henker B, Whalen CK, Jamner LD, Delfino RJ. Anxiety, affect, and activity in teenagers: Monitoring daily life with electronic diaries. Journal of the American Academy of Child & Adolescent Psychiatry. 2002;41:660–670. doi: 10.1097/00004583-200206000-00005. [DOI] [PubMed] [Google Scholar]
- Kabacoff RI, Segal DL, Hersen M, Van Hasselt VB. Psychometric properties and diagnostic utility of the Beck Anxiety Inventory and the State-Trait Anxiety Inventory with older adult psychiatric outpatients. Journal of Anxiety Disorders. 1997;11:33–47. doi: 10.1016/s0887-6185(96)00033-3. [DOI] [PubMed] [Google Scholar]
- Kenny DA, Zautra A. The trait-state-error model for multiwave data. Journal of Consulting and Clinical Psychology. 1995;63:52–59. doi: 10.1037//0022-006x.63.1.52. [DOI] [PubMed] [Google Scholar]
- Kneip RC, Delamater AM, Ismond T, Milford C, Salvia L, Schwartz D. Selfand spouse ratings of anger and hostility as predictors of coronary heart disease. Health Psychology. 1993;12:301–307. doi: 10.1037//0278-6133.12.4.301. [DOI] [PubMed] [Google Scholar]
- Lanning K. Individual differences in scalability: An alternative conception of consistency for personality theory and measurement. Journal of Personality & Social Psychology. 1988;55:142–148. [Google Scholar]
- LeDoux JD. Cognitive-emotional interactions in the brain. In: Eckman P, Davidson RJ, editors. The nature of emotion. New York: Oxford University Press; 1994. [Google Scholar]
- McAdams DP, Pals JL. A new Big Five: fundamental principles for an integrative science of personality. American Psychologist. 2006;61(3):204. doi: 10.1037/0003-066X.61.3.204. [DOI] [PubMed] [Google Scholar]
- McGrath RE, Mitchell M, Kim BH, Hough L. Evidence for response bias as a source of error variance in applied assessment. Psychological Bulletin. 2010;136:450–470. doi: 10.1037/a0019216. [DOI] [PubMed] [Google Scholar]
- Merz EL, Roesch SC. Modeling state and trait variation using multilevel factor analysis with PANAS daily diary data. Journal of Research in Personality. 2011;45:2–9. doi: 10.1016/j.jrp.2010.11.003. [DOI] [PMC free article] [PubMed] [Google Scholar]
- Miller TQ, Smith TW, Turner CW, Guijarro ML, Hallet AJ. Meta-analytic review of research on hostility and physical health. Psychological Bulletin. 1996;119:322–348. doi: 10.1037/0033-2909.119.2.322. [DOI] [PubMed] [Google Scholar]
- Mischel W, Shoda Y. A cognitive-affective system theory of personality: Reconceptualizing situations, dispositions, dynamics, and invariance in personality structure. Psychological Review. 1995;102:246–268. doi: 10.1037/0033-295x.102.2.246. [DOI] [PubMed] [Google Scholar]
- Novy DM, Nelson DV, Goodwin J, Rowzee RD. Psychometric comparability of the State-Trait Anxiety Inventory for different ethnic subpopulations. Psychological Assessment. 1993;5:343–349. [Google Scholar]
- Oei TP, Evans L, Crook C, G M. Validity and clinical utility of the Fear Questionnaire for anxiety-disorder patients. Psychological Assessment. 1991;2:391–397. [Google Scholar]
- Ozer D. Consistency in personality: A methodological framework. New York: Springer-Verlag; 1986. [Google Scholar]
- Pollard T, Schwartz JE. Longitudinal covariation of mood with blood pressure and total cholesterol in men and women. Health Psychology. 2003;22:47–53. doi: 10.1037//0278-6133.22.1.47. [DOI] [PubMed] [Google Scholar]
- Pope MK, Smith TW, Rhodewalt F. Cognitive, behavioral, and affective correlates of the Cook and Medley Hostility Scale. Journal of Personality Assessment. 1990;54:501–514. doi: 10.1080/00223891.1990.9674015. [DOI] [PubMed] [Google Scholar]
- Roesch SC, Aldridge AA, Stocking SN, Villodas F, Leung Q, Bartley CE, Black LJ. Multilevel factor analysis and structural equation modeling of daily diary coping data: Modeling trait and state variation. Multivariate Behavioral Research. 2010;45:767–789. doi: 10.1080/00273171.2010.519276. [DOI] [PMC free article] [PubMed] [Google Scholar]
- Rorer LG. The great response-style myth. Psychological Bulletin. 1965;63:129–156. doi: 10.1037/h0021888. [DOI] [PubMed] [Google Scholar]
- Russell J. A circumplex model of affect. Journal of Personality & Social Psychology. 1980;37:345–356. [Google Scholar]
- Ryan RM, Bernstein JH, Brown KW. Weekends, work, and well-being: Psychological need satisfactions and day of the week effects on mood, vitality, and physical symptoms. Journal of Social and Clinical Psychology. 2010;29(1):95–122. [Google Scholar]
- Sarason IG, Smith RE, Diener E. Personality research: Components of variance attributable to the person and the situation. Journal of Personality & Social Psychology. 1975;32:199–204. doi: 10.1037//0022-3514.32.2.199. [DOI] [PubMed] [Google Scholar]
- Schwartz JE, Neale J, Marco C, Shiffman SS, Stone AA. Does trait coping exist? A momentary assessment approach to the evaluation of traits. Journal of Personality and Social Psychology. 1999;77:360–369. doi: 10.1037//0022-3514.77.2.360. [DOI] [PubMed] [Google Scholar]
- Schwartz JE, Stone AA. Strategies for analyzing ecological momentary assessment data. Health Psychology. 1998;17:6–16. doi: 10.1037//0278-6133.17.1.6. [DOI] [PubMed] [Google Scholar]
- Schwartz JE, Stone AA. The analysis of real-time momentary data: A practical guide. In: Stone AA, Shiffman S, Atienza AA, Nebeling L, editors. The Science of Real-Time Data Capture: Self-Report in Health Research. Oxford: Oxford University Press; 2007. pp. 76–113. [Google Scholar]
- Schwartz JE, Warren K, Pickering TG. Mood, location and physical position as predictors of ambulatory blood pressure and heart rate: Application of a multi-level random effects model. Annals of Behavioral Medicine. 1994;16:210–220. [Google Scholar]
- Shapiro D, Jamner LD, Goldstein IB, Delfino RJ. Striking a chord: moods, blood pressure, and heart rate in everyday life. Psychophysiology. 2001;38:197–204. [PubMed] [Google Scholar]
- Shekelle RB, Gale M, Ostfeld AM, Paul O. Hostility, risk of coronary heart disease, and mortality. Psychosomatic Medicine. 1983;45:109–114. doi: 10.1097/00006842-198305000-00003. [DOI] [PubMed] [Google Scholar]
- Shiffman S. Ecological momentary assessment (EMA) in studies of substance use. Psychological assessment. 2009;21(4):486–489. doi: 10.1037/a0017074. [DOI] [PMC free article] [PubMed] [Google Scholar]
- Shiffman S, Stone AA, Hufford MR. Ecological momentary assessment. Annual Review of Clinical Psychology. 2008;4:1–32. doi: 10.1146/annurev.clinpsy.3.022806.091415. [DOI] [PubMed] [Google Scholar]
- Shoda Y, Mischel W, Wright JC. Intraindividual stability in the organization and patterning of behavior: Incorporating psychological situations into the idiographic analysis of personality. Journal of Personality & Social Psychology. 1994;67:674–687. doi: 10.1037//0022-3514.67.4.674. [DOI] [PubMed] [Google Scholar]
- Smith TW. Hostility and health: Current status of a psychosomatic hypothesis. Health Psychology. 1992;11:139–150. doi: 10.1037//0278-6133.11.3.139. [DOI] [PubMed] [Google Scholar]
- Smith TW, Frohm KD. What's so unhealthy about hostility? Construct validity and psychosocial correlates of the Cook and Medley Ho scale. Health Psychology. 1985;4:503–520. doi: 10.1037//0278-6133.4.6.503. [DOI] [PubMed] [Google Scholar]
- Solhan MB, Trull TJ, Jahng S, Wood PK. Clinical assessment of affective instability: Comparing EMA indices, questionnaire reports, and retrospective recall. Psychological Assessment. 2009;21:425–436. doi: 10.1037/a0016869. [DOI] [PMC free article] [PubMed] [Google Scholar]
- Spielberger CD. Anxiety: Current trends in theory and research: I. New York, NY: Academic Press; 1972. [Google Scholar]
- Spielberger CD. Manual for the State-Trait Anger Expression Inventory (STAXI) Odessa, FL: Psychological Assessment Resources, Inc.; 1988. [Google Scholar]
- Spielberger CD, Gorsuch RL, Lushene RE. Manual for the State-Trait Anxiety Inventory. Palo Alto, CA: Consulting Psychologists Press; 1970. [Google Scholar]
- Spielberger CD, Jacobs G, Russell S, Crane RS. Assessment of anger: The State-Trait Anger Scale. In: Butcher JN, Spielberger CD, editors. Advances in Personality Assessment. Hillsdale, NJ: Erlbaum; 1983. pp. 159–187. [Google Scholar]
- Stone AA, Smyth JM, Pickering TG, Schwartz JE. Daily mood variability: Form of dirurnal patterns and determinants of diurnal patterns. Journal of Applied Social Psychology. 1996;26:1286–1305. [Google Scholar]
Associated Data
This section collects any data citations, data availability statements, or supplementary materials included in this article.