

Summary
Human milk contains approximately 200 complex oligosaccharides believed to stimulate the growth and establishment of a protective microbiota in the infant gut. The lack of scalable analytical techniques has hindered the measurement of bacterial metabolism of these and other complex prebiotic oligosaccharides. An in vitro, multi‐strain, assay capable of measuring kinetics of bacterial growth and detailed oligosaccharide consumption analysis by FTICR‐MS was developed and tested simultaneously on 12 bifidobacterial strains. For quantitative consumption, deuterated and reduced human milk oligosaccharide (HMO) standards were used. A custom software suite developed in house called Glycolyzer was used to process the large amounts of oligosaccharide mass spectra automatically with 13C corrections based on de‐isotoping protocols. High growth on HMOs was characteristic of Bifidobacterium longum biovar infantis strains, which consumed nearly all available substrates, while other bifidobacterial strains tested, B. longum bv. longum, B. adolescentis, B. breve and B. bifidum, showed low or only moderate growth ability. Total oligosaccharide consumption ranged from a high of 87% for B. infantis JCM 7009 to only 12% for B. adolescentis ATCC 15703. A detailed analysis of consumption glycoprofiles indicated strain‐specific capabilities towards differential metabolism of milk oligosaccharides. This method overcomes previous limitations in the quantitative, multi‐strain analysis of bacterial metabolism of HMOs and represents a novel approach towards understanding bacterial consumption of complex prebiotic oligosaccharides.
Introduction
Understanding the molecular details of the metabolism of dietary oligosaccharides by gut microorganisms is important for elucidating their role in modulating health and disease. Dietary oligosaccharides are found abundantly in plants, fruits and are the third largest solid component of human milk (Coppa et al., 2004). The structural complexity of these oligosaccharides ranges widely among natural products, and results from the combination of the different monomeric glycosyl units forming mixtures differing in their degree of polymerization and glycosidic linkages. Many oligosaccharides readily extractable from natural products may function as prebiotics: ‘nondigestible food ingredients that beneficially affect the host by selectively stimulating the growth and/or activity of one or a limited number of bacterial species already resident in the colon, and thus attempt to improve host health’ (Gibson and Roberfroid, 1995). Since its initial definition in 1995 a growing number of food components, including many plant‐derived non‐digestible dietary fibres, have been claimed to elicit a prebiotic effect (Mussatto and Mancilha, 2007), however there is relatively little experimental detail on their specific metabolism by beneficial bacteria, or probiotics. Recently, stricter criteria for the classification of food ingredients as prebiotics have been established (Roberfroid, 2007) which emphasize the requirement for a selective and specific modulation of beneficial microorganisms in the gastrointestinal tract. Therefore, the next generation of prebiotics will require a clear understanding of the oligosaccharide structural complexity needed to selectively enrich growth of very specific beneficial bacterial communities for treating particular disease states or promoting specific wellness attributes.
While in exclusively breast‐fed infants bifidobacteria can comprise up to 90% of the infant gut microbiota, in formula‐fed infants a more complex and adult‐like microbiota is generally observed (Favier et al., 2003). Oral supplementation of Bifidobacterium longum bv. infantis (B. infantis) and Lactobacillus acidophilus significantly reduced the incidence and severity on necrotizing enterocolitis in very low‐birth‐weight (< 1500 g) infants (Lin et al., 2005). High levels of bifidobacteria in the newborns' gut microbiota are associated with reduced levels of intestinal infections and diarrhoea, and the benefits include a barrier effect against pathogens, the development of the infant gut immune system and an increased lactose tolerance (Lievin et al., 2000; Ouwehand et al., 2002; Servin, 2004). Human milk contains between 3 and 20 g l−1 (Coppa et al., 1993) of complex oligosaccharides necessary to stimulate early colonization of the undeveloped infant gut by bifidobacteria (Chaturvedi et al., 2001). Human milk oligosaccharides (HMOs) consist of a lactose core extensively elongated by β1‐3 or β1‐6 linkages to lactosamine units, and further decorated with fucose or sialic acid residues in terminal positions connected respectively with α1‐2,3,4 and α2‐3,6 linkages. The possible arrangement of monosaccharide combinations and linkages results in a structurally complex array of linear and branched oligosaccharide structures. The latest annotation of the human milk glycome utilized a high mass accuracy analyser (orthogonal time of flight mass spectrometry) to identify approximately 200 molecular species based on exact mass measurements from a pooled human milk sample (Ninonuevo et al., 2006). An understanding of the biological function of HMO and their beneficial health effects on infants, aside from their postulated prebiotic role (LoCascio et al., 2007), has only recently begun to emerge (Bode, 2006). HMOs have an immunomodulatory effect on neutrophils (Bode et al., 2004). They have been shown to decrease binding and infection of the pathogen Campylobacter jejuni (Ruiz‐Palacios et al., 2003) and inhibit HIV‐1 transfer to CD4+ T lymphocytes (Hong et al., 2008). Recently our group described a strategy to annotate the human milk glycome, and identified nearly 200 possible oligosaccharide structures differing in their size, charge and sequence (Ninonuevo et al., 2006). Mass spectrometric methods were developed to monitor bacterial consumption of individual HMOs (Ninonuevo et al., 2007), and demonstrated specific, preferential oligosaccharide consumption by select bifidobacterial strains, providing a rationale for why microorganisms, such as B. infantis, are uniquely enriched in the gut of breast‐fed infants (LoCascio et al., 2007).
Unfortunately, the limited quantification methods to analyse complex HMOs had hindered our understanding of their metabolism by bifidobacterial species and other specific biological functions associated with these complex oligosaccharides. In this report, a method for rapid and detailed analysis of bifidobacteria for their capacity to consume the most abundant fucosylated and neutral HMOs was developed. The method is an integrated, scalable platform using a combination of microtitre plate analysis of microbial growth and MALDI‐FTICR‐MS to obtain detailed, strain‐specific oligosaccharide consumption profiles. To handle the large amounts of data generated from the mass spectrometer, a high‐throughput data analysis software package, Glycolyzer, was developed in house. The Glycolyzer software suite was written in Igor Pro 6.04 (WaveMetrics, Portland, OR) to facilitate data processing from raw mass spectra to analysed data. Analysis included signal noise filtering, isotope deconvolution, oligosaccharide peak annotation and deuterated/undeuterated (D/H) relative quantification. This method can be extended towards the analysis of microbial consumption of other complex dietary oligosaccharides, and will be particularly useful when the substrate is of limited availability and information on specific oligosaccharide consumption from complex mixtures of oligosaccharides is demanded. The method presented here enables detailed profiling of probiotic bacterial culture collections for their ability to metabolize complex milk oligosaccharides. This method forms part of a strategy to identify the symbiotic effect between specific probiotic bacterial strains and the type of prebiotic dietary carbohydrate necessary to treat specific health conditions.
Results
A plate reader‐based bacterial growth assay was coupled with MS analysis of the spent cultures, and a custom‐developed data analysis software to obtain detailed HMO consumption patterns for 12 bifidobacterial strains. For every strain, the following growth kinetics parameters were calculated: growth rate, apparent lag time, generation time and maximum optical density (OD) reached. These were analysed in combination with the HMO consumption glycoprofiling data to obtain a detailed description of each strain's ability to metabolize specific HMOs. In the automated MS analysis error bars were calculated from at least six relative standard deviations of both the control and samples. Computing the propagation of error was necessary because the per cent HMO consumption was computed by normalizing the MS intensity of the samples to that of the control. Per cent relative standard deviation widely ranged from 1% to 18% and an average of less than 10% for each oligosaccharide peak. The combined use of 96‐well plates and TipTop cartridges reduced the amount of HMO needed for bacterial growth by fivefold, and has reduced the time to perform the oligosaccharide extraction process of a given sample from 41.5 to 3.5 h (Fig. 1). This method enabled monitoring bacterial consumption of the most abundant fucosylated and neutral oligosaccharide isomers in human breast milk, accounting by number for 54% of the total number of individual oligosaccharides from a pooled human milk sample. The HMO masses monitored comprise several isomers representing the highest abundance milk oligosaccharides, and accounting for approximately 70% of all HMOs in milk (Ninonuevo et al., 2006) (Table S1).
Figure 1.
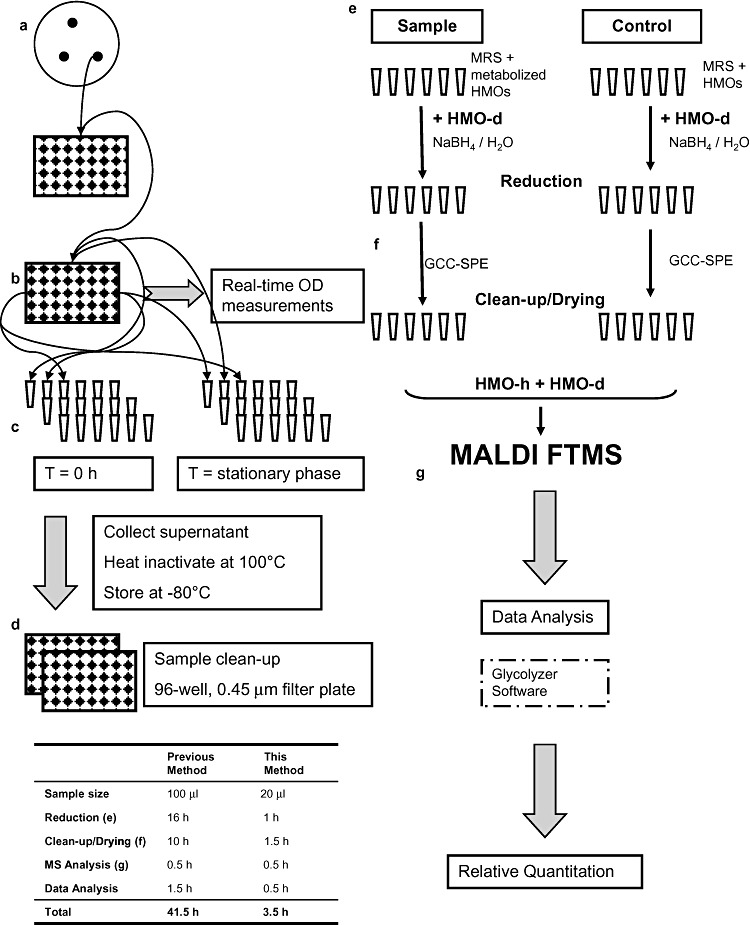
Schematic of experimental procedure. Schematic illustration for the workflow utilized for the real‐time monitoring of bacterial growth, sample preparation, MS analysis, data collection and analysis. (a and b) Clonal expansion and real‐time monitoring of bacterial growth performed in anaerobic chamber. (c) Sample collection. (d) Sample inactivation, sterilization and clean‐up. (e) Internal standard addition. (f) TipTop PGC oligosaccharide isolation. (g) Sample MS analysis, data acquisition and processing. Time gains in sample processing as compared with a previously developed method (LoCascio et al., 2007).
Glycan‐specific growth of B. infantis strains
The highest growth was observed mainly among the B. infantis strains JCM 7009, JCM 7010, JCM 7007, JCM 7011 and ATCC 15697, respectively, for which a nearly complete consumption of all HMOs with a DP (degree of polymerization of the HMOs) ≤ 7 (m/z = 732.25, 878.31, 1097.39 and 1243.44) was observed (Table 1, Figs 2 and S1). Among these strains the HMO consumption patterns resulted in highly similar glycoprofiles and the total HMO utilization ranged between 87.15% and 84.08% (Table 1). Except ATCC 15697, the rest of the strains have been classified by ribotyping and RAPD‐PCR to belong to the infantis biovar (Sakata et al., 2002). Compared with other bifidobacterial species tested these B. infantis strains shows unique glycoprofiling patterns with very high metabolic capacity for HMOs. This is also clearly reflected in their growth kinetic analysis for having distinctly similar growth rates and the highest ODs achieved among all the tested strains. Deuterated and reduced milk oligosaccharides were added as internal standards (Fig. 3) and Glycolyzer was used to perform automatic calculations of D/H ratios which were used as metric for measuring specific oligosaccharide consumption. HPLC‐Chip/TOF‐MS analysis of B. infantis ATCC 15697 oligosaccharide consumption patterns confirmed previous MALDI‐FTICR‐MS data (LoCascio et al., 2007) indicating that among several HMOs available B. infantis consumes only specific glycans. The HPLC‐Chip/TOF‐MS system enabled the detailed HMO consumption analysis at the single isomer level revealing that B. infantis does not discriminate among isomers of the same HMO (Fig. 4).
Table 1.
Kinetic analysis of bacterial growth.
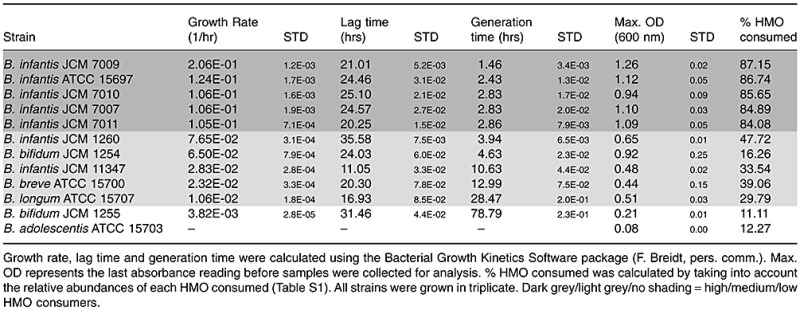
Figure 2.
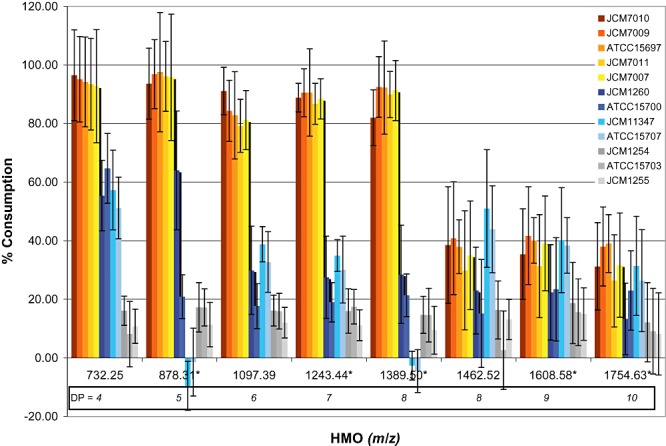
Human milk oligosaccharide (HMO) consumption glycoprofiles. MALDI‐FTICR‐MS analysis of 12 bifidobacterial strains grown on a medium supplemented with 1.6% (w/v) HMO. HMO consumption is represented as the per cent difference in HMO abundance between the start and the end of fermentation, which was defined as the beginning of stationary phase (see Fig. S2 and Table S1 for detailed glycoprofiles and HMOs relative per cent abundance). Measurements are triplicates of individual biological and technical replicates. DP, degree of polymerization of the HMOs. *Fucosylated HMOs.
Figure 3.
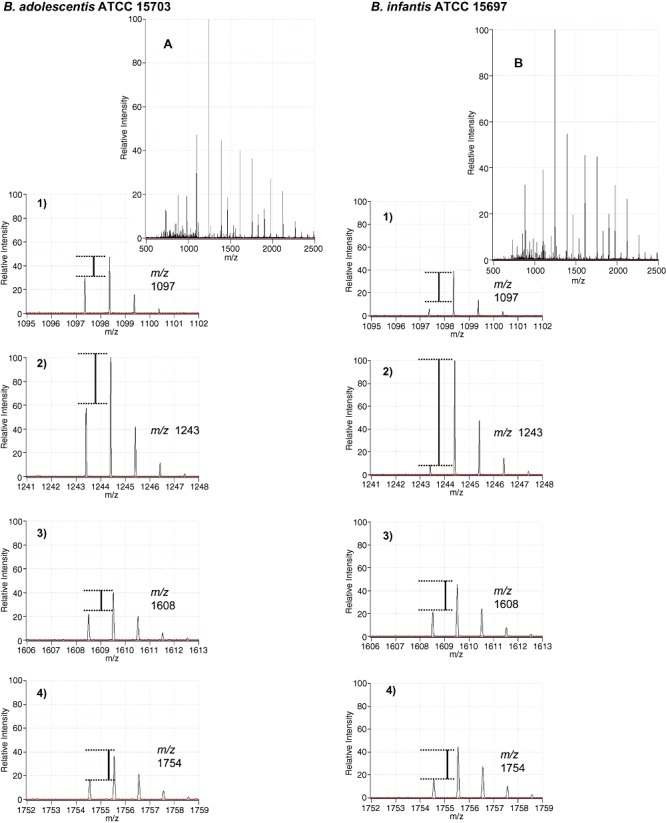
MALDI‐FTICR‐MS analysis of glycans remaining post fermentation by B. adolescentis (A) and B. infantis (B). Shown in the upper section are the full scan MS of the two samples along with the zoomed‐in mass spectra of four selected masses [m/z 1097 (1), 1243 (2), 1608 (3), 1754 (4)]. The lines point to the difference of the D/H ratio for each sample illustrating differential consumption of the two species (see text for details on the D/H methods).
Figure 4.
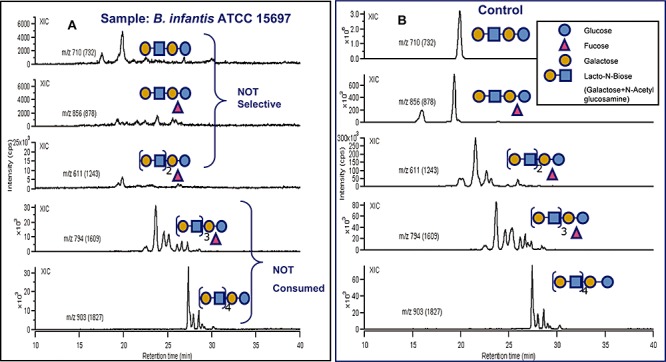
HPLC‐Chip/TOF‐MS analysis of selectivity for specific glycan structures consumed by B. infantis ATCC 15697. Shown are nanoLC extracted ion chromatograms (XIC) of selected milk glycans recovered (A) after incubation with B. infantis ATCC 15697 and (B) before incubation (control). The complete disappearance (A) of all glycan peaks for specific oligosaccharide (m/z: 732, 878 and 1243) indicates that B. infantis consumes specific HMOs but does not discriminate for any specific isomers within each group of HMO consumed.
Noticeable differences in both consumption glycoprofiles and all kinetic parameters were observed for B. infantis strains JCM 11347 and JCM 1260 which only partially consumed HMOs with DP ≤ 7. Additionally, strain JCM 11347 did not utilize fucosylated HMOs with an m/z of 878 and 1389. These HMOs differ by the addition of fucosylated Lacto‐N‐Biose units as described in LoCascio and colleagues (2007). For oligosaccharides with a DP ≥ 7 no consumption differences were observed among all the B. infantis strains. Comparatively, while JCM 7009 utilized 75% of the total HMO consumed from oligosaccharides with a DP ≤ 7, JCM 11347 only achieved 25% consumption from the same HMOs. Strains JCM 1260 and JCM 11347 achieved mediocre growth on HMOs with an OD 0.65 and 0.48, respectively, corresponding approximately to half of the typical OD of B. infantis strains optimally growing on HMOs (Table 1). The growth kinetic parameters of these two B. infantis strains closely resemble that from non‐B. infantis strains which also poorly metabolized HMOs. Although most B. infantis strains achieved excellent growth on HMOs, strains JCM 1260 and JCM 11347 were an exception, which was reflected in their suboptimal growth kinetics. A key factor determining their lack of growth could be their inability to efficiently consume HMOs with an m/z of 732 and 878, representing 41.9% and 25.9% of the total HMOs measured in our assay (Table S1). Due to the large abundance of these two oligosaccharides in the pooled milk sample, the strains' inability to consume them would greatly undermine their growth.
Glycan‐specific growth of non‐B. infantis strains
For the two Bifidobacterium bifidum strains tested, JCM 1254 and JCM 1255, although similar glycoprofiles patterns and HMO consumption rates were observed (Fig. 2), these strains differ in their overall growth kinetics (Table 1). While JCM 1254 consumed only 16.26% of the total HMOs, this strain grew moderately on this substrate and achieved an OD of 0.9. It is likely that JCM 1254 is able to grow on sialylated HMOs or on less abundant, yet numerically significant, neutral and acidic HMOs which are not being monitored in our assay.
Bifidobacterium breve ATCC 15700 consumed 64.5% of Lacto‐N‐(neo)tetraose (m/z = 732), and 20% of the fucosylated HMOs not consumed by ATCC 15707 and JCM 11347 (Fig. 2). The combined metabolism of these oligosaccharides in ATCC 15700 accounts for 33.7% of the total HMO consumption and enables this organism to achieve growth kinetics similar to ATCC 15707 and JCM 11347. Interestingly, B. infantis JCM 11347 and B. longum ATCC 15707, having nearly identical glycoprofiles, similar growth kinetics and an overall HMO consumption of, 33.5% and 29.8%, respectively, do not consume fucosylated HMOs with m/z of 878 and 1379. This indicates that the metabolism of fucosylated HMOs in some but not all bifidobacteria can be an important factor for their overall efficiency in oligosaccharide consumption, ultimately affecting their growth.
With the exception of B. bifidum JCM 1255 and B. adolescentis ATCC 15703 which possess a very limited ability to metabolize HMOs, the rest of the tested strains, differentially utilized HMOs with a DP ≤ 7. However a similar consumption pattern for HMOs with a DP ≥ 8 was observed for all the tested strains, regardless of their growth kinetics and total HMO consumption (Fig. 2).
Discussion
A MALDI‐FTICR‐MS method (LoCascio et al., 2007) was made scalable to enable the fast analysis of growth and consumption by several bifidobacterial strains of the most abundant neutral and fucosylated HMOs. The growth kinetics analysis, the multi‐sample, small‐volume post‐fermentation oligosaccharide extraction process, and custom‐developed software for MS oligosaccharide data analysis are key novelties of this method. The software tool developed utilized statistical spectra processing and data reconstructive algorithms to rapidly annotate, identify and quantify spectral peaks generated by the MS analysis. The integration of these previously independent modules into a single, integrated platform enabled the simultaneous, fast, multi‐strain analysis for bacterial metabolism of individual oligosaccharides in complex prebiotic mixtures. The significant sample processing time gains, and the critical 30‐fold reduction in sample volume and HMO usage, compared with a previously published method (LoCascio et al., 2007), enabled the study of consumption of complex milk oligosaccharides in several bifidobacterial strains in a single experiment. This report is the first describing the use of HPLC‐Chip/TOF‐MS microfluidic technology to profile bacterial consumption of individual glycan isomers from a complex mixture of prebiotic oligosaccharides.
The noticeable differences in overall growth kinetics, consumption glycoprofiles and per cent HMO consumed, both within and across bifidobacterial species, indicate that there are strain‐specific differences in the respective abilities and efficiencies of HMO metabolism. Overall, the key measures of bacterial growth, such as the growth rate and maximum OD, correlate well with total per cent HMO consumed and the specific consumption of abundant HMOs, such as Lacto‐N‐Tetraose (m/z = 732.25) and Lacto‐N‐Hexaose (m/z = 1097.39). The extended lag time observed for all the tested strains (Table 1) is likely caused by the switch from lactose, a preferred (Parche et al., 2006) and easily metabolized disaccharide present in the pre‐culturing MRS media, to a lactose‐free HMO‐based medium containing complex oligosaccharides with a DP ≥ 4. Based on these results the tested strains can be grouped into high (ATCC 15697, JCM 7011, JCM 7010, JCM 7009, JCM 7007), medium (ATCC 15700, ATCC 15707, JCM 1260, JCM 1347, JCM 1254) and low HMO consumers (ATCC 15703, JCM 1255) (Table 1). The nearly complete consumption by the high‐HMO‐consuming strains of glycans with a DP ≤ 8 (Fig. 2) suggests that these B. infantis strains posses a highly specialized, size‐specific system for binding and import of HMOs with DP ≤ 8. Indeed, analysis of the B. infantis ATCC 15697 genome has revealed the presence of extracellular solute‐binding proteins (SBP) predicted to bind oligosaccharides and part of an ABC transporter system complex. In comparison, B. infantis ATCC 15697 possesses 21 such genes associated with oligosaccharide transport, while B. adolescentis ATCC 15703 (GenBank: AP009256) only possesses 11. Additionally, the clustering of some of these transport proteins around β‐galactosidases, N‐acetyl‐β‐hexosaminidases, sialidases and fucosidases suggests a common role and co‐regulation in the import and metabolism of HMOs (Sela et al., 2008). Notably, strains belonging to the B. infantis biovar dominated as high HMO consumers; their superior ability to consume prebiotic oligosaccharides from human milk is likely an essential trait enabling this species to be one of the most abundant early colonizers of the breast‐fed infant gut (Favier et al., 2003).
HMOs are an abundant component of diets in breast‐fed infants. The differential growth of several bifidobacterial species on this complex substrate supports the principle that the prebiotic effect of human milk directs selected bacterial communities and assigns milk's microbiota altering properties to its oligosaccharides. Precise identification and quantification of oligosaccharide consumption by individual gut bacteria enables an in‐depth understanding of their metabolism by probiotic organisms. The increasing availability of sequenced microbial genomes creates an opportunity for glycomics methods such as the one described here, to provide the functional characterization needed to support comparative genome analyses and gene expression studies. Together they enable the understanding at the molecular and genetic level of prebiotic consumption and metabolism by gut bacteria. While all these methods are limited by their in vitro and in silico approaches, they are critical tools to design and select optimal prebiotic–probiotic combinations, prior to perform animal and human efficacy studies.
Experimental procedures
HMO purification
HMOs were separated from pooled human breast milk samples as previously described in Ward and colleagues (2006). Pooled milk was provided by ProLacta Biosciences (Monrovia, CA).
Microtitre growth of bacteria
All bifidobacterial strains were obtained from the Japanese Collection of Microorganism (JCM) or the American Type Culture Collection (ATCC) (Manassas, VA). Cultures were initially propagated on deMan, Rogosa, Sharpe, (MRS) agar plates (Becton Dickinson, Sparks, MD). Single colonies were picked with a 1 µl sterile loop and smeared on the bottom of a Corning (Lowell, MA) untreated polystyrene 96‐well plate (Fig. 1, a), then grown twice on a semi‐synthetic MRS medium, devoid of a carbohydrate source (Barrangou et al., 2003). In the first passage this medium was supplemented with 1.5% (w/v) filter‐sterilized (Millex‐GV, 0.22 µm, Millipore, Billerica, MA) lactose as the sole carbohydrate source. The resulting cultures were then used as a 1% inoculum for a second passage where the medium was supplemented with 1.6% (w/v) sterile‐filtered HMO (Fig. 1, b). All wells were covered with 40 µl of sterile mineral oil to prevent evaporation during the growth assays. Cell growth was performed in 100 µl of HMO‐supplemented media and monitored in real time by assessing optical density at 600 nm (OD600) using a BioTek PowerWave 340 plate reader (Winoosky, VT). The plate reader was operated in discontinuous mode, with absorbance readings performed in 30 min intervals, and preceded by 30 s shaking intervals at medium speed. There was no detectable growth on this medium (OD600 < 0.1) without the addition of a carbohydrate source. All media were also supplemented with 1% (w/v) l‐cysteine and all incubations and sample collections were carried out at 37°C in an anaerobic chamber (Coy Laboratory Products, Grass Lake, MI). All the collected data were processed with the Bacterial Growth Kinetics Software (F. Breidt, pers. comm.), curve fitting was performed using the Logistic model, and all other parameters were set to default. Samples were grown in biologically independent triplicates and the resulting growth kinetic data were expressed as the mean of these replicates with the respective standard deviation. Controls consisted of inoculated medium lacking HMO and un‐inoculated medium containing HMO.
Preparation of spent cultures for MS analysis
Cell growth was monitored every 30 min as previously described; upon reaching stationary phase the cells supernatants were collected anaerobically (Fig. 1, c). The resulting spent supernatant was heat inactivated at 100°C for 5 min in a PTC‐200 MJ Thermocycler (Bio‐Rad Laboratories, Hercules, CA) and filter sterilized using a filter plate with 0.45 µm diameter (MultiScreen HTS‐HV, Millipore) (Fig. 1, d). HMO stability under these conditions has been previously verified (data not shown). Samples were stored at −80°C until further use.
Oligosaccharide isolation and purification
Oligosaccharides from supernatants were recovered and purified as described in LoCascio and colleagues (2007) with the following modifications: 2.0 M sodium borohydride (20 µl) was added to 20 µl of sterile‐filtered spent supernatant and incubated at 65°C for 1 h (Fig. 1, e). Five ul (50.0 mg ml−1) of deuterated and reduced milk oligosaccharides was added as internal standards. The mixture was desalted and purified by solid‐phase extraction using TopTip (100–1000 µl capacity) packed with graphitized carbon (Glygen, Columbia, MD). The tip was conditioned by washing three times with 400 µl of deionized water, followed by washes with 80% acetonitrile in 0.10% (v/v) aqueous trifluoroacetic acid (TFA) (v/v) and nanopure water. The sample was then loaded onto the tip and subsequently washed seven times with 400 µl of nanopure water and eluted with 400 µl of 20% (v/v) acetonitrile in water. The fraction was dried in vacuo and reconstituted with 50 µl of nanopure water prior to MS analysis (Fig. 1, f).
MS methods
MALDI‐FTICR‐MS analysis. Mass spectra were acquired using a ProMALDI‐FTICR‐MS (Varian, Lake Forest, CA) equipped with an external MALDI source, a Nd:YAG laser (355 nm) and a 7.0 Tesla shielded‐superconducting magnet. Sample (1 µl) was applied onto a stainless steel MALDI target, doped with 1 µl of 0.01 M sodium chloride and followed by 1 µl of 0.4 M 2,5‐dihydroxybenzoic acid (matrix). Two MS acquisitions (at least) were recorded for each biological replicate. MALDI‐FTICR‐MS analysis was performed in the m/z scan range of 220–4500 with 1024K data points and 1 MHz ADC rate acquired in the positive ionization mode.
HPLC‐Chip/TOF‐MS analysis. Pooled HMOs were analysed following the method published previously (Ninonuevo et al., 2006). Isolated oligosaccharides from pooled human milk were profiled using an Agilent 6200 Series HPLC‐Chip/ TOF‐MS system equipped with a microwell‐plate autosampler (maintained at 20.0°C), capillary sample loading pump, nanopump, HPLC‐Chip interface and the Agilent 6210 TOF LC/MS. The glycan chip used consisted of 40 nl enrichment column and 43 × 0.75 mm ID analytical column, both packed with porous graphitized carbon 5 µm stationary phase. The sample in 0.1% formic acid (0.5 µl) was delivered isocratically via capillary pump in 3.0% (v/v) acetonitrile/water at 4 µl min−1. Subsequently, a nanolitre pump gradient was run at 0.3 µl min−1 consisting of (A) 0.1% formic acid in 3.0% acetonitrile/water (v/v) and (B) 0.1% formic acid in 90% (v/v) acetonitrile/water. A 45 min nanoLC gradient was run at 0–16% B, 2.5–20.0 min, 16–44% B, 20.0–30.0 min, 44–100% B, 30.0–35.0 min with equilibration time of 20 min at 0% B. The drying gas temperature was set at 325°C with a flow of 4.0 l min−1 (2 l of filtered nitrogen gas and 2 l of filtered dry grade compressed air). Data were acquired in the positive ionization mode within a mass range of m/z 500–3000. Mass correction was enabled using a reference mass of m/z 519.139.
Analytical algorithm for HMO annotation
Custom data analysis software was designed due to the uniqueness and magnitude of the problem. The software was designed to process ASCII mass spectra or ion cyclotron resonance transients from the mass spectrometer and calculate D/H ratios as a metric for measuring specific oligosaccharide consumption.
Data preprocessing was required to centroid peaks and calculate lower limit of detection abundance thresholds. Accurate mass assignments and intensities were obtained by fitting a parabola to the three highest points in a peak. The apex of the fit parabola provides the abundance and centroid mass of a peak. The signal detection noise threshold was set at six standard deviations above the mean. Baseline noise peaks are often the most frequently detected peaks in a spectrum. A histogram of all abundances provides an approximation of the distribution of the noise. The standard deviation of the noise is calculated from the half width at half maximum of the distribution. The centroided data needed to be reduced to monoisotopic peaks before D/H ratios were calculated. A data reconstructive fitting algorithm was used for monoisotopic peak location determination. Synthetic isotope calculations were based on a sugar ‘averagose’ calculations rather than the common ‘averagine’ model since the peptides basis is not fitting for oligosaccharides. The sugar ‘averagose’ building block used was based on a general HexNAc monosaccharide unit C8H13O5N1 (MW = 203.07937 g mol−1). The HexNAc averagose approximation provided an effective model for the experimental isotope distributions as noted from the libraries or exact elemental compositions. The averagose was led to elemental compositions by multiplying the averagose by a factor to obtain the theoretical carbon, hydrogen, oxygen and nitrogen composition of the unknown ion. Once the estimated elemental composition was found, a synthetic isotopic distribution was calculated using Poisson's distribution. Numerical methods were used to reconstruct the overlapping deuterated and non‐deuterated isotopic distributions and yield the monoisotopic peaks for D/H ratio calculations. Once the monoisotopic ions were located after data reconstruction, the non‐deuterated synthetic distribution was subtracted to calculate the deuterated monoisotopic sugar abundance. The automated D/H analysis performed with the Glycolyzer algorithms was consistent with manual calculations performed by hand.
Acknowledgments
This work was partially funded by grants from the California Dairy Research Foundation (CDRF), Dairy Management Inc., UC Discovery and USDA NRI‐CSREES Award 2008‐35200‐18776. This research was partially supported by an industry/campus‐supported fellowship (R.G.L.) under the Training Program in Biomolecular Technology (T32‐GM08799) at the University of California, Davis. Agilent Technologies is thanked for providing the HPLC‐Chip/TOF‐MS system and Dr Fred Breidt at the USDA – ARS for the Bacterial Growth Kinetics Software package.
Supporting Information
Additional Supporting Information may be found in the online version of this article:
Fig. S1. Microtitre plate-based growth curves. Growth curves of all tested strains in a semi-synthetic MRS medium supplemented with 1.6% (w/v) HMO. Growth was measured as optical density (OD) of the media at 600 nm. Depending when each strain reached stationary phase 79, 110 or 133 readings were collected for each sample over the course of the experiment. Growth curves were constructed by using the average OD reading for three replicates at each time point. Controls consisted of inoculated medium lacking HMO and un-inoculated medium containing HMO which was also used as a blank for OD measurements.
Fig. S2. HMO consumption glycoprofiles (detailed). MALDIFTICR-MS analysis of HMO consumption by 12 bifidobacterial strains grown on a medium supplemented with 1.6% (w/v) HMO. HMO consumption represented as the per cent difference in HMO abundance between the start and the end of fermentation, which was defined as the beginning of stationary phase. The five most abundant HMO masses were m/z: (a) 732.5; (b) 878.3; (c) 1097.4; (d) 1243.4; (e) 1389.5. Fermentations were carried out in triplicate; controls consisted of inoculated medium lacking HMO and un-inoculated medium containing HMO which was also used as a blank for OD measurements. Error bars are standard deviations of the mean for each available time point.
List of possible HMOs, their masses, retention times and compositions. The analysis was performed using the HPLC-Chip/TOF-MS system.
References
- Barrangou R., Altermann E., Hutkins R., Cano R., Klaenhammer T.R. Functional and comparative genomic analyses of an operon involved in fructooligosaccharide utilization by Lactobacillus acidophilus. Proc Natl Acad Sci USA. 2003;100:8957–8962. doi: 10.1073/pnas.1332765100. [DOI] [PMC free article] [PubMed] [Google Scholar]
- Bode L. Recent advances on structure, metabolism and function of human milk oligosaccharides. J Nutr. 2006;136:2127–2130. doi: 10.1093/jn/136.8.2127. [DOI] [PubMed] [Google Scholar]
- Bode L., Rudloff S., Kunz C., Strobel S., Klein N. Human milk oligosaccharides reduce platelet‐neutrophil complex formation leading to a decrease in neutrophil beta 2 integrin expression. J Leukoc Biol. 2004;76:820–826. doi: 10.1189/jlb.0304198. [DOI] [PubMed] [Google Scholar]
- Chaturvedi P., Warren C.D., Buescher C.R., Pickering L.K., Newburg D.S. Survival of human milk oligosaccharides in the intestine of infants. In: Newburg D.S., editor. Kluwer Academic; 2001. pp. 315–323. [DOI] [PubMed] [Google Scholar]
- Coppa G.V., Gabrielli O., Pierani P., Catassi C., Carlucci A., Giorgi P.L. Changes in carbohydrate‐composition in human‐milk over 4 months of lactation. Pediatrics. 1993;91:637–641. [PubMed] [Google Scholar]
- Coppa G.V., Bruni S., Morelli L., Soldi S., Gabrielli O. The first prebiotics in humans – human milk oligosaccharides. J Clin Gastroenterol. 2004;38:S80–S83. doi: 10.1097/01.mcg.0000128926.14285.25. [DOI] [PubMed] [Google Scholar]
- Favier C.F., De Vos W.M., Akkermans A.D.L. Development of bacterial and bifidobacterial communities in feces of newborn babies. Anaerobe. 2003;9:219–229. doi: 10.1016/j.anaerobe.2003.07.001. [DOI] [PubMed] [Google Scholar]
- Gibson G.R., Roberfroid M.B. Dietary modulation of the human colonic microbiota – introducing the concept of prebiotics. J Nutr. 1995;125:1401–1412. doi: 10.1093/jn/125.6.1401. [DOI] [PubMed] [Google Scholar]
- Hong P., Ninonuevo M.R., Lee B., Lebrilla C.B., Bode L. Human milk oligosaccharides reduce HIV‐1‐gp120 binding to dendritic cell‐specific ICAM3‐grabbing non‐integrin (DC‐SIGN) Br J Nutr. 2008 doi: 10.1017/s0007114508025804. [DOI] [PubMed] [Google Scholar]
- Lievin V., Peiffer I., Hudault S., Rochat F., Brassart D., Neeser J.R., Servin A.L. Bifidobacterium strains from resident infant human gastrointestinal microflora exert antimicrobial activity. Gut. 2000;47:646–652. doi: 10.1136/gut.47.5.646. [DOI] [PMC free article] [PubMed] [Google Scholar]
- Lin H.C., Su B.H., Chen A.C., Lin T.W., Tsai C.H., Yeh T.F., Oh W. Oral probiotics reduce the incidence and severity of necrotizing enterocolitis in very low birth weight infants. Pediatrics. 2005;115:1–4. doi: 10.1542/peds.2004-1463. [DOI] [PubMed] [Google Scholar]
- LoCascio R.G., Ninonuevo M.R., Freeman S.L., Sela D.A., Grimm R., Lebrilla C.B. Glycoprofiling of bifidobacterial consumption of human milk oligosaccharides demonstrates strain specific, preferential consumption of small chain glycans secreted in early human lactation. J Agric Food Chem. 2007;55:8914–8919. doi: 10.1021/jf0710480. et al. [DOI] [PubMed] [Google Scholar]
- Mussatto S.I., Mancilha I.M. Non‐digestible oligosaccharides: a review. Carbohydr Polym. 2007;68:587–597. [Google Scholar]
- Ninonuevo M.R., Park Y., Yin H., Zhang J., Ward R.E., Clowers B.H. A strategy for annotating the human milk glycome. J Agric Food Chem. 2006;54:7471–7480. doi: 10.1021/jf0615810. et al. [DOI] [PubMed] [Google Scholar]
- Ninonuevo M.R., Ward R.E., LoCascio R.G., German J.B., Freeman S.L., Barboza M. Methods for the quantitation of human milk oligosaccharides in bacterial fermentation by mass spectrometry. Anal Biochem. 2007;361:15–23. doi: 10.1016/j.ab.2006.11.010. et al. [DOI] [PubMed] [Google Scholar]
- Ouwehand A.C., Salminen S., Isolauri E. Probiotics: an overview of beneficial effects. Antonie Van Leeuwenhoek. 2002;82:279–289. [PubMed] [Google Scholar]
- Parche S., Beleut M., Rezzonico E., Jacobs D., Arigoni F., Titgemeyer F., Jankovic I. Lactose‐over‐glucose preference in Bifidobacterium longum NCC2705: glcP, encoding a glucose transporter, is subject to lactose repression. J Bacteriol. 2006;188:1260–1265. doi: 10.1128/JB.188.4.1260-1265.2006. [DOI] [PMC free article] [PubMed] [Google Scholar]
- Roberfroid M. Prebiotics: the concept revisited. J Nutr. 2007;137:830s–837s. doi: 10.1093/jn/137.3.830S. [DOI] [PubMed] [Google Scholar]
- Ruiz‐Palacios G.M., Cervantes L.E., Ramos P., Chavez‐Munguia B., Newburg D.S. Campylobacter jejuni binds intestinal H(O) antigen (Fuc alpha 1, 2Gal beta 1, 4GlcNAc), and fucosyloligosaccharides of human milk inhibit its binding and infection. J Biol Chem. 2003;278:14112–14120. doi: 10.1074/jbc.M207744200. [DOI] [PubMed] [Google Scholar]
- Sakata S., Kitahara M., Sakamoto M., Hayashi H., Fukuyama M., Benno Y. Unification of Bifidobacterium infantis and Bifidobacterium suis as Bifidobacterium longum. Int J Syst Evol Microbiol. 2002;52:1945–1951. doi: 10.1099/00207713-52-6-1945. [DOI] [PubMed] [Google Scholar]
- Sela D.A., Chapman J., Adeuya A., Kim J.H., Chen F., Whitehead T.R. The complete genome sequence of Bifidobacterium longum subsp. infantis reveals adaptations for milk utilization within the infant microbiome. Proc Natl Acad Sci USA. 2008;105:18964–18969. doi: 10.1073/pnas.0809584105. et al. [DOI] [PMC free article] [PubMed] [Google Scholar]
- Servin A.L. Antagonistic activities of lactobacilli and bifidobacteria against microbial pathogens. FEMS Microbiol Rev. 2004;28:405–440. doi: 10.1016/j.femsre.2004.01.003. [DOI] [PubMed] [Google Scholar]
- Ward R.E., Ninonuevo M., Mills D.A., Lebrilla C.B., German J.B. In vitro fermentation of breast milk oligosaccharides by Bifidobacterium infantis and Lactobacillus gasseri. Appl Environ Microbiol. 2006;72:4497–4499. doi: 10.1128/AEM.02515-05. [DOI] [PMC free article] [PubMed] [Google Scholar]
Associated Data
This section collects any data citations, data availability statements, or supplementary materials included in this article.
Supplementary Materials
Fig. S1. Microtitre plate-based growth curves. Growth curves of all tested strains in a semi-synthetic MRS medium supplemented with 1.6% (w/v) HMO. Growth was measured as optical density (OD) of the media at 600 nm. Depending when each strain reached stationary phase 79, 110 or 133 readings were collected for each sample over the course of the experiment. Growth curves were constructed by using the average OD reading for three replicates at each time point. Controls consisted of inoculated medium lacking HMO and un-inoculated medium containing HMO which was also used as a blank for OD measurements.
Fig. S2. HMO consumption glycoprofiles (detailed). MALDIFTICR-MS analysis of HMO consumption by 12 bifidobacterial strains grown on a medium supplemented with 1.6% (w/v) HMO. HMO consumption represented as the per cent difference in HMO abundance between the start and the end of fermentation, which was defined as the beginning of stationary phase. The five most abundant HMO masses were m/z: (a) 732.5; (b) 878.3; (c) 1097.4; (d) 1243.4; (e) 1389.5. Fermentations were carried out in triplicate; controls consisted of inoculated medium lacking HMO and un-inoculated medium containing HMO which was also used as a blank for OD measurements. Error bars are standard deviations of the mean for each available time point.
List of possible HMOs, their masses, retention times and compositions. The analysis was performed using the HPLC-Chip/TOF-MS system.