

Summary
Streptomycetes produce many metabolites with medical and biotechnological applications. During fermentations, their hyphae build aggregates, a process in which the newly identified protein HyaS plays an important role. The corresponding hyaS gene is present within all investigated Streptomyces species. Reporter fusions indicate that transcription of hyaS occurs within substrate hyphae of the Streptomyces lividans wild type (WT). The HyaS protein is dominantly associated with the substrate hyphae. The WT strain forms cylindrically shaped clumps of densely packed substrate hyphae, often fusing to higher aggregates (pellets), which remain stably associated during shaking. Investigations by electron microscopy suggest that HyaS induces tight fusion‐like contacts among substrate hyphae. In contrast, the pellets of the designed hyaS disruption mutant ΔH are irregular in shape, contain frequently outgrowing bunches of hyphae, and fuse less frequently. ΔH complemented with a plasmid carrying hyaS resembles the WT phenotype. Biochemical studies indicate that the C‐terminal region of HyaS has amine oxidase activity. Investigations of ΔH transformants, each carrying a specifically mutated gene, lead to the conclusion that the in situ oxidase activity correlates with the pellet‐inducing role of HyaS, and depends on the presence of certain histidine residues. Furthermore, the level of undecylprodigiosin, a red pigment with antibiotic activity, is influenced by the engineered hyaS subtype within a strain. These data present the first molecular basis for future manipulation of pellets, and concomitant production of secondary metabolites during biotechnological processes.
Introduction
Streptomycetes are Gram‐positive soil bacteria growing on solid surfaces as multigenomic substrate hyphae, which develop aerial hyphae and finally unigenomic spores. Due to the complexity of their life cycle, they serve as models to elucidate the molecular steps leading to differentiation (Flärdh, 2003). Signals include nutrient depletion, decrease of the intracellular GTP pool (see review Ochi, 2007), the synthesis of specific triggering substances, known as γ‐butyrolactones (see review Horinouchi, 2007), and a morphogenic peptide (see review Willey et al., 2006).
Streptomycetes produce a huge repertoire of secondary metabolites (i.e. antibiotics, fungicides, cytostatics, pigments). Many of them have immense value for medical applications. Research has resulted in the elucidation of gene clusters determining these metabolites. The availability of genome sequences of streptomycetes (Bentley et al., 2002; Ikeda et al., 2003) has increased our knowledge considerably (see review Donadio et al., 2002). Recent approaches aim to extend genetic engineering and combinatorial work (see reviews Baltz, 2006; Lombo et al., 2006).
Streptomycetes secrete a wide range of enzymes (e.g. cellulases, proteases, lipase, xylanases) and enzyme inhibitors (see review Schrempf, 2007). Due to this capacity, they are also of great ecological importance for many processes in their natural habits, including the degradation of organic matters and humus formation (see review Kutzner, 1981). Many Streptomyces enzymes are also relevant for biotechnological processes.
Under laboratory conditions, streptomycetes are usually cultivated in flasks or bioreactors to accumulate large masses of substrate mycelia. Under these conditions, their substrate hyphae interact and form pellets, visible as clump‐like structures. The characteristics of such pellets have been analysed as to their dependence on the inocula, the media composition, speed of shaking conditions, and type of flasks or fermenters. Depending on the strain, and the product of interest, pellets can be a desired or an unfavourable feature (Fang et al., 2000; Jonsbu et al., 2002). Despite this importance, gene product(s) affecting pellet formation remained unexplored.
In this report, we describe a newly discovered Streptomyces gene encoding a secreted protein, which participates in stabilizing pellets derived from substrate hyphae. Subsequently, the features of the Streptomyces lividans wild type (WT), a designed disruption mutant, and transformants, in which the gene was specifically mutated, were compared by physiological, microscopical, immunological and biochemical studies. As the novel protein participates in hyphae aggregation of Streptomyces, its chosen name is HyaS. The findings comprise the first molecular key to elucidate the formation of stable Streptomyces pellets.
Results
Identification of a gene encoding a novel protein and its homologues
In the course of sequencing larger segments of an unstable genomic DNA region of S. lividans 66 WT (named within the text S. lividans WT) (Betzler et al., 1987), we discovered a reading frame of 1758 bp. This was subsequently (see below) named hyaS (EMBL, DS: 72304). The deduced protein, named HyaS (Fig. 1), comprises 585 amino acids (aa), including a signal peptide. It shares the highest (99%), second highest (73%) and third highest (63%) amino acid identity with, respectively, one hypothetical protein (including a signal peptide) deduced from the Streptomyces coelicolor A3(2) genomic sequence (Bentley et al., 2002), one from the Streptomyces griseus (Ohnishi et al., 2008) and one from the Streptomyces avermitilis genome (Ikeda et al., 2003). Furthermore, a slightly less related deduced protein (586 aa, including the predicted signal peptide) is encoded within the deposited genome of one Streptomyces scabies strain (Fig. 1). DNA–DNA hybridizations and analyses of PCR‐amplified fragments (data not shown) revealed the abundance of hyaS‐related sequences among six additionally tested Streptomyces species (see Experimental procedures).
Figure 1.
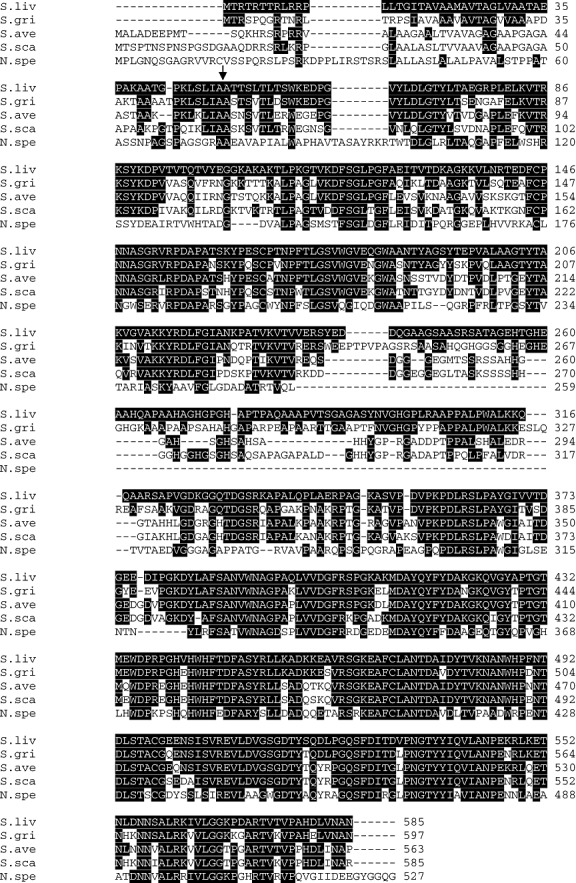
Alignment of HyaS with other hypothetical proteins. Block comparisons of deduced gene products from the streptomycetes S. lividans (S.liv, EMBL, DS: 72304), S. griseus (S.gri, SGR_3840), S. avermitilis (S.ave, SAV_4459), S. scabies (S.sca, 4945557‐4943764), Nocardioides sp. JS614 (N.spe, Noca_1817). The predicted S. coelicolor A3(2) protein (SCO 7657) corresponded to 99% to that of S. lividans; hence, it is not aligned. Amino acid residues, which are identical with the S. lividans protein, are marked white on a black background. The cleavage site, to generate the signal peptide, is indicated by an arrow.
The upstream region of hyaS promotes expression of the egfp reporter gene in germinating spores and substrate hyphae
The upstream region of the hyaS gene was cloned in frame with the egfp gene (encoding the enhanced green fluorescent protein) into the modified bifunctional pWHM3 vector (see Experimental procedures). Subsequently, the resulting reporter construct (line G in Fig. 2) was transformed into S. lividans. Within spores, EGFP‐derived fluorescence was absent (Fig. 2A). However, after incubation on solid media, it occurred in germinating spores, within substrate hyphae (Fig. 2B), but not in arial mycelia (Fig. 2C). After incubation in liquid medium, EGFP‐derived fluorescence was present within germinating spores, the extending substrate hyphae (not shown), as well as within clumps of substrate hyphae (Fig. 2D). This result clearly showed that the regulatory region of hyaS had provoked transcription of the egfp gene (Fig. 2G), which subsequently led to the synthesis of the fluorescent EGFP protein. The control S. lividans transformant carried the control plasmid with a 550 bp PCR fragment without regulatory region in front of the egfp gene (see line H in Fig. 2 and Experimental procedures). This control lacked relevant EGFP‐derived fluorescence under all cultivation conditions including individual substrate hyphae (Fig. 2E) and pellets clumps of substrate hyphae (Fig. 2F).
Figure 2.
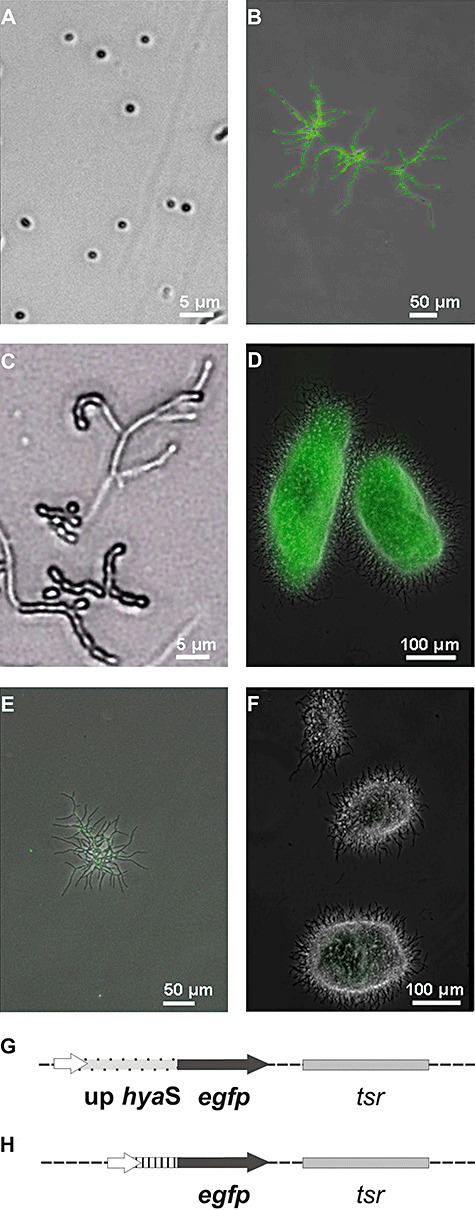
Synthesis of EGFP. A–D. The S. lividans transformant containing the construct (G) was analysed as spores (A), during early growth – as young substrate hyphae – on solid medium (B), during formation of aerial hyphae (C), or after cultivation in a flask filled with liquid medium under shaking conditions for 20 h (D). E and F. The S. lividans transformant with the control plasmid (H) was analysed (E and F) under the conditions presented under (B) or (D). Pictures were taken under visual light and under UV light using a Zeiss Axiovert microscope; merged pictures are presented (A–F). The magnification is given for each picture as a bar. G. The plasmid construct is a pWHM3 derivative, containing the egfp gene (black arrow) in frame with the upstream region of the hyaS gene (light grey with black points). H. The control plasmid corresponds to that one presented under (G), except that it has a small DNA fragment lacking the regulatory region (stripes) in front of egfp.
The disruption mutant ΔH lacking a functional hyaS gene differentiates
To investigate the role of the hyaS gene within the WT chromosome (Fig. 3, line D), we constructed several independent S. lividans mutants (named ΔH, Fig. 3, line E, and Table 1), which carried a hyaS gene disrupted by the hygromycin‐resistance cassette (Ωhyg) as outlined under Experimental procedures. On solid medium, ΔH colonies grew like the WT strain, and shared the differentiation pattern leading to spores (not shown). As viewed by transmission‐electron microscopy, the shape of the sectioned mutant spores corresponded to those of the WT strain (following Figs 4 and 5, the spores are presented in Fig. 6A and B).
Figure 3.
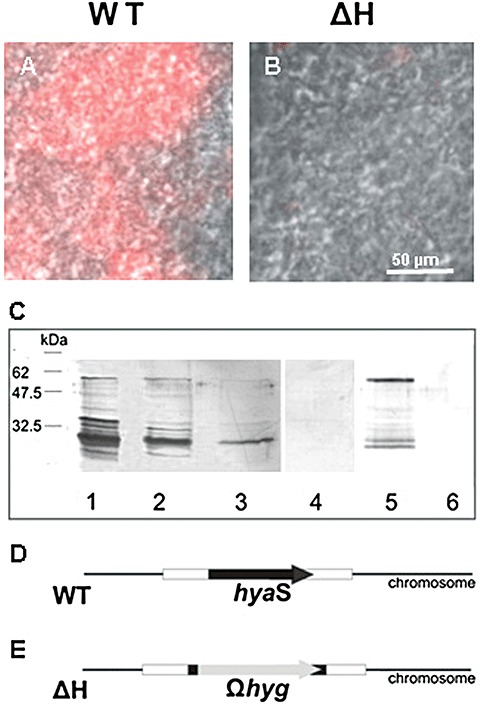
Localization of the HyaS protein, relevant characteristics of the chromosome from S. lividans WT and ΔH, and plasmid constructs. A and B. The hyphae of S. lividans WT (A) or ΔH (B) were grown in complete liquid medium without shaking for 17 h. Aliquots (A or B) were placed onto a polylysine‐coated glass slide (see Experimental procedures), treated with primary anti‐HyaS antibodies, and with Alexa Fluor 647‐coupled secondary rat antibodies. Subsequently, slides were analysed under UV light with a filter set for Cy5 and by phase‐contrast microscopy. The resulting pictures were merged; the bar in (B) indicates the magnification for (A) and (B). C. WT mycelia – grown as described above – were collected by centrifugation, washed successively three times with 1 M NaCl, and aliquots (lanes 1–3) were separated by SDS‐PAGE. As control, ΔH mycelia grew in the same fashion, and washings with 1 M NaCl (lane 4, aliquot of the first wash) were analysed. The proteins of the supernatant were precipitated by ammonium sulfate (90% w/v), re‐suspended and each sample (WT, lane 5 and ΔH, lane 6) was separated by SDS‐PAGE, and then transferred to a nylon membrane. This was treated with primary anti‐HyaA antibodies, then with secondary anti‐rat antibodies conjugated with alkaline phosphatase. Detection took place as described under Experimental procedures. D. The relative position of the hyaS gene within the WT chromosome is given. E. The position of the hygΩ replacing most part of the hyaS gene in the ΔH mutant is drawn.
Table 1.
Most relevant strains and plasmids.
| Designation | Features |
|---|---|
| WT | Streptomyces lividans 66 wild type (named in the text S. lividans WT) |
| ΔH | Streptomyces lividans 66 carrying a replacement of hyaS by hygΩ |
| pGM160 | Bifunctional, temperature‐sensitive Streptomyces/E. coli vector with tsr (thiostrepton) resistance gene |
| pGMLR | pGM160‐based plasmid with hygΩ flanked with fragments of hyaS |
| pWHM3 | Bifunctional Streptomyces/E. coli vector with tsr resistance gene |
| pHY11 | pWHM3‐based plasmid with the WT hyaS gene |
| pHY12 | Derivative of pHY11 carrying mutated hyaS gene encoding HyaSA441–A443–A445 |
| pHY13 | Derivative of pHY11 carrying mutated hyaS gene encoding HyaSA488 |
| pASK‐CH11 | pASK‐IBA‐7‐based E. coli plasmid carrying a truncated hyaS gene encoding Streptag‐HyaSc, corresponding to the C‐terminal 352–585 aa |
| pASK‐CH13 | Derivative of pASK‐CH11 carrying one mutation encoding Streptag‐HyaScA488 |
Figure 4.
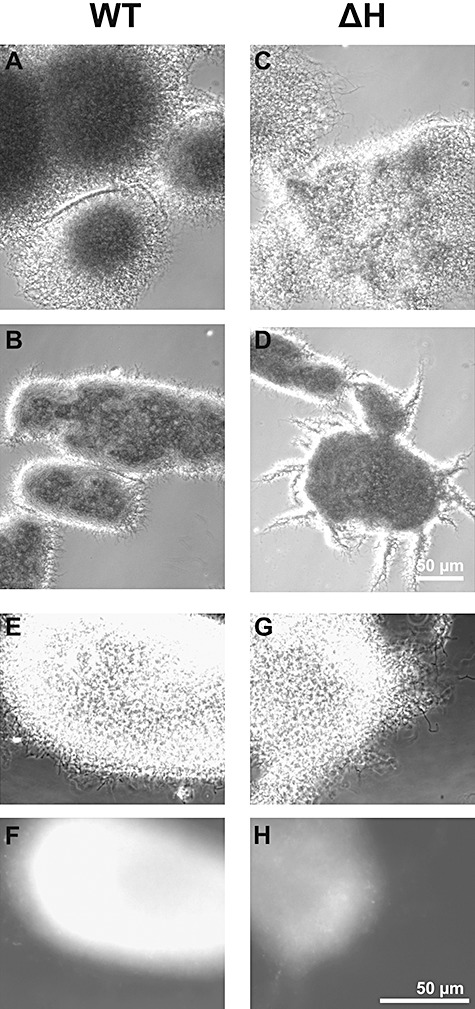
Characteristics of pellets from shaking cultures of S. lividans WT and ΔH. The WT (A and B, and E and F) strain or the ΔH mutant (C and D, and G and H) were grown in complete medium after shaking for 7 h (A and C) or 17 h (B, D and E; G, F and H), and inspected microscopically under visual light by phase contrast (A–G). After treatment with primary anti‐HyaS antibodies followed by Alexa Fluor‐coupled secondary anti‐rat antibodies, samples (E and G) were analysed under UV light with a Cy5 filter (F and H). The magnification of the pictures (A)–(D) (see bar in D) differs from that of the pictures (E)–(H) (see bar in H).
Figure 5.
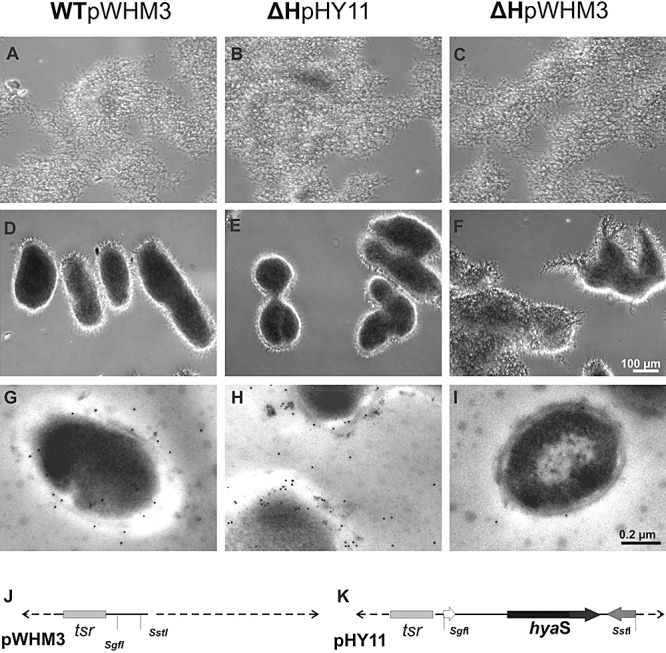
Comparatives features of the plasmid‐containing S. lividans strains. A–F. The strain WTpWHM3 (A and D), the mutant ΔHpHY11 (B and E) and ΔHpWHM3 (C and F) were incubated as standing cultures (A–C), or continued to grow during shaking (D–F) in complete medium for 19 h, and inspected by light microscopy. The pictures (A)–(F) are magnified as indicated by the bar in (F). G–I. Hyphae corresponding to (A)–(C) were embedded, treated with primary anti‐HyaS antibodies, and then with secondary gold‐labelled anti‐rat antibodies as described under Experimental procedures. Inspection of microtome‐generated ultra‐thin (70 nm) sections was by transmission‐electron microscopy. The magnification of the pictures (G)–(I) is presented by the bar in (I). J and K. Presentation of the relevant genes within the control plasmid pWHM3 and pHY11 (see also Table 1).
Figure 6.

Comparative analysis of spores and hyphae after treatment with colloidal thorium dioxide. A and B. Spores of the WT (A) or the ΔH (B) were collected from plates as outlined under Experimental procedures. C–H. The strains WT (C and E), ΔH (D and F), ΔHpHY11 (G) or ΔH pWHM3 (H) were grown in complete medium and washed. A–H. Samples were treated with ThO2 (colloidal thorium dioxide), and subsequently embedded (see Experimental procedures). Microtome‐generated ultra‐thin (70 nm) sections were analysed by transmission‐electron microscopy. Tight‐contact sites without ThO2 label are marked (black arrows). White arrows indicate ThO2 labelling between neighbouring hyphae. The pictures (A) and (B) (bar in B), (C) and (D) (bar in D), (E) and (F) (bar in F), and respectively (G) and (H) (bar in H) have been magnified correspondingly. Two different magnifications are presented for the WT (C and E) and for ΔH (D and F).
The HyaS protein is dominantly associated to substrate hyphae
We generated an Escherichia coli transformant producing high levels of a designed HyaS fusion protein. After its purification (see Experimental procedures) antibodies were raised. As revealed by immune‐fluorescence microscopy, the substrate hyphae of the WT strain reacted with antibodies (Fig. 3A) in contrast to those of the ΔH mutant (Fig. 3B). These data revealed that the generated antibodies were suitable to detect the presence of the HyaS protein.
The deduced S. lividans HyaS protein contains a predicted signal peptide (39 aa, see arrow for the predicted cleavage site in Fig. 1). The resulting mature protein has a deduced molecular weight of 57.8 kDa. Using the generated antibodies, three forms of HyaS, corresponding to the mature protein and two truncated subtypes, were found in the concentrated culture filtrate (Fig. 3C, lane 5). Having determined the N‐terminal amino acids, it was deduced that one truncated form comprised the N‐terminal part (without signal peptide aa 39–351) and the other one the C‐terminal part (aa 352–585).
As the total amount of HyaS within the culture filtrate was relatively low, its association to mycelia was tested. Proteins, which were detectable with the anti‐HyaS antibodies, could be released by three successive washes in the presence of 100 mM NaCl (Fig. 3C, lanes 1–3). These comprised little full‐length HyaS protein (57.8 kDa), and also various truncated (about 50–25 kDa) and larger (up to 70 kDa) forms in different ratios.
Immunological studies confirmed that the ΔH mutant lacks the HyaS protein within the culture filtrate (Fig. 3C, lane 6), or in the wash fraction from the substrate hyphae (Fig. 3C, lane 4).
The WT and the ΔH mutant differ in the aggregation mode of substrate hyphae
During growth as standing cultures, the S. lividans WT and the disruption mutant ΔH formed similarly extended networks of substrate hyphae. However, within the WT mycelia more patches of locally condensed areas appeared. Transfer of the cultures to shaking conditions led to formation of aggregates of hyphae. Those of the WT strain were, however, moved more rapidly towards the bottom, when shaking was terminated (not shown). Microscopic inspections revealed that after 6–8 h of shaking the hyphae networks started to show locally condensed areas, which appeared to fuse (visible as dark lines in Fig. 4A). Upon extending the shaking time (17–20 h), the WT clumps often consisted of cylindrically shaped and highly condensed packages (width up to 70–100 µm and length up to 120–150 µm), which interacted to form larger aggregates extending to more than 500 µm in diameter (Fig. 4B).
In contrast, the hyphae of two independent mutant ΔH colonies formed during the first 6–8 h of shaking networks (Fig. 4C), the condensation degree of which was lower than those the WT (Fig. 4A). After 17–20 h of shaking, heterogeneously shaped and sized pellets of ΔH (Fig. 4D), which fused less frequently (than those of the WT, Fig. 4B), dominated. The ΔH packages had a considerably higher number of bunches of hyphae protruding (Fig. 4D) from the pellets than those of the WT (Fig. 4B). In contrast to the WT (Fig. 4E and F), the aggregates of the mutant ΔH did not react with the antibodies (Fig. 4G and H).
The ΔH mutant is complemented by a plasmid carrying the hyaS gene, and regains the ability to produce HyaS
The hyaS gene including its regulatory upstream region was cloned into the bifunctional vector pWHM3 to give the construct pHY11 (Fig. 5K and Table 1). The growth properties of ΔH with the control vector pWHM3 (Fig. 5J) under standing (Fig. 5C) or shaking conditions (Fig. 5F) corresponded to those of ΔH (Figs 3B and 4C and D). In contrast, the presence of the plasmid pHY11 dramatically altered the characteristics of the ΔH mutant. In standing cultures, substrate hyphae of ΔHpHY11 (Fig. 5B) appeared in several areas more tightly associated than those of the control ΔHpWHM3 did (Fig. 5C). During shaking for 19 h, the strain built densely appearing pellet packages from which individual hyphae were barely protruding (Fig. 5E). Overall, the appearance resembled S. lividans WT, which had been cultivated under standing (Fig. 3A), or under corresponding shaking conditions (Fig. 4B), or its transformant with the control vector leading to WTpWHM3 (Fig. 5A and D). The hyphae of ΔHpHY11 also interacted with anti‐HyaS antibodies as revealed by immune‐fluorescence microscopy (data not shown). As shown by transmission‐electron microscopy, HyaS was detectable with primary anti‐HyaS antibodies and secondary gold‐labelled antibodies at the hyphae margins of WTpWHM3 (Fig. 5G) and those of ΔHpHY11 (Fig. 5H), but rarely of ΔHpWHM3 (Fig. 5I). The linear density of gold labels corresponded to 6.5 (±2) µm for WTpWHM3, 1.4 (±0.5) µm for the control ΔHpWHM3 and 17 (±3) µm for ΔHpHY11. The data clearly show that the hyaS containing pHY11 construct complements the chromosomal defect in the ΔH mutant.
HyaS provokes tight contact sites among substrate hyphae
Recently, we showed that colloidal Thorotrast (ThO2) can be used to label the surface of Streptomyces substrate hyphae (Hegermann et al., 2008). Having applied this method (see Experimental procedures), subsequent inspection by electron microscopy revealed concise, very tight‐appearing contact at specific sites among neighbouring WT substrate hyphae. As a result, these contact sites (Fig. 6C and E, see black arrows) were devoid of ThO2 labels in contrast to the non‐contacting ones.
ThO2 labelled the surface of the ΔH substrate hyphae continuously, even if they were very close to each other (Fig. 6D and F, see white arrows). The presence of thiostrepton (to maintain selection for the plasmid) did not alter the properties of ΔHpWHM3 compared with ΔH (Fig. 6H). The presence of the multicopy plasmid pHY11 (containing hyaS) within the ΔH mutant also resulted in very close fitting among the hyphae (Fig. 6G, see black arrow), which corresponded to that among the WT hyphae (Fig. 6C).
The C‐terminal domain of HyaS has in vitro enzyme activity
The C‐terminal region of HyaS is more conserved among HyaS‐like proteins (Fig. 1). Interestingly, several amino acids within the C‐terminal domain of HyaS are also present within lysyl oxidases, submembers of the monoamine oxidase family (for details see Discussion). Therefore, we screened for a putative catalytic activity of HyaS. As a prerequisite, a truncated gene, named hyaSc, encoding the C‐terminal part (aa 352–585) of the WT HyaS protein, was cloned (see Experimental procedures) into the pASK‐IBA7 vector, and led to the pASK‐CH11 containing E. coli strain. The HyaS homologue of Nocardiopsis JS614 (Fig. 1 and Discussion) lacks the histidine residue corresponding to the S. lividans H488 that is present within each of the Streptomyces homologues (Fig. 1). Therefore, the codon for H488 was exchanged with one for alanine in the truncated hyaSc, and this resulted in the construct pASK‐CH13 (Table 1). The cytoplasmic extract of each designed E. coli strain served to isolate each of the soluble fusion proteins by affinity chromatography (see Experimental procedures).
Upon incubation with 1,5‐diaminopentane, a commonly used artificial amine substrate, the production of H2O2 was detectable by the coupled action of horseradish peroxidase in the presence of Amplex Red (10‐acetyl‐3,7‐dihydroxyphenoxazin), only in the presence of each of the two isolated native proteins. The control assay contained all compounds without or with an inactive protein. The resulting resorufin has a red fluorescence (emission 590 nm, see Experimental procedures). The activity of 1 µg of WT Streptag‐HyaSc corresponded to 0.28 mU. In contrast, the mutant HyaScA488 protein had a 42% reduced activity. Based on these results, we concluded that the C‐terminal part of HyaS has amine oxidase activity, which is reduced after the exchange of the codon for H488 by one for alanine.
ΔH mutants harbouring a differently mutated hyaS gene vary as to in vivo enzyme activity and in pellet type
To test whether the presence of full‐length HyaS provoked the production of H2O2 based on an endogenous, but so far unknown substrate within the natural host, pre‐grown hyphae of transformants of ΔH were exposed to 3,3′ diaminobenzidine (DAB), which is known to polymerize in the presence of H2O2 (Rea et al., 2002). The hyaS‐negative strain ΔH with the control plasmid pWHM3 (Fig. 7C) appeared light yellowish (i.e. background). In contrast, the WT strain with the control plasmid pWHM3 (Fig. 7A), contained among lighter brown pellets a high portion that stained intensively red‐brown, reflecting high level of generated H2O2. The data indicated that the presence of the hyaS gene in the WT strain provoked this feature.
Figure 7.

In situ detection of H2O2, and features of relevant plasmids. A–E. To pre‐grown cultures of each indicated strain DAB was added, and incubation continued during shaking for 17 h. Subsequently samples were photographed. The bar 1 mm (in E) presents the magnification for the pictures (A)–(E). F–K. Samples of substrate hyphae of each strain were incubated with 5 mM CeCl3, embedded, and the arising precipitates were analysed by using a transmission‐electron microscope. As control, the strain ΔHpHY11 (K) was not treated with CeCl3. The pictures (F)–(K) correspond in the extent of magnification (see bar in J) A–K. The strains WT pWHM3 (A and F), pHY11 (B, G and K), ΔH pWHM3 (C and H), pHY12 (D and I) or pHY13 (E and J) were used. L. The position of the WT hyaS gene within the pHY11 construct is presented. M and N. The position for exchange(s) of the three histidine codons by those of alanine (A441, A443, A445) in the pHY12 construct (M), or of the histidine codon by alanine (A488) within pHY13 (N) is shown.
Based on this result, the ΔH strain was complemented either with the plasmid pHY11 (containing the full‐length hyaS gene and its upstream region, see Fig. 7L) or with its derivative pHY13 (carrying the codon 488 A instead of H, Fig. 7N). In addition, three consecutive codons for H441, H443, H445 (found within all HyaS homologues) were replaced simultaneously with three codons for alanine; the resulting construct was pHY12 (Fig. 7M). After exposure of pre‐grown hyphae to DAB, the staining among the pellets of ΔHpHY12 and ΔHpHY13 was heterogeneous, and the overall number of darker stained pellets was lower than for ΔHpHY11. The proportion of red‐brown pellets was higher for ΔHpHY13 than for ΔHpHY12 (Fig. 7D and E). Taken together, the results indicated that the production of H2O2 was the highest in the presence of the WT hyaS gene (construct pHY11), and was most reduced in the strain carrying pHY13, encoding HyaSA441–A443–A445.
Cerium chloride reacts with H2O2 to form the electron‐dense cerium perhydroxide (Ohno et al., 1982). Highly compact deposits (diameter 0.12–0.25 µm) were abundant in the vicinity (0.02–0.5 µm) of the hyphae of WTpWHM3 and ΔHpHY11 (Fig. 7F and G). Those of ΔHpHY13 (Fig. 7J) appeared evenly (diameter 0.025–0.06 µm) at the margins of the hyphae and within the adjacent region (up to 0.5 µm). The electron‐dense material was most abundant as a ring (width 0.01–0.025 µm) at the hyphae margins of ΔHpHY12 (Fig. 7I), suggesting that the mutant protein HyaSA441–443–445 might be closer associated to the margin. The loose needle‐like precipitates in the background of ΔHpHY12 corresponded to that of the control strain ΔHpWHM3 (Fig. 7H). These must be due to activities, which are unrelated to HyaS. The control hyphae (without exposure to cerium chloride) lacked precipitated material (Fig. 7K). These studies confirmed that the in situ generation of H2O2 was the highest for WT HyaS, second highest for HyaSA448, and most reduced for HyaSA441–443–445. The patterns of the precipitates present only relative differences, and cannot be exactly quantified (Ohno et al., 1982).
As turbidity measurements are not conclusive to investigate cultures of Streptomyces mycelia, pre‐cultivated strains were transferred to optimized shaking conditions (145 r.p.m.), and the flasks were inspected microscopically. After 20 h, the substrate hyphae of ΔHpHY11, ΔHpHY12 and ΔHpHY13 (Fig. 8B–D) formed more fused pellets compared with those the control ΔHpWHM3 strain (Fig. 8A). Pellets of ΔHpHY12 and ΔHpHY13 were more roundish. The pigmentation of all strains appeared similar. After further 40 h of cultivation, the pellets of ΔHpHY13 (Fig. 8H) were the most irregular as to shape and size, and they had more fused packages than those of ΔHpHY11 (Fig. 8F). Pellets of ΔHpHY12 (Fig. 8G) had the smallest diameter, and they comprised roundish and elongated ones. In addition, they had fewer fusion sites than those of ΔHpHY11. The aggregates of the control strain ΔHpWHM3 (Fig. 8E) had larger diameters than those of ΔHpHY11 and ΔHpHY12 and lacked close contact sites. The degree of pigmentation appeared most pronounced for ΔHpHY11 and ΔHpHY13. Following prolonged cultivation (120 h) the pellets of ΔHpHY12 (Fig. 8K) and ΔHpWHM3 (Fig. 8I) were transparent, and their diameter diminished compared with 40 h. In addition, a pronounced cloudy‐like background was present; this was due to masses of individual hyphae and small mycelia (Fig. 8I and K). The pellet clumps of ΔHpHY13 (Fig. 8L) were more compact, and patches within them were more coloured compared with those of ΔHpHY11 (Fig. 8J). These features correlated with fewer individual hyphae and small mycelia. Taken together, the pellets of ΔHpHY13 were even more stable than those ΔHpHY11.
Figure 8.
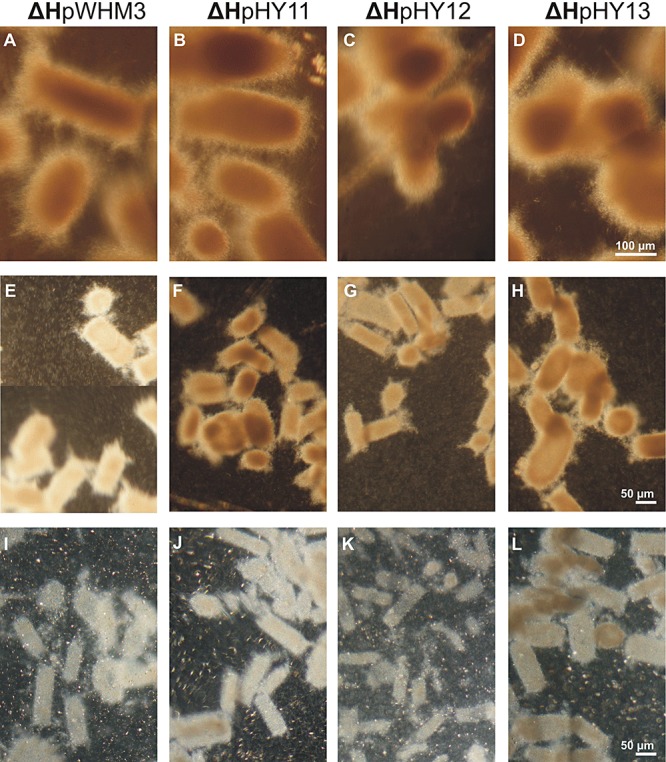
Physiological analyses of the S. lividansΔH transformants complemented with a different plasmid type. The ΔH strains with the control plasmid pWHM3 (A, E and I), with pHY11 (B, F and J), pHY12 (C, G and K) or with pHY13 (D, H and L) were grown for 19 h, and subsequently shaken for 20 h (A–D), 40 h (E–H) or 120 h (I–L). The samples were analysed by phase‐contrast microscopy. The magnification of the pictures (A)–(D) (bar in D), (E)–(H) (bar in H) and (I)–(L) (bar in L) is indicated.
The pellet type influences the level of the red pigment undecylprodigiosin
The culture filtrates of all four strains lacked a specific coloured pigment, and had no difference within their spectra (250–800 nm, data not shown).
The mycelia of the control ΔHpWHM3 had a red brown (Fig. 9I, A), whereas that of ΔHpHY12 (Fig. 9I, D) had a more reddish colour. In addition, the corresponding acidified chloroform extracts of the mycelia revealed three peaks (Fig. 9II, A and D). The value of the most pronounced peak (540 nm) was about three times higher for ΔHpHY12 (Fig. 9II, D) than for ΔHpWHM3 (Fig. 9II, A). Earlier studies had revealed that undecylprodigiosin, a typical red pigment of S. lividans, has in acidified chloroform a characteristic absorption maximum at 540 nm (Kim et al., 2007). The results of thin‐layer chromatography confirmed the presence of the red pigment (Fig. 9III, A and D). In contrast, the mycelia (Fig. 9I, B and C) of ΔHpHY11 and the ΔHpHY13 had a yellowish appearance, which lacked chloroform‐extractable compounds (Fig. 9III, B and C). The data show that the level of mycelia‐associated undecylprodigiosin was the highest or second highest, if the hyaS gene was mutated (to lead to HyaS with three histidine exchanges) or absent.
Figure 9.
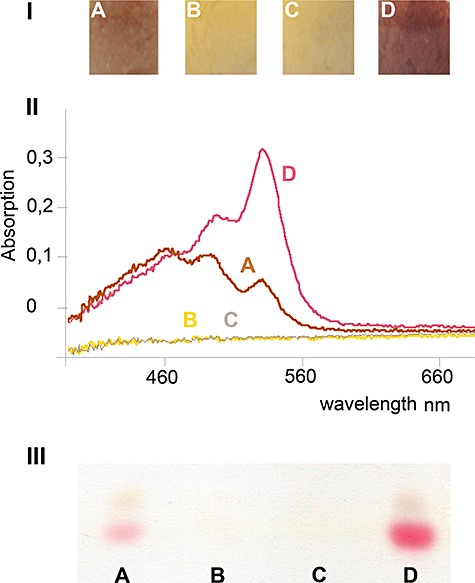
Production of metabolites by S. lividansΔH transformants complemented with a different plasmid type. The ΔH mutants with the control plasmid pWHM3 (A), pHY11 (B), pHY13 (C) or pHY12 (D) were pre‐grown as standing culture, and subsequently shaken for 58 h (A–D). The pellets were photographed under visual light (I), then extracted with chloroform. After acidification, each spectrum was investigated II)). Subsequently, each extract was subjected to thin‐layer chromatography (III).
Discussion
During cultivation in liquid media, hyphae of many Streptomyces strains frequently form a tangled network leading to aggregates, or clump‐like structures, named pellets (Reichl et al., 1992; Fang et al., 2000; Jonsbu et al., 2002; Rosa et al., 2005). To summarize our findings, we have discovered, for the first time, in S. lividans WT a novel protein as one key factor affecting hyphae aggregation (hence named HyaS). The HyaS protein was mainly immunodetectable on the substrate hyphae and in smaller quantities in the culture medium. The presence of a twin‐arginine motif within the signal peptide indicates the probable secretion of HyaS via the Tat‐transport system, previously identified within streptomycetes (Schaerlaekens et al., 2004). The designed disruption of the chromosomal hyaS gene resulted in the viable mutant ΔH, which differentiated like the WT strain. During shaking, it formed heterogeneous networks comprising areas with loosely associated hyphae and irregularly shaped aggregates. These were often fluffy and had protruding bunches of hyphae. In contrast, the WT substrate hyphae formed many cylindrically shaped and compact packages, strongly adhering to each other, and thus large aggregates arose. The ΔH transformants carrying a plasmid with the hyaS gene regained the HyaS‐induced feature. These data clearly demonstrated the relevance of HyaS for building compact pellets.
Inspection of data banks, DNA–DNA hybridizations and PCR analysis revealed the abundance of hyaS within streptomycetes. To date, the only distantly related homologue is present within the recently sequenced genome of Nocardioides sp. JS614, which had been isolated from soil to utilize vinyl chloride and ethene (Mattes et al., 2005). Like streptomycetes, members of the genus Nocardioides belong to the actinobacteria. However, their substrate hyphae break up into ‘nocardioform’ fragments. In future, it will be interesting to elucidate the role of this HyaS homologue, as it diverges within the N‐terminal part, and lacks a large central region (Fig. 1), which is present within all Streptomyces homologues. In contrast, Thermobifida fusca (family Thermomonosporaceae), which grows in non‐fragmenting vegetative mycelia, and Saccharoployspora erythraea (family Pseudonocardiaceae) forming substrate hyphae, which tend to fragment, lack a HyaS homologue. Saccharoployspora erythraea was initially isolated from sugar bagasse, and T. fusca was gained from composts. Obviously, these actinobacteria do not need a HyaS homologue within their natural niche. A hyaS homologue is absent within all the other so far sequenced pro‐ and eukaryotic genomes. These data reinforce the view that HyaS must have a particular role, relating specifically to features of streptomycetes.
Substrate hyphae of various filamentous fungi including Aspergillus strains form different types of pellets. During fermentations in bioreactors, the type of pellets affects the supply of oxygen and nutrients considerably (Hille et al., 2005; Oncu et al., 2007). Several mathematical models explain pellet formation, but clues on the molecular level are still missing. Within the sequenced genomes of filamentous fungi, including Aspergillus species, an encoded HyaS homologue is absent. As the cell walls of fungi differ considerably from those of streptomycetes, this finding was expected. Cell–cell adhesion has been observed at the end of fermentations between yeast cells, leading to macroscopic flocs comprising thousands of cells (see review Verstrepen and Klis, 2006). Adhesion is mediated by cell‐surface proteins (named adhesins or flocculins), which share a common domain structure. A GPI (glycosylphosphatidylinositol) anchor mediates linkage to the yeast cell wall and the N‐terminal region often comprises a carbohydrate‐ or peptide‐binding domain.
HyaS lacks a motif for sortase‐dependent anchoring to the peptidoglycan, which was found to be required for attachment of a novel Streptomyces carbohydrate‐binding protein (Walter and Schrempf, 2008). A hydrophobic transmembrane domain, which could provoke an interaction with the cytoplasmic membrane, is not predicted. Likewise, HyaS lacks a deduced region corresponding to a LysM domain (see review Desvaux et al., 2006), which could mediate the direct binding to murein. No specifically ordered regions including β sheet‐rich regions are identifiable with prediction programmes. The presence of cysteine residues within HyaS might lead to intra‐ and inter‐molecular S–S bridges.
As revealed by electron microscopy, ThO2 labelled the surfaces of the WT and ΔH substrate hyphae relatively evenly. This compound had been reported to bind to negatively charged biopolymers including the lipopolysaccharide layer of Pseudomonas aeruginosa (Lünsdorf et al., 2006), and was also found to interact strongly with S. lividans substrate hyphae (Hegermann et al., 2008). Beside peptidoglycan, Gram‐positive bacteria contain ‘secondary’ cell‐wall polymers including teichoic acids, teichuronic acids, and other polysaccharides of mostly unknown structure (see review Desvaux et al., 2006).
Noticeably, between S. lividans WT hyphae, compression‐like contact sites were frequently present, and strikingly, these were devoid of ThO2. In contrast, contact areas among ΔH hyphae appeared random, and were stained with ThO2. This observation hinted at an enzymatic action of HyaS with other compounds or protein(s). Interestingly, the C‐terminal region (aa 440–478 and 513–538) of the deduced HyaS shares the relative spacing of a few amino acids and two short motifs, which have been deduced for the catalytic activity of lysyl oxidases, submembers of the monoamine‐oxidase family (Jalkanen and Salmi, 2001). The oxidative deamination of an amine by an amine oxidase leads to the corresponding aminoaldehyde, NH3 and H2O2. We showed that recombinant protein corresponding to the C‐terminal domain of HyaS (shortened HyaSc) generated H2O2 from a model amine (i.e. 1,5‐diaminopentane). In situ production of H2O2, promoted by an endogenous, so far unknown substrate, was confirmed by the generation of cerium perhydroxide or polymers of dianinobenzidin (Fig. 7). This reaction was most pronounced, if the complete hyaS gene (within the plasmid pHY11) was present in the StreptomycesΔH strain. This activity was the lowest for ΔHpHY12, and this correlated with a very pronounced reduction in pellet building. Thus, the histidine residues H441–H443–H445 are highly important for in vivo activity. In contrast, the exchange of H448 to A led to more stable pellets. Possibly, this mutated protein might interact better with its natural (so far unknown) in vivo substrate(s).
The human lysyl oxidase prototype (LOX) initiates the covalent cross‐linking of collagen or elastin in the extracellular space. The human vascular adhesion protein‐1 (VAP‐1) is involved in leucocyte subtype‐specific rolling under physiological shear (Jalkanen and Salmi, 2001). However, its leucocyte surface recognition site is still unknown. With model substrates, VAP‐1 also has an amine oxidase activity; however, despite intensive searches, the in vivo substrate is still obscure. After wounding, plants have many responses including the oxidative deamination of various biological amines, which is due to copper amine oxidase activity. The resulting production of H2O2 has been correlated with many effects including suberization, and cell‐wall polymer cross‐linking (Rea et al., 2002). Taken these and our data into account, we suggest that HyaS has adhesion properties, and that its amine oxidase activity either induces directly or indirectly cross‐links with other hyphae‐associated protein(s) or other compound(s). Given the abundance of the hyaS gene, it is likely to play also a relevant role for streptomycetes within their natural environment, dominantly different soil types. Here, due movements of different type of particles and varying degrees of moistures, turbulences and frictions will occur, under which the ability to form stable pellets will be an advantage.
Interestingly, within the more loose pellets of ΔHpHY12, the production of undecylprodigiosin was the highest, and it is absent in ΔHpHY11 and ΔHpHY13. Thus, the genetic modification of the hyaS gene is an efficient tool to engineer the pellet type as well as the level of a secondary metabolite. The reported findings are also a useful molecular basis to manipulate other Streptomyces strains in a designed fashion.
Experimental procedures
Strains and plasmids
Streptomyces lividans 66 [in the text designated as Streptomyces lividans WT (S. lividans WT)] (Hopwood et al., 1985), its designed mutant ΔH and transformants (see Table 1) were used. Additionally, Streptomyces ambofaciens (collection DSMZ, Braunschweig, Germany), S. antibioticus, S. azureus, S. rimosus (previous from gifts D.A. Hopwood, Norwich and J. Pigac, Zagreb), S. olivaceoviridis (Zeltins and Schrempf, 1997), S. reticuli (Schlochtermeier and et al., 1992) and S. venezuelae (a previous gift from L.C. Vining, Halifax) were tested. Escherichia coli strains were DH5α (Villarejo et al., 1972), XL1 Blue (Sambrook et al., 1989), M15 pREP4 (Qiagen). Escherichia coli vectors pQE32 (Qiagen), pEGFP1 (Clontech), pASK‐IBA7 (IBA), and the bifunctional E. coli–Streptomyces shuttle vector pWHM3 (Vara et al., 1989) were used. The pBR322 derivative containing the hygromycin‐resistance cassette (pH45Ωhyg, Blondelet‐Rouault et al., 1997), pGM160, a bifunctional derivative of the temperature‐sensitive Streptomyces plasmid pGS5 (Muth et al., 1995), and pUC18 (Vieira and Messing, 1982) were used. The S. lividans genomic library in λ Charon 35 propagated in E. coli K802, and its subclones had been described earlier (Betzler et al., 1987).
Media and standard culture conditions
Escherichia coli strains and their transformants were grown on agar plates or LB liquid media) in the presence of ampicillin (100 µg ml−1). (Sambrook et al., 1989). Spores (5 × 10⁶ ml−1) of each S. lividans strain were inoculated in complete media (Schlochtermeier et al., 1992) in Erlenmeyer flasks and cultivated with (145 r.p.m.) or without shaking for the indicated periods of time at 30°C. To generate spores, the S. lividans strains were grown on complete medium containing agarose until sporulation occurred (Hopwood et al., 1985). After removal with sterile water, spores were filtered through cotton, and counted. The spore suspensions (2.5 × 10⁹ spores ml−1) were stored at −20°C in 40% glycerol.
Chemicals and enzymes
Chemicals for SDS gel electrophoresis were from Serva, Heidelberg, Germany. The secondary antibodies – coupled with alkaline phosphatase or labelled with gold (10 nm) – were purchased from Sigma Aldrich (Steinheim, Germany), the anti‐rat Alexa Fluor 647 secondary antibodies were from Molecular Probes (Leiden, the Netherlands), the Lowicryl‐K4M resin was from Polysciences (Warrington, USA), and low‐viscosity epoxy resin (mixture: ‘hard’) was from Agar Scientific (Essex, UK). Other chemicals were from Sigma. Enzymes were from Biolabs, Roche, Fermentas, Introgen or Gibco.
Isolation of DNA, hybridizations, DNA sequencing and computer analysis
Total DNA was gained from S. lividans as described (Betzler et al., 1987), cleaved with a range of restriction enzymes. Hybridization and immunological detection were carried out according to the standard procedures (Sambrook et al., 1989; Schlochtermeier et al., 1992).
Sequencing was performed as described (Schlochtermeier et al., 1992). Sequence entry, primary analysis and ORF searches were performed using Clone Manager 5.0. Database searches using the PAM120 scoring matrix were carried out with blast algorithms (blastx, blastp and tblastn) on the NCBI file server (blast@ncbi.nlm.nih.gov) (Altschul et al., 1997). Multiple sequence alignments were generated by means of the clustal w (1.74) program (Higgins et al., 1992). Putative Shine–Dalgarno (ribosome binding) sites (Gold et al., 1981; Strohl, 1992) and signal peptide cleavage sites (Nielsen et al., 1997) were predicted as described.
Fusion of the promoter region of hyaS with the egfp gene
The egfp was amplified from the pEGFP1 vector (Clontech) using the following primers: pREGfpxb CACTCAACCCTATCTCGG and pREGFPmp CGCCACCATGCATAGCAAGGGCGAGGAGCTG. The PCR product (1109 bp), cut with Mph1103I and EcoRI, was cloned into a bifunctional pWHM3 derivative containing an additional polylinker. The upstream region of hyaS including 27 bp of hyaS gene was amplified with the primers: Pksulm1 CAGTGGATGCATCAGCCGGGTGGTGCGCG and Pksulb2 GCCGCGCAGATCTCGGACCTCCCGCTC. After the restriction with BglII and Mph1103I, the resulting DNA fragment (878 bp) was ligated with the correspondingly digested derivative of pWHM3 (containing extra inserted cloning sites).
Cloning of the hyaS fusion gene, isolation of the fusion protein and generation of antibodies
A 1.76 kb SphI/HindIII‐containing hyaS was cloned into the correspondingly cleaved pQE32. Escherichia coli XL1 Blue transformants were selected on agar plates containing ampicillin (100 µg ml−1). The designed construct pQE316 was introduced into E. coli M15 pREP4. The resulting transformant was inoculated in LB medium with ampicillin (100 µg ml−1) and kanamycin (25 µg ml−1). During its logarithmic growth phase (OD600 0.8) 1 mM IPTG was added for 4 h. The cells were washed with a chilled PBS buffer and disrupted by ultrasonication. After centrifugation (16 000 g, 25 min, 4°C), the debris and the inclusion bodies were gained. The pellet was treated with PBS buffer containing 10% Triton X‐100. After centrifugation (16 000 g, 25 min, 4°C) the supernatant containing the solubilized fusion protein was purified by affinity chromatography using Ni2+‐NTA (Qiagen). To remove contaminating inpurities, the gained protein was seperated by a preparative 12.5% SDS‐PAGE. The pure fusion protein was isolated by subsequent electroelution, and was concentrated (to about 0.45 mg ml−1) by using an Amicon device. The isolated protein (150 µg) was used to generate antibodies in rat (EUROGENTEC, Belgium). The antisera were stored in aliquots at −20°C.
Generation of designed disruption mutant ΔH
Using PCR and the primers, PrkIHin GCTGGCAAGCTTGCCGGACGCCGAACCGC including one HindIII site, and PrkISna CGACCGTACGTATGCCTGTGAGCAGTGGAC including one SnaBI site, as well as PrkIISna CTGCCTTACGTACACCGACGCGATCGAC including one SnaBI site and PrkIIKpNc GGGGTGGGTACCATGGGCGACGCGGCCCACC including one KpnI and one NcoI site, two fragments (each ≈ 700 bp) corresponding to each end of the hyaS gene were generated. After restriction with the enzymes, SnaBI and KpnI, the fragments were cloned into the E. coli vector pUC18 (cleaved with HindIII and KpnI). The resulting plasmid construct was cleaved by SnaBI and ligated with a DraI fragment comprising the hygromycin‐resistance cassette (Ωhyg). After transformation, the resulting plasmids were isolated from E. coli XL1 Blue. The construct pUTSL1H comprising Ωhyg in the same orientation as the flanking sequences of the residual hyaS gene served for further studies. A HindIII/NcoI from the pKTSLH1 construct was ligated into the HindIII/NcoI‐cleaved bifunctional pGM160 vector. The resulting correct pGMLR construct was mixed with protoplasts of S. lividans. After their regeneration, selection occurred at 30°C for resistance against thiostrepton (25 µg ml−1). To abolish the autonomous replication of pGMLR, thiostrepton‐resistance colonies were replica‐plated onto complete medium containing hygromycin (50 µg ml−1) and incubated at 37°C until sporulation occurred. Total DNA was isolated from resulting colonies and then cleaved with NocI and PvuI. Hybridizations (see one previous subsection) were performed with a DIG‐labelled fragment carrying the hygromycin‐resistance cassette, and with a fragment comprising the hyaS gene.
Cloning of a truncated and mutated hyaS (hyaSc) gene, and isolation of the Streptag‐HyaSc proteins
The gene portion encoding the C‐terminal part of HyaS (HyaSc) was amplified by PCR with the Pfu polymerase. The primers carried sites for BamHI and HindIII, and their sequences were as follows: BamHfor CAATGGATCCTCCGTCCCGGACGTC and Hindrev GACAAGCTTGTTCGCGTTCACCAG. After restriction with BamHI and HindIII, the amplified fragment was cloned into the respectively cleaved pASK‐IBA‐7. The resulting construct pASK‐CH11 (Table 1) was gained from an E. coli XL1 Blue transformant, and it was also used as a template for mutagenesis. The exchange of the codon for H488 by one for alanine was performed by PCR in two steps. The primers His448for 5′‐AACGCCAACTGGGCCCCGTTCAACACC and His448rev 5′‐GGTGTTGAACGGGGCCCAGTTGGCGTT, as well as the external primers (BamHfor and Hindrev, see above), were used. Two fragments were obtained: the first one from the beginning of the gene to the site of mutation, and the second one from the site of the mutation to the end of the gene. The purified fragments were used as a template in the second PCR with the external primers. The mutated hyaSc gene was cloned into the restricted (BamHI and HindIII) pASK‐IBA‐7, and led to the construct pASK‐CH13 (Table 1).
To gain the fusion protein, the selected transformant (E. coli XL1 Blue containing either pASK‐CH11 or pASK‐CH13) was grown at 37°C in 100 ml of LB medium (Sambrook et al., 1989) until OD600 0.6 was reached. Anhydrotetracycline was added to a final concentration of 200 ng ml−1. Cells (from 100 ml) were harvested usually after 2 h of growth at 30°C, suspended in 1 ml of 100 mM Tris/HCl pH 8.0, 150 mM NaCl and sonicated (Branson sonifier). After centrifugation (19 000 g, 10 min, 4°C), the supernatant was mixed with Streptactin agarose (100 µl) and kept shaking for 1 h at 4°C, and then poured into an empty column. Unspecifically bound proteins were removed with (twice 200 µl) 100 mM Tris/HCl buffer, pH 8.0, comprising subsequently 150, 600 and 800 mM NaCl. Having equilibrated the column with 100 mM Tris/HCl pH 8.0 in the presence of 150 mM NaCl, desthiobiotin (final concentration 2.5 mM) was added to the same buffer in order to remove the desired Streptag protein with six consecutive washes (100 µl each). An aliquot (5–20 µl) of each fraction was analysed using SDS‐PAGE after staining with Coomassie Blue.
Test for in vitro enzyme activity
The concentration of purified fusion proteins was determined (Laemmli, 1970). To detect H2O2, samples, each comprising 1 µg of protein, were analysed with the Amplex Red kit (Molecular probes, Eugene, USA). It comprises the substrate 1,5‐diaminopentane (as substrate for amine oxidase activity), horseradish peroxidase and Amplex Red (10‐acetyl‐3,7‐dihydroxyphenoxazin) in 50 mM sodium phosphate pH 7.4 buffer. In the presence of arising H2O2, the peroxidase converts Amplex Red to resorufin, which is detected after excitation (530 nm) due to its fluorescence emission (590 nm), if H2O2 is formed. The control assay contained all compounds without or with an inactive protein. One unit of enzyme activity is defined as the quantity of released H2O2 (in nm) per 1 µg of the protein in 1 h.
Generation of S. lividans strains with the plasmid pWHM3, pHY11, pHY12 and pHY13
DNA fragments comprising the hyaS gene with its flanking regions had been previously subcloned in our laboratory (unpublished) in the E. coli vector pAYC184, and in frame of this work into the bifunctional E. coli–Streptomyces vector pWHM3 (Vara et al., 1989). The resulting pWHM3‐based construct (pHY11) contained the hyaS gene with its upstream region as a SgfI/SstI fragment (3.3 kb). Streptomyces lividans WT or ΔH was transformed (Hopwood et al., 1985) with the plasmid pHY11 or pWHM3 (control). Plasmid DNA was isolated from the thiostrepton‐resistent colonies, and analysed with restriction enzymes for the presence of the correct plasmid.
The simultaneous exchange of the three codons for histidine (H441, H443, H445) to those of alanine, or the individual exchange of H488 to alanine was performed by PCR in the two steps using the primers for each of the designed mutation and the external primers (BamHfor and Hindrev, see previous subsection). The primers for substitution of H441–H443–H445 and respectively H488 were: His441,443,445for 5′‐CCGCGTCCGGGGGCCGTGGCCTGGGCCTTCACCGACTTC and His441,443,445rev 5′‐GAAGTCGGTGAAGGCCCAGGCCACGGCCCCCGGACGCGG, as well as His448for 5′‐AACGCCAACTGGGCCCCGTTCAACACC and His448rev 5′‐GGTGTTGAACGGGGCCCAGTTGGCGTT. Each mutated PCR‐generated portion of the hyaS gene was cleaved with BamHI and HindIII, and cloned into the restricted (BamHI and HindIII) pASK‐IBA‐7. The resulting constructs were isolated and cleaved with PvuII and SexAI. In parallel, the BamHI/HindIII fragment of pHY11 plasmid (Table 1 and Fig. 7, line L) was isolated and cleaved with PvuII and SexAI. The resulting BamHI/SexAI and PvuII/HindIII fragments were ligated with the PvuII/SexAI fragment containing each of the designed mutation, and then with the residual vector (BamHI/HindIII) part. Ampicillin‐resistent E. coli XL1 Blue transformants were analysed. The isolated plasmids pHY12 (leading to exchanges A441–A443–A445, Fig. 7, line M, and Table 1) or pHY13 (change to A488, Fig. 7, line N and Table 1) were inspected by restriction enzymes and sequencing. Selected correct plasmids were then transformed in the mutant ΔH, lacking a functional hyaS gene.
Isolation of extracellular proteins, separation of proteins, N‐terminal sequencing and immunological detection
The culture filtrate was precipitated with (NH4)2SO4 (90% w/v), the precipitate was suspended in 50 mM Tris/HCl buffer, pH 7.4 to achieve 20‐fold concentration. Using 12.5% SDS‐PAGE, aliquots of the re‐suspended proteins were separated. After transfer onto a PVDF membrane (Pall Europe), treatment followed with the primary anti‐HyaS antibodies (1:5000). Development occurred after incubation with secondary anti‐rat antibodies (1:10 000), conjugated with alkaline phosphatase, and with 5‐bromo‐4‐chloro‐3‐indole (Blake et al., 1984; Zeltins and Schrempf, 1997).
The detected protein forms (Fig. 3C) were analysed as to the N‐terminal amino acids (H.Hippe, Chromatec, Greifswald, Germany).
Immune‐fluorescence microscopy of HyaS
Aliquots of the mycelia of S. lividans WT or the ΔH mutant were placed onto microscope slides (three‐well type, 14 mm W/adhesion, Eric Scientific company, purchased via Menzel GmbH, Braunschweig, Germany), pre‐treated with 2% BSA in PBS for 30 min. Then, the samples were incubated with anti‐HyaS antibodies (diluted 1:200) for 60 min at room temperature. After 10 washings with PBS, the samples were treated with Alexa Fluor 647‐labelled secondary anti‐rat antibodies (diluted 1:500) for 60 min at room temperature. Samples were inspected by phase contrast or under UV light using the filter set for Cy5 (excitation: HQ 620/60, beam splitter: Q 660 LP, emission: HQ 700/75, Zeiss).
Immune‐electron microscopy of HyaS
The fixation of hyphae occurred in the presence of 0.25% glutaraldehyde and 3.7% paraformaldehyde overnight on ice. Subsequently, the hyphae were mixed 1:1 with 4% agar at 45°C, and then solidified on ice. Pieces (∼1 mM3 size) were dehydrated in methanol in ascending order: 15% and 30% at 4°C, and then 50%, 70%, 90%, and finally twice 100% at −20°C. The dehydrated pieces were subsequently stepwise embedded in increasing concentrations of Lowicryl‐K4M resin in methanol (Roth et al., 1981). Polymerization took place under UV irradiation for 24 h at −20°C, and then 1–2 days at room temperature. Ultra‐thin sections (70 nm), gained with an ultra‐microtome (Ultracut E, Reichert‐Jung) and a diamond knife (45° Diatome, Reichert‐Jung), were collected on 300‐mesh nickel grids with Formvar film. Each of them was placed onto a drop of PBS (40 mM disodium hydrogen phosphate, 8 mM sodium dihydrogen phosphate, 150 mM sodium chloride, pH 7.4). Each grid was incubated for 5 min on a drop H2O2 (10%, v/v), and then on a drop of 5% skim‐milk powder (in H2O) for 20 min. After exposure to distilled water for 15 s, incubation with the primary anti‐HyaS antibodies (1:200 in PBS buffer) followed for 1.5 h at room temperature. After two steps of washing with PBS comprising Tween 20 (0.05% v/v), the grid was incubated with secondary gold‐labelled (10 nm) antibodies (1:40 in PBS) for 1 h. After washing with PBS‐Tween, the grid was incubated on a PBS‐Tween drop, and then on a drop of water for 5 min. Subsequently, exposure to 3% phosphotungstic acid (pH 7) occurred for 1 min, and treatment with water followed. Air‐dried samples were analysed in a Zeiss EM 902A and imaged using a digitalized camera.
ThO2 labelling of hyphae, embedding procedure, sectioning and analysis by transmission‐electron microscopy
Hyphae were fixed with 2.5% glutaraldehyde for 2 h on ice, and afterwards washed four times with 100 mM sodium acetate buffer, pH 4.5 (SAB). Hyphae were suspended in 0.4% Thorotrast (colloidal thorium dioxide, abbreviated as ThO2) in SAB as previously described (Lünsdorf et al., 2006), incubated for 30 min at room temperature, and were then washed 10 times in SAB buffer at room temperature. Samples were mixed 1:1 with 4% agar at 45°C, and solidified on ice. Pieces (∼1 mM3 size) dehydrated in ethanol were embedded in low‐viscosity epoxy resin. Ultra‐thin sections were gained with an Ultracut E (Reichert‐Jung) using a diamond knife (45° Diatome). Sections of 70 nm, cut at a speed of 1 mm s−1, were placed on 300‐mesh Formvar‐coated copper grids. These were analysed in a Zeiss EM 902A, and imaged using a digitalized camera.
In situ detection of H2O2 with DAB or cerium chloride
The compound DAB has been used widely (Rea et al., 2002) to score within biological samples for enzyme‐generated H2O2. Cultures of S. lividans strains were grown for 20 h. After the addition of buffered DAB (final concentration 1 mg ml−1), incubation continued during shaking for 16 h. Samples were inspected for polymerized DAB (brownish‐reddish) precipitates under visual light and photographed.
Previously, is had been documented that within biological samples, cerium ions can react with H2O2 to form an electron‐dense precipitate, cerium perhydroxide, which can be localized at the ultra‐structural site of interest (Ohno et al., 1982). After cultivation, S. lividans hyphae were gently washed three times with 50 mM morpholinopropane sulfonic acid (MOPS) pH 7.2, and incubated for 30 min in this buffer. Subsequently, the incubation with 5 mM CeCl3 (in MOPS) at room temperature followed for 1 h. The hyphae were washed twice with MOPS buffer, and treated with 2.5% glutaraldehyde (in MOPS) for at least 2 h on ice. After two washes with MOPS, hyphae were embedded in 4% agar. Dehydration and embedding in SPURR epoxy resin are described in the previous subsection. The ultra‐thin sections were incubated with 3% phosphotungstic acid (pH 7) for 30 min, and treatment with water followed. Samples were placed onto Formvar‐coated copper grids, and were analysed in a Zeiss EM 902A and imaged using a digitalized camera.
Analysis of undecylprodigiosin
The cultivation of the strains was performed in liquid medium (Kim et al., 2007). After pre‐incubation during standing at 30°C, they were transferred to shaking for 58 h. The spectrum (250–800 nm) of each culture filtrate was determined. After drying, the mycelia were extracted with chloroform. This was acidified with HCl (Kim et al., 2007), and after phase separation, the spectrum was determined. In addition, a sample was analysed by thin‐layer chromatography (Silica gel, Riedel de Haen, Germany) using the solvent mixture of chloroform : ethylacetate = 9:1).
Acknowledgments
A part of the work was financed by funds by the Gradudiertenkolleg 612 including the stipend to I. Koebsch. We thank J. Hegermann for supporting studies by electron microscopy during the initial stage, D. Ortiz de Orué Lucana for some advice during cloning, D. Müller for help in cultivating strains, B. Stumpe for spectroscopic studies and G.T. Hanke for refining the English.
References
- Altschul S.F., Madden T.L., Schäffer A.A., Zhang J., Zhang Z., Miller W., Lipman D.J. Gapped blast and psi‐blast: a new generation of protein database search programs. Nucleic Acids Res. 1997;25:3389–3402. doi: 10.1093/nar/25.17.3389. [DOI] [PMC free article] [PubMed] [Google Scholar]
- Baltz R.H. Molecular engineering approaches to peptide, polyketide and other antibiotics. Nat Biotechnol. 2006;24:1533–1540. doi: 10.1038/nbt1265. [DOI] [PubMed] [Google Scholar]
- Bentley S.D., Chater K.F., Cerdeno‐Tarraga A.M., Challis G.L., Thomson N.R., James K.D. Complete genome sequence of the model actinomycete Streptomyces coelicolor A3(2) Nature. 2002;417:141–147. doi: 10.1038/417141a. et al. [DOI] [PubMed] [Google Scholar]
- Betzler M., Dyson P., Schrempf H. Relationship of an unstable argG gene to a 5.7 kb amplifiable DNA sequence in Streptomyces lividans 66. J Bacteriol. 1987;169:4804–4810. doi: 10.1128/jb.169.10.4804-4810.1987. [DOI] [PMC free article] [PubMed] [Google Scholar]
- Blake M.S., Johnston K.H., Russel‐Jones G.J., Gotschlich E.C. A rapid, sensitive method for detection of alkaline phosphatase‐conjugated anti‐antibody on Western‐blots. Anal Biochem. 1984;136:175–179. doi: 10.1016/0003-2697(84)90320-8. [DOI] [PubMed] [Google Scholar]
- Blondelet‐Rouault M.H., Weiser J., Lebrihi A., Branny P., Pernodet J.L. Antibiotic resistance gene cassettes derived from the omega interposon for use in E. coli and Streptomyces. Gene. 1997;190:315–317. doi: 10.1016/s0378-1119(97)00014-0. [DOI] [PubMed] [Google Scholar]
- Desvaux M., Dumas E., Chafsey I., Hebraud M. Protein cell surface display in Gram‐positive bacteria: from single protein to macromolecular protein structure. FEMS Microbiol Lett. 2006;256:1–15. doi: 10.1111/j.1574-6968.2006.00122.x. [DOI] [PubMed] [Google Scholar]
- Donadio S., Sosio M., Lancini G. Impact of the first Streptomyces genome sequence on the discovery and production of bioactive substances. Appl Microbiol Biotechnol. 2002;60:377–380. doi: 10.1007/s00253-002-1143-0. [DOI] [PubMed] [Google Scholar]
- Fang A., Pierson D.L., Mishra S.K., Demain A.L. Growth of Steptomyces hygroscopicus in rotating‐wall bioreactor under simulated microgravity inhibits rapamycin production. Appl Microbiol Biotechnol. 2000;54:33–36. doi: 10.1007/s002539900303. [DOI] [PubMed] [Google Scholar]
- Flärdh K. Growth polarity and cell division in Streptomyces. Curr Opin Microbiol. 2003;6:564–571. doi: 10.1016/j.mib.2003.10.011. [DOI] [PubMed] [Google Scholar]
- Gold L., Pribnow D., Schneider T., Shninedling S., Singer B.S., Stormo G. Translational initiation in prokaryotes. Annu Rev Microbiol. 1981;35:365–403. doi: 10.1146/annurev.mi.35.100181.002053. [DOI] [PubMed] [Google Scholar]
- Hegermann J., Lunsdorf H., Overbeck J., Schrempf H. Polyphosphate at the Streptomyces lividans cytoplasmic membrane is enhanced in the presence of the potassium channel KcsA. J Microsc. 2008;229:174–182. doi: 10.1111/j.1365-2818.2007.01863.x. [DOI] [PubMed] [Google Scholar]
- Higgins D.G., Bleasby A.J., Fuchs R. Clustal V: improved software for multiple sequence alignment. Comput Appl Biosci. 1992;8:189–191. doi: 10.1093/bioinformatics/8.2.189. [DOI] [PubMed] [Google Scholar]
- Hille A., Neu T.R., Hempel D.C., Horn H. Oxygen profiles and biomass distribution in biopellets of Aspergillus niger. Biotechnol Bioeng. 2005;92:614–623. doi: 10.1002/bit.20628. [DOI] [PubMed] [Google Scholar]
- Hopwood D.A., Bibb M.J., Chater K.F., Kieser T., Bruton C.J., Kieser H.M. John Innes Foundation; 1985. et al.) Genetic Manipulation of Streptomyces: A Laboratory Manual. Norwich, UK: [Google Scholar]
- Horinouchi S. Mining and polishing of the treasure trove in the bacterial genus Streptomyces. Biosci Biotechnol Biochem. 2007;71:283–299. doi: 10.1271/bbb.60627. [DOI] [PubMed] [Google Scholar]
- Ikeda H., Ishikawa J., Hanamoto A., Shinose M., Kikuchi H., Shiba T. Complete genome sequence and comparative analysis of the industrial microorganism Streptomyces avermitilis. Nat Biotechnol. 2003;21:526–531. doi: 10.1038/nbt820. et al. [DOI] [PubMed] [Google Scholar]
- Jalkanen S., Salmi M. Cell surface monoamine oxidases: enzymes in search of a function. EMBO J. 2001;20:3893–3901. doi: 10.1093/emboj/20.15.3893. [DOI] [PMC free article] [PubMed] [Google Scholar]
- Jonsbu E., McIntyre M., Nielsen J. The influence of carbon sources and morphology on nystatin production by Streptomyces noursei. J Biotechnol. 2002;95:133–144. doi: 10.1016/s0168-1656(02)00003-2. [DOI] [PubMed] [Google Scholar]
- Kim Y.J., Sa S.O., Chang Y.K., Hong S.K., Hong Y.S. Overexpression of Shinorhizobium meliloti hemoprotein in Streptomyces lividans to enhance secondary metabolite production. J Microbiol Biotechnol. 2007;17:2066–2070. [PubMed] [Google Scholar]
- Kutzner H.J. ) The family Streptomycetaceae. In: Starr M.P., Stolp H., Trüper H.G., Balows A., Schlegel H., editors. Springer‐Verlag; 1981. pp. 2028–2090. [Google Scholar]
- Laemmli U.K. Cleavage of structural proteins during the assembly of the head of bacteriophage T4. Nature. 1970;227:680–685. doi: 10.1038/227680a0. [DOI] [PubMed] [Google Scholar]
- Lombo F., Menendez N., Salas J.A., Mendez C. The aureolic acid family of antitumor compounds: structure, mode of action, biosynthesis, and novel derivatives. Appl Microbiol Biotechnol. 2006;73:1–14. doi: 10.1007/s00253-006-0511-6. [DOI] [PubMed] [Google Scholar]
- Lünsdorf H., Kristen I., Barth E. Cationic hydrous thorium dioxide colloids – a useful tool for staining negatively charged surface matrices of bacteria for use in energy‐filtered transmission electron microscopy. BMC Microbiol. 2006;6:59. doi: 10.1186/1471-2180-6-59. [DOI] [PMC free article] [PubMed] [Google Scholar]
- Mattes T.E., Coleman N.V., Spain J.C., Gossett J.M. Physiological and molecular genetic analyses of vinyl chloride and ethene biodegradation in Nocardioides sp. strain JS614. Arch Microbiol. 2005;183:95–106. doi: 10.1007/s00203-004-0749-2. [DOI] [PubMed] [Google Scholar]
- Muth G., Farr M., Hartmann V., Wohlleben W. Streptomyces ghanaensis plasmid pSG5: Nucleotide sequence analysis of the self‐transmissible minimal replicon and characterization of the replication mode. Plasmid. 1995;33:113–126. doi: 10.1006/plas.1995.1013. [DOI] [PubMed] [Google Scholar]
- Nielsen H., Engelbrecht J., Brunak S., Von Heijne G. Identification of prokaryotic and eukaryotic signal peptides and prediction of their cleavage sites. Protein Eng. 1997;10:1–6. doi: 10.1093/protein/10.1.1. [DOI] [PubMed] [Google Scholar]
- Ochi K. From microbial differentiation to ribosome engineering. Biosci Biotechnol Biochem. 2007;71:1373–1386. doi: 10.1271/bbb.70007. [DOI] [PubMed] [Google Scholar]
- Ohnishi Y., Ishikawa J., Hara H., Suzuki H., Ikenoya M., Ikeda H. Genome sequence of the streptomycin‐producing microorganism Streptomyces griseus IFO 13350. J Bacteriol. 2008;190:4050–4060. doi: 10.1128/JB.00204-08. et al. [DOI] [PMC free article] [PubMed] [Google Scholar]
- Ohno Y.I., Hirai K.I., Kanoh T., Uchino H., Ogawa K. Subcellular localization of hydrogen peroxide production in human polymorphonuclear leukocytes stimulated with lectins, phorbol myristate acetate, and digitonin: an electron microscopic study using CeCl3. Blood. 1982;60:1195–1202. [PubMed] [Google Scholar]
- Oncu S., Tari C., Unluturk S. Effect of various process parameters on morphology, rheology, and polygalacturonase production by Aspergillus sojae in a batch bioreactor. Biotechnol Prog. 2007;23:836–845. doi: 10.1021/bp070079c. [DOI] [PubMed] [Google Scholar]
- Rea G., Metoui O., Infantino A., Federico R., Angelini R. Copper amine oxidase expression in defense responses to wounding and Ascochyta rabiei invasion. Plant Physiol. 2002;128:865–875. doi: 10.1104/pp.010646. [DOI] [PMC free article] [PubMed] [Google Scholar]
- Reichl U., King R., Gilles E.D. Effect of temperature and medium composition on mycelial growth of Streptomyces tendae in submerged culture. J Basic Microbiol. 1992;32:193–200. doi: 10.1002/jobm.3620320308. [DOI] [PubMed] [Google Scholar]
- Rosa J.C., Baptista N.A., Hokka C.O., Badino A.C. Influence of dissolved oxygen and shear conditions on clavulanic acid production by Streptomyces clavuligerus. Bioprocess Biosyst Eng. 2005;27:99–104. doi: 10.1007/s00449-004-0386-9. [DOI] [PubMed] [Google Scholar]
- Roth J., Bendayan M., Carlemalm E., Villiger W., Garavito M. Enhancement of structural preservation and immunocytochemical staining in low temperature embedded pancreatic tissue. J Histochem Cytochem. 1981;29:663–671. doi: 10.1177/29.5.6166664. [DOI] [PubMed] [Google Scholar]
- Sambrook J., Fritsch E.F., Maniatis T. Cold Spring Harbor Laboratory Press; 1989. [Google Scholar]
- Schaerlaekens K., Van Mellaert L., Lammertyn E., Geukens N., Anné J. The importance of the Tat‐dependent protein secretion pathway in Streptomyces as revealed by phenotypic changes in tat deletion mutants and genome analysis. Microbiology. 2004;50:21–31. doi: 10.1099/mic.0.26684-0. [DOI] [PubMed] [Google Scholar]
- Schlochtermeier A., Walter S., Schröder J., Moormann M., Schrempf H. The gene encoding the cellulase (Avicelase) cel1 from Streptomyces reticuli and analysis of protein domains. Mol Microbiol. 1992;6:3611–3621. doi: 10.1111/j.1365-2958.1992.tb01797.x. [DOI] [PubMed] [Google Scholar]
- Schrempf H. The family of Streptomycetacae: part II molecular biology. In: Dworkin M., Falkow S., Rosenberg E., Schleifer K.H., Stackebrandt E., editors. Springer‐Verlag; 2007. pp. 605–622. [Google Scholar]
- Strohl W.R. Compilation and analysis of DNA sequences associated with apparent streptomycete promoters. Nucleic Acids Res. 1992;20:961–974. doi: 10.1093/nar/20.5.961. [DOI] [PMC free article] [PubMed] [Google Scholar]
- Vara J., Lewandowska‐Skarbek M., Wang Y.‐G., Donadio S., Hutchinson C.R. Cloning of genes governing the deoxysugar portion of the erythromycin biosynthesis pathway in Saccharopolyspora erythraeaStreptomyces erythreus. J Bacteriol. 1989;171:5872–5881. doi: 10.1128/jb.171.11.5872-5881.1989. [DOI] [PMC free article] [PubMed] [Google Scholar]
- Verstrepen K.J., Klis F.M. Flocculation, adhesion and biofilm formation in yeasts. Mol Microbiol. 2006;60:5–15. doi: 10.1111/j.1365-2958.2006.05072.x. [DOI] [PubMed] [Google Scholar]
- Vieira J., Messing J. The pUC plasmids, an M13mp7‐derived system for insertion mutagenesis and sequencing with synthetic universal primers. Gene. 1982;19:259–268. doi: 10.1016/0378-1119(82)90015-4. [DOI] [PubMed] [Google Scholar]
- Villarejo M.R., Zamenhof P.J., Zabin I. Beta‐galactosidase. In vivo‐complementation. J Biol Chem. 1972;247:2212–2216. [PubMed] [Google Scholar]
- Walter S., Schrempf H. Characteristics of the surface‐located carbohydrate‐binding protein CbpC from Streptomyces coelicolor A3(2) Arch Microbiol. 2008;190:119–127. doi: 10.1007/s00203-008-0373-7. [DOI] [PubMed] [Google Scholar]
- Willey J.M., Willems A., Kodani S., Nodwell J.R. Morphogenetic surfactants and their role in the formation of aerial hyphae in Streptomyces coelicolor. Mol Microbiol. 2006;59:731–742. doi: 10.1111/j.1365-2958.2005.05018.x. [DOI] [PubMed] [Google Scholar]
- Zeltins A., Schrempf H. Specific interaction of the Streptomyces chitin‐binding protein CHB1 with α‐chitin: the role of individual tryptophan residues. Eur J Biochem. 1997;246:557–564. doi: 10.1111/j.1432-1033.1997.t01-1-00557.x. [DOI] [PubMed] [Google Scholar]