

Summary
In this article we consider what we have learned from the Exxon Valdez oil spill (EVOS) in terms of when bioremediation should be considered and what it can accomplish. We present data on the state of oiling of Prince William Sound shorelines 18 years after the spill, including the concentration and composition of subsurface oil residues (SSOR) sampled by systematic shoreline surveys conducted between 2002 and 2007. Over this period, 346 sediment samples were analysed by GC‐MS and extents of hydrocarbon depletion were quantified. In 2007 alone, 744 sediment samples were collected and extracted, and 222 were analysed. Most sediment samples from sites that were heavily oiled by the spill and physically cleaned and bioremediated between 1989 and 1991 show no remaining SSOR. Where SSOR does remain, it is for the most part highly weathered, with 82% of 2007 samples indicating depletion of total polycyclic aromatic hydrocarbon (Total PAH) of > 70% relative to EVOS oil. This SSOR is sequestered in patchy deposits under boulder/cobble armour, generally in the mid‐to‐upper intertidal zone. The relatively high nutrient concentrations measured at these sites, the patchy distribution and the weathering state of the SSOR suggest that it is in a form and location where bioremediation likely would be ineffective at increasing the rate of hydrocarbon removal.
Introduction
Since the early 1970s, following the discovery that nutrient fertilizers could enhance the rates of oil biodegradation in marine environments (Atlas and Bartha, 1972; 1973; Bartha and Atlas, 1976), bioremediation has been a potential treatment for mitigating marine oil spills (Atlas, 1977; 1995; Swannell et al., 1996). As discussed by Swannell and colleagues (1996), the Exxon Valdez oil spill (EVOS) has been the most studied case regarding the applicability of bioremediation. Bioremediation based on fertilizer addition was used in Prince William Sound (PWS) from 1989 through 1991 with a total of 107000 pounds of nitrogen applied in 2237 separate shoreline applications following physical recovery of oil by shoreline washing and skimming of oil floating on water. Figure 1 shows locations and amounts of nitrogen applied 1989–1990: amounts applied in 1991 were significantly less.
Figure 1.
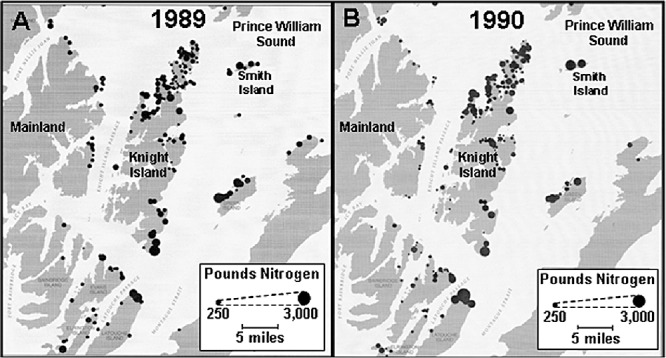
Nitrogen applications during bioremediation in PWS 1989–1990. Diameter of circles scaled to represent pounds of nitrogen.
The application of bioremediation to EVOS followed extensive laboratory and field testing to demonstrate safety and efficacy. For example, tests conducted for 114 days in large microcosms (30.5 cm diameter, 91.4 cm deep) filled with oiled PWS sediments and using rising and falling water to simulate tidal movements showed that 25% of the initial oil mass was lost and that significant degradation of most types of hydrocarbons occurred (Bragg et al., 1992) (Fig. 2). Control microcosms poisoned to kill microbes showed no loss. These experiments showed that the rate of biodegradation slowed down once the more easily degradable components were depleted even when fertilizer was reapplied. It is important to understand that bioremediation does not increase the ultimate extent of hydrocarbon degradation, but only the rate of biodegradation while easily degradable hydrocarbons are present (Sugiura et al., 1997; Wang et al., 1998).
Figure 2.
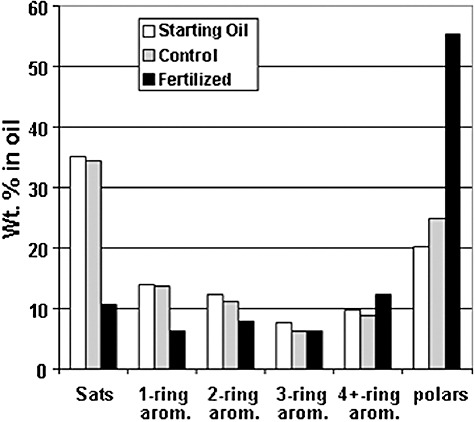
Changes in composition of oil on sediments from PWS in 1990 laboratory microcosm tests of bioremediation as measured by HPLC chromatography (different from more detailed GC‐MS reported for field samples). Sats is the saturates or alkanes. Aromatics (2–4+ rings) include the 41 target PAHs, plus other multi‐ring species. The polars (or NSO fraction) include asphaltenes, resins and oxygenated by‐products of biodegradation, and are considered largely inert to biodegradation. (Wt % is the percentage composition based on mass.)
Field tests jointly conducted in PWS by the United States Environmental Protection Agency (USEPA), the Alaska Department of Environmental Conservation and Exxon (Prince et al., 1993) showed, with high statistical significance, that the rate of oil degradation was a function of the ratio of nitrogen/oil, the non‐polar hydrocarbon fraction remaining, and time (Bragg et al., 1994). Bioremediation increased the rate of polycyclic‐aromatic‐hydrocarbon (PAH) degradation in the relatively undegraded oil found on the shorelines at this time by a factor of 2, and the degradation rate of total GC‐detectable hydrocarbons by a factor of 5 relative to the controls (Bragg et al., 1994). Total PAH depletion was 44% of that present at the start of the test (Fig. 3).
Figure 3.
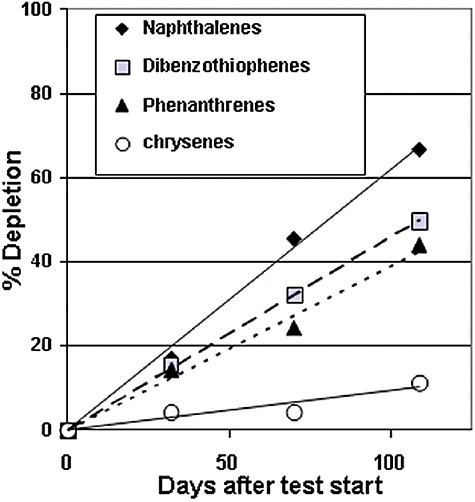
Depletion of PAH groups in subsurface oil residue within fertilized section of KN135B bioremediation field test, PWS, 1990.
It is important to recognize that biodegradation does not remove all of the hydrocarbons in crude oil – some compounds are recalcitrant to microbial attack such as higher‐molecular‐weight PAHs and the polars (NSO – molecules containing nitrogen, sulfur and oxygen) (Oudot et al., 1998; Wang et al., 1998). Further, if the biodegradation rate cannot be accelerated significantly – by a factor of at least 2 – it has been suggested that bioremediation is not worth considering (Zhu et al., 2001). As crude oil weathers the rate of biodegradation declines since hydrocarbon biodegradation follows first‐order kinetics (e.g. Venosa et al., 1996; Wrenn et al., 2006), which means that as the concentration of degradable hydrocarbons decreases so does the potential applicability of bioremediation.
Bioremediation studies of shorelines with moderately to heavily weathered oil have not been reported. However, some studies indicate that once the easily degraded alkanes and lower‐molecular‐weight aromatics are removed, the rate of biodegradation of the remaining oil residues is no longer limited by nutrients, and the biodegradation rate naturally slows. In bioremediation tests conducted following the Prestige spill (Diez et al., 2005; Gallego et al., 2006), for example, the rate of biodegradation of all higher‐molecular‐weight components slowed dramatically at a point consistent with the disappearance of the lower‐molecular‐weight alkanes (Fig. 4). Similarly, bioremediation tests conducted by Venosa and colleagues (1996) on a simulated spill in Delaware Bay showed a decline in the rate of biodegradation once the alkanes were removed. Wrenn and colleagues (2006), in a series of microcosm tests, also found that the sensitivity of the oil mineralization rate to nutrient input decreased rapidly as the extent of oil degradation increased, and after about 2 weeks the rate of oil mineralization appeared to be independent of nutrient input. They concluded that there may be little value in maintaining a long‐term supply of nutrients in contact with oil‐contaminated sediments.
Figure 4.
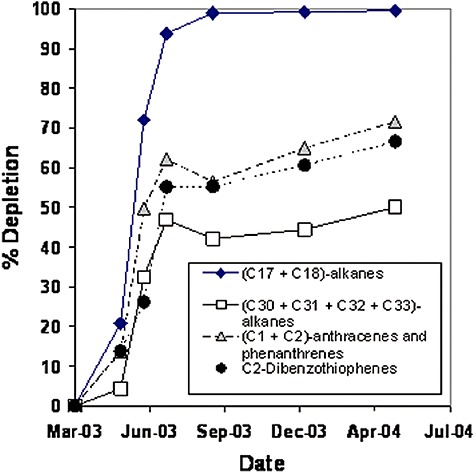
Depletion indices measured at Prestige oil spill bioremediation test (Moreira site) during a 1‐year sampling period (Gallego et al., 2006). Degradation rates slowed once light alkanes were depleted.
Many of the microorganisms capable of attacking higher‐molecular‐weight PAHs may operate by co‐metabolism (Cerniglia, 1993; Kanaly and Bartha, 1999; van Herwijnen et al., 2003). When alkanes and lower‐molecular‐weight aromatic substrates have been removed from the oil residues, the enzymes needed to attack the higher‐weight PAHs may not be induced, resulting in decreased rates of biodegradation.
Other rate‐decreasing factors that may result from the removal of lower‐molecular‐weight compounds are the increase in viscosity of the remaining oil residue and the decrease in mass fraction of degradable hydrocarbons. These slow the diffusion of degradable hydrocarbons to the oil–water interface where they can be attacked by microbes. Uraizee and colleagues (1998) systematically altered the concentration of non‐biodegradable heterocyclic polars and asphaltenes in crude oil and analysed its impact on transport of biodegradable hydrocarbons to microorganisms. As the polars content (and oil viscosity) increased, the maximum respiratory oxygen uptake decreased. Obviously, the weathering point at which the degradation of PAH is no longer nutrient limited will depend on the starting oil composition and the extent of prior weathering, so each case must be evaluated independently.
In addition, successful bioremediation in marine environments requires that water containing the applied nutrients must be able to contact the oil. Oil that is sequestered (buried under layers of sediment that impede free water flow) may not benefit from applied nutrients. In this case, as well as those where oxygen is limiting, tilling can be considered, but this raises the issue of physical disruption of the environment potentially causing greater environmental harm than benefit.
Since bioremediation was previously successful in PWS and since subsurface oil residues (SSOR) remain at some locations, there have been suggestions that bioremediation be applied again (Michel et al., 2006). In this study we examine the extent of weathering that had occurred by 2007, over the 18 years since the spill, and we estimate bioremediation potentials by examining the composition of the SSOR, its distribution by location and extent of depletion, and the current natural nutrient concentrations in pore water in its vicinity.
Results and discussion
Bioremediation potential in PWS 18 years after the spill
In 2001 and 2003 the National Oceanic and Atmospheric Administration (NOAA) conducted random sampling of 4982 pits dug at 114 sites in PWS (Short et al., 2002; 2004; 2006), and found that 97.8% of the pits had no oil (NO) or light oil residues (LOR) even though these sites had been heavily oiled in 1989 and previously had significant levels of SSOR. Separate gridded surveys were also conducted for ExxonMobil in 2002 and 2007. The 2007 survey conducted for ExxonMobil (Boehm et al., 2008) at 22 sites that were found to be most heavily oiled in NOAA's 2001–2003 surveys found no SSOR in 529 pits (71%). Sediments from an additional 162 pits (21.8%) had light levels (LOR) or only traces (TR) of SSOR. Only 34 pits (4.6%) were found with moderate SSOR (MOR) and 19 pits (2.6%) with heavy SSOR (HOR). The pits with MOR or HOR showed a pattern of extreme SSOR patchiness, i.e. widely scattered small patches, mostly sequestered under boulder/cobble armour.
Even where SSOR remains it is highly weathered. Almost no resolvable alkanes remain in samples collected from 2002 through 2007 (Fig. 5). Most samples also had lost more than 70% of the original PAHs through a combination of biodegradation and other weathering processes. We believe 70% depletion of Total PAH is the approximate threshold above which bioremediation is likely to be ineffective. This threshold is supported by results from the Prestige bioremediation tests (Fig. 4) that showed dramatic reduction in bioremediation effectiveness upon depletion of light alkanes, the almost total depletion of resolvable alkanes in current PWS samples (Fig. 5), and other studies showing lack of biodegradation rate sensitivity to added nitrogen once lighter alkanes and aromatics were depleted (Oudot et al., 1998; Wang et al., 1998; Wrenn et al., 2006). We have computed bioremediation indices for all analysed samples for which Total PAH loss could be quantified. The 70% is meant as a probable threshold, not a specific value above which bioremediation would not work. Figure 6 shows the bioremediation index for all samples collected from 2002 through 2007. If the Total PAH content of a sample was less than 500 ng g−1 sediment, that sample was not included in plots because the Total PAH concentration was approaching natural background levels in PWS and could not be confirmed as EVOS SSOR. However, note that the average percentage of depletion of Total PAH computed for all samples with Total PAH content < 500 ng g−1 sediment was 94%. HOR residues were found that contained Total PAH of less than 500 ng g−1 sediment; however, these comprised 80–95% polars – they looked like ‘oil’ but contained only highly degraded EVOS‐derived residues. As shown in Fig. 6, only about 25% of the total samples from 2002 to 2007 contained SSOR that might respond to bioremediation based on the 70% threshold.
Figure 5.
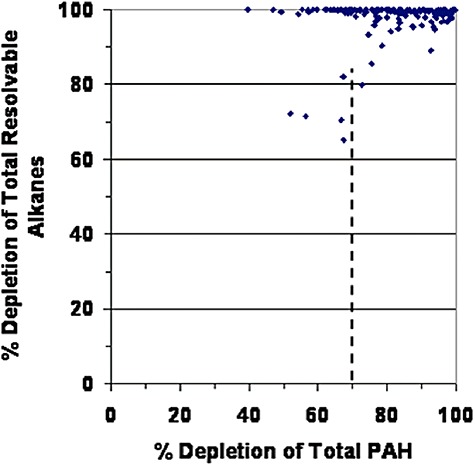
Depletion of total resolvable alkanes in all oiled sediment samples analysed from 2002 to 2007 as function of Total PAH depletion. Resolvables include C9‐ to C40‐normal alkanes plus pristane and phytane. Almost all are totally depleted.
Figure 6.
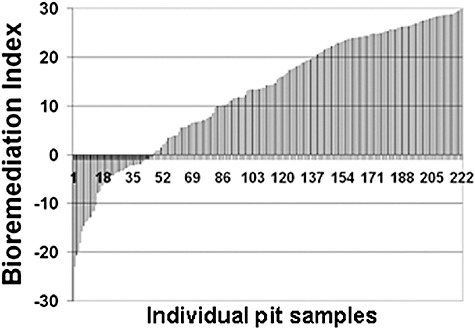
Bioremediation indices for all PWS samples analysed between 2002 and 2007.
Figure 7 shows further breakdown of the extent of Total PAH depletion as a function of tidal elevation [i.e. pit elevation above MLLW (mean low low water tide)]. Most samples with less than 70% Total PAH depletion are located at +2 and +3 m (middle to upper intertidal zone). Very few are located in the lower intertidal zone. This is not unexpected since SSOR at 0 and +1 m is exposed to water for much longer times.
Figure 7.
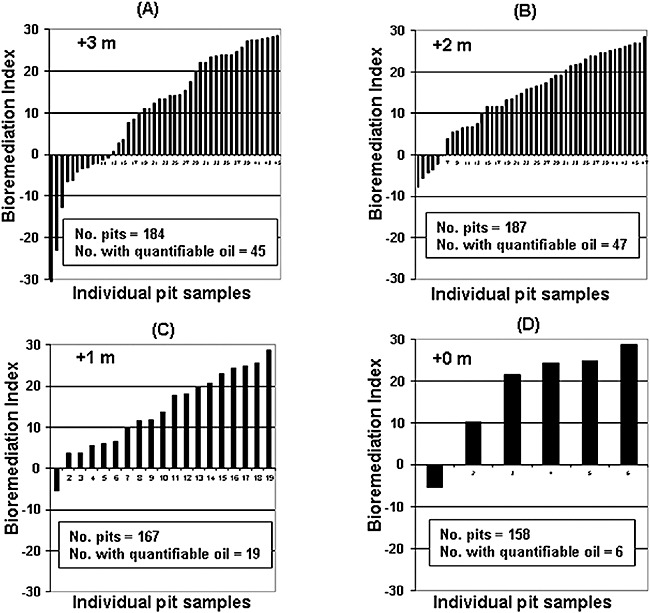
Bioremediation indices for samples collected in 2007 as function of pit elevation above mean low tide (MLLW). Samples least degraded reside in upper intertidal zone (A and B), while few were found that might respond to bioremediation in lower intertidal (C and D).
As expected, the trend in individual analyte degradation demonstrates that percentage depletion decreases as the PAH alkyl substitution increases (Fig. 8). Even at 80% Total PAH depletion about half of the C3‐ and C4‐phenanthrenes remain, probably because the analytes become more recalcitrant and less water soluble as alkyl substitution increases. Adding nutrients would likely have minimal impact on the rates of biodegradation of remaining highly substituted three‐ and four‐ring aromatics (Oudot et al., 1998; Wang et al., 1998).
Figure 8.
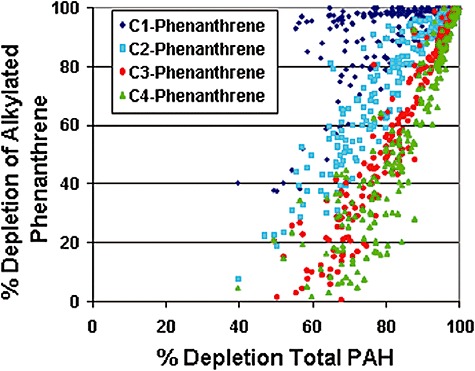
Depletion of C1‐ to C4‐alkylated phenanthrenes versus Total PAH depletion in samples from 2002 to 2007. Pattern is typical of biodegadation.
Another factor we evaluated was the concentration of nitrogen naturally available within sediment pore water. The ratio of nitrogen/non‐polar SSOR provides a conservative estimate of the ratio of nitrogen/degradable hydrocarbons. It is a convenient ratio for comparing recent nutrient/SSOR ratios with values measured during 1990 bioremediation field tests at Knight Island shoreline segment 135 (KN135), considering measured values of oil loading, polars content and nitrate‐as‐nitrogen concentration.
Figure 9 shows the ratios of nitrogen/non‐polar SSOR measured at several sites from 2006 to 2008 normalized to the average value measured over 109 days for the fertilized section of the bioremediation test at KN135B in 1990. Horizontal lines indicate the ratios for the fertilized and control sections of KN135B in 1990. Clearly, the amount of natural background nitrogen is significantly higher at most sites during 2006–2008 than at the KN135B control in 1990, and many sites now approach the same value as realized during fertilizer addition in 1990.
Figure 9.
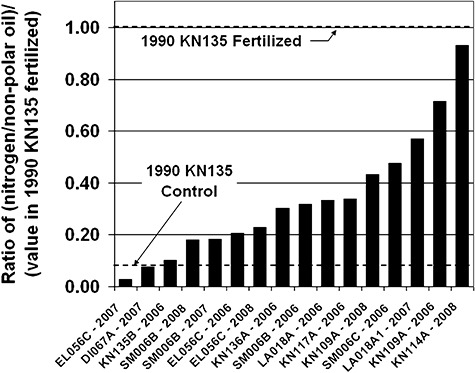
Ratio of (nitrogen concentration/non‐polar hydrocarbons) in 2006–2008 pore water samples normalized to same ratio measured in fertilized portion of KN135B during 1990 bioremediation test. Ratios reflect relatively high natural background nutrient concentrations currently at most sites.
Why? We believe this is a result of several factors. First, the amount of SSOR to be degraded (the SSOR loading in mg SSOR g−1 sediment) is lower, and the polars content of the remaining SSOR is higher, resulting in less non‐polar SSOR. Second, the average nitrate‐as‐nitrogen for 10 segments measured from 2006 through 2008 was 0.36 mg l−1 water (with range by site of from 0.1 to 1.18 mg l−1) compared with 1.53 mg l−1 in 1990 fertilized sediments.
The concentrations of nitrogen in the pore water of the sediments where SSOR remains today are significantly higher than in the incoming seawater. The incoming seawater at sites studied had a concentration of approximately 0.014 mg nitrate‐as‐nitrogen l−1. Even in 1990 NOAA noted higher‐than‐expected concentrations of nitrogen in oiled sediments during most of the summer. That raises the question as to the nitrogen source. Perhaps it is being generated within the intertidal zone itself by nitrogen‐fixing cyanobacteria, or it may be coming from groundwater entering the intertidal zone that is possibly enriched in nitrogen by nitrogen‐fixing Frankia species associated with the Alder trees that line the upper intertidal zones of many of the shorelines of PWS.
We believe that the current presence of relatively high levels of natural nutrients shows that the natural biodegradation is no longer nutrient limited; the rate of biodegradation is lower, and hence demand for nitrogen is lower. Third, most of the remaining SSOR is sequestered in low‐permeability fine sediments under boulder/cobble armour where it may not have good accessibility to the nutrients that flow with the tides. All of these factors suggest that adding more nitrogen would be ineffective.
Finally, the small amount of SSOR remaining that might respond to bioremediation is scattered in isolated small patches. Figure 10 shows the extent of PAH degradation remaining in 2007 at SM006B (Smith Island), which NOAA (Michel et al., 2006) identified as the site that in 2001 contained the largest volume of oiled sediment. This site is typical of the way residual SSOR is distributed; few pit locations contain SSOR with less than 70% loss of Total PAH and most have no detectable SSOR. At SM006B only two pits near the top of the beach (red cross‐hatched area) contain SSOR that might be amenable to bioremediation. However, SSOR remains in these locations because it is sequestered under boulders and cobbles.
Figure 10.
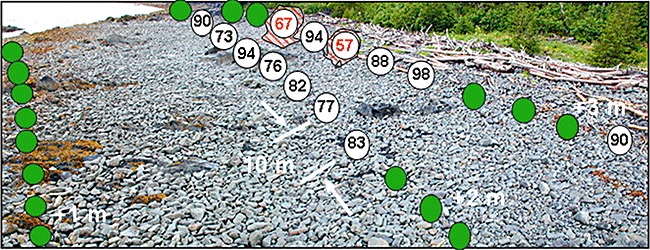
Photo of site SM006B showing the % Total PAH depletion at pits sampled in 2007. All pits along a tidal elevation transect are 10 m apart. Green dots reflect no oiling above reference background. Only two small patches of oil remain that might respond to bioremediation.
As demonstrated by the extensive depletion of Total PAH in most samples shown in Figs 6–8, conditions in PWS have generally been favourable for microbial biodegradation. However, effective biodegradation requires that flowing water resupply nutrients to microbes in contact with the oil. The geology (porosity and permeability) of PWS shorelines is highly heterogeneous, leading to scattered pockets of sequestered oiled sediment that are not fully in communication with flowing seawater. Most of the SSOR that is less degraded than 90% resides in such sequestered locations. Fertilizer added to shorelines for in situ bioremediation is unlikely to contact this sequestered oil, but would simply be diluted and washed away by water flowing through more permeable zones/paths. Thus, the degree of sequestration for individual pockets of SSOR probably now is the major factor affecting extent of Total PAH depletion, not nutrient availability.
Microcosm tests conducted in 1989–1990 utilized oiled sediment that was not sequestered. If microcosm tests were conducted on currently sequestered oiled sediments, results would only indicate the maximum possible increase in biodegradation rate that might be realized if sediments were not sequestered, since contact between oil and added nutrients in microcosms is not impeded by geologic factors. For this reason, microcosm tests would not be indicative of any actual in situ treatment potential on shorelines, but instead would only show the ideal maximum bioremediation rate increase consistent with limitations of the tested oil composition. If in situ bioremediation is unlikely to work because the oiled sediments are sequestered, one might consider tilling of the sediments to increase contact with added nutrients. However, since several studies have shown that PAHs from the oil residues in their current sequestered state in PWS are not bioavailable to shoreline biota or prey species (Boehm et al., 2004; Harwell and Gentile, 2006; Neff et al., 2006), tilling would cause physical disruption to the environment, disturbance of wildlife and, therefore, greater harm than benefit.
As shown in Figs 6–8, the higher‐molecular‐weight PAHs remaining in the oil residue will continue to degrade at rates consistent with adequate natural nutrient content in pore water, but variable extents of sequestration of scattered individual small pockets of SSOR. In summary, there is relatively little of the EVOS oil remaining in PWS, it is mostly sequestered under boulders/cobbles, and it will naturally continue to slowly degrade. Therefore, we feel that bioremediation would not be appropriate for this SSOR, making natural attenuation the preferable treatment.
Experimental procedures
Distribution and amount of remaining oil residues
In 2007, we sampled 22 PWS shoreline sites that had also been sampled in 2002 and have been shown to be among the most persistently oiled in earlier surveys (Short et al., 2002; 2004; 2006; Michel et al., 2006; Boehm et al., 2008; Page et al., 2008; Taylor and Reimer, 2008). These 22 study sites included all 10 of the 2001 and 2003 NOAA HOR sites and 18 of the 23 2001 and 2003 MOR or HOR sites. In addition, two sites were included that were both heavily oiled in 1989 and identified as segments having extensive otter foraging.
At each shoreline, 100‐m‐long transects were surveyed either at four elevations (0, +1, +2 and +3 m) or just at two elevations (+2 and +3 m) above MLLW. Pits were dug 10 m apart along each transect. Using established surveying methods (Owens and Sergy, 2000; Boehm et al., 2008), the visual SSOR level (heavy, moderate, light, trace or oil film) was noted for each pit, and samples of sediment were collected for analysis. To access sediment showing any visible SSOR, it was necessary to remove surface boulders and cobbles and then dig to a depth of 30–50 cm.
All sediment samples were solvent extracted to determine the total extractable hydrocarbon content (TEH). Approximately 25% of all samples showing SSOR were then selected for detailed GC‐MS chemistry. However, for sites specifically selected for evaluating detailed bioremediation potential, all grid pits containing a TEH of greater than 1 mg SSOR g−1 sediment were analysed by GC‐MS using established protocols (Page et al., 1995; Douglas et al., 2004). Concentrations of 41 target PAH were measured, including parent and alkyl substituted naphthalene, fluorene, phenanthrene, dibenzothiophene, chrysene and six‐ring components. Also measured were saturated hydrocarbons including resolvable alkanes (C9‐ to C40‐normal alkanes plus pristine and phytane), total GC‐detectable hydrocarbons, saturated cyclic hydrocarbon biomarkers and seven C20–C28 triaromatic steroids. The polars (NSO) fraction was estimated by difference of gravimetric mass of total extract less F1 and F2 fractions (Atlas and Bragg, 2007). The analytical and quality assurance and quality control methods for TEH, stearane/triterpane biomarkers, and PAH analyses of sediment samples have been published in detail elsewhere (Page et al., 1995). All analyte concentrations were calculated on a dry sample weight basis (ng g−1 sediment) to assess the sediment concentration and on an extract weight basis (µg g−1 extract) to calculate analyte losses relative to the original cargo crude oil (Atlas and Bragg, 2007).
Extent of weathering/bioremediation potential index
We evaluated bioremediation potential by computing the extent of depletion of key components relative to their concentrations in the EVOS cargo crude and comparing that with depletion results from prior bioremediation studies (Atlas and Bragg, 2007). The bioremediation potential index was based on the mass ratio method using C29‐stigmastane as the most stable (conserved) species in EVOS cargo oil 18 years after the spill (Atlas and Bragg, 2007). The total loss by any oil component, x, from weathering and biodegradation relative to the EVOS cargo oil was computed by the following equation:
where: Cx = mass concentration of component x
CC29R = mass concentration of C29R‐stigmastane
S = sample
EVOS = EVOS cargo oil stabilized at atmospheric pressure.
A bioremediation index was calculated from the mass loss data as follows:
Computing this index, ordering the results in increasing rank and graphing permits a rapid visual determination as to whether the aggregate SSOR compositions would respond to nutrient addition. Seventy per cent Total PAH degradation is used as the normalizing factor above which bioremediation effectiveness is unlikely based on results of prior bioremediation tests where nutrient addition was no longer effective after disappearance of light alkanes.
Measurement of nutrients
To evaluate the concentration of nitrogen present within the pore water at the surveyed grid locations, stainless steel piezotubes were driven into subsurface sediment to a depth where SSOR layers exist (∼30–50 cm below boulder/cobble armour), and in situ measurements were taken of dissolved oxygen, water salinity and temperature using a multimeter. Then 100 ml of samples of pore water were withdrawn by peristaltic pump and stored frozen until analysed for inorganic nitrate/nitrite as nitrogen. This sampling was completed prior to any pits being dug at the site to prevent contamination of pore water and was usually done 1 day prior to pit sampling.
Acknowledgments
We wish to thank David Page, Paul Boehm, Ted Bence and John Brown for collaboration in obtaining samples and chemical analysis. This work was funded by ExxonMobil.
References
- Atlas R.M. Stimulated petroleum biodegradation. Crit Rev Microbiol. 1977;6:371–386. doi: 10.3109/10408417709102810. [DOI] [PubMed] [Google Scholar]
- Atlas R.M. Petroleum biodegradation and oil spill bioremediation. Marine Pollut Bullet. 1995;31:178–182. [Google Scholar]
- Atlas R.M., Bartha R. Biodegradation and mineralization of petroleum in seawater: limitation by nitrogen and phosphorus. Biotechnol Bioeng. 1972;14:309–318. doi: 10.1002/bit.260140304. [DOI] [PubMed] [Google Scholar]
- Atlas R.M., Bartha R. Stimulated biodegradation of oil slicks using hydrophobic fertilizers. Environ Sci Technol. 1973;7:538–541. doi: 10.1021/es60078a005. [DOI] [PubMed] [Google Scholar]
- Atlas R.M., Bragg J.R. Assessing the long‐term weathering of petroleum on shorelines; uses of conserved components for calibrating loss and bioremediation potential. Proceedings of the Thirtieth Arctic and Marine Oilspill Program (AMOP) Technical Seminar. 2007;1:263–289. [Google Scholar]
- Bartha R., Atlas R.M. 1976.
- Boehm P.D., Page D.S., Brown J.S., Neff J.M., Burns W.A. Polycyclic aromatic hydrocarbon levels in mussels from prince William sound, Alaska, USA, document the return to baseline conditions. Environ Toxicol Chem. 2004;23:2916–2929. doi: 10.1897/03-514.1. [DOI] [PubMed] [Google Scholar]
- Boehm P.D., Page D.S., Brown J.S., Neff J.M., Bragg J.R., Atlas R.M. Distribution and weatering of crude oil residues on shorelines 18 years after the Exxon Valdez spill. Environ Sci Technol. 2008;42:9210–9216. doi: 10.1021/es8022623. [DOI] [PubMed] [Google Scholar]
- Bragg J.R., Prince R.C., Wilkinson J.B., Atlas R. Exxon; 1992. [Google Scholar]
- Bragg J.R., Prince R.C., Harner E.J., Atlas R.M. Effectiveness of bioremediation for the Exxon Valdez oil spill. Nature. 1994;368:413–418. [Google Scholar]
- Cerniglia C.E. Biodegradation of polycyclic aromatic hydrocarbons. Curr Opin Biotechnol. 1993;4:331–338. [Google Scholar]
- Diez S., Sabate J., Vinas M., Bayona J.M., Solanas A.M., Albaiges J. The Prestige oil spill. I. Biodegradation of a heavy fuel oil under simulated conditions. Environ Toxicol Chem. 2005;24:2203–2217. doi: 10.1897/04-604r.1. [DOI] [PubMed] [Google Scholar]
- Douglas G.S., Burns W.A., Bence A.E., Page D.S., Boehm P. Optimizing detection limits for the analysis of petroleum hydrocarbons in complex environmental samples. Environ Sci Technol. 2004;38:3959–3964. doi: 10.1021/es049896o. [DOI] [PubMed] [Google Scholar]
- Gallego J., González‐Rojas E., Peláez A.I., Sanchez A.J., Garcia‐Martinez M., Ortiz J. Natural attenuation and bioremediation of Prestige fuel oil along the Atlantic coast of Galicia (Spain) Org Geochem. 2006;37:1869–1884. et al. [Google Scholar]
- Harwell M.A., Gentile J.H. Ecological significance of residual exposures and effects from the Exxon Valdez oil spill. Integr Environ Assess Manag. 2006;2:204–246. doi: 10.1897/1551-3793(2006)2[204:esorea]2.0.co;2. [DOI] [PubMed] [Google Scholar]
- Van Herwijnen R., Wattiau P., Bastiaens L., Daal L., Jonker L., Springael D. Elucidation of the metabolic pathway of fluorene and cometabolic pathways of phenanthrene, fluoranthene, anthracene and dibenzothiophene by Sphingomonas sp. LB126. Res Microbiol. 2003;154:199–206. doi: 10.1016/S0923-2508(03)00039-1. et al. [DOI] [PubMed] [Google Scholar]
- Kanaly R.A., Bartha R. Cometabolic mineralization of benzo[a]pyrene caused by hydrocarbon additions to soil. Environ Toxicol Chem. 1999;18:2186–2190. doi: 10.1002/etc.5620181010. [DOI] [PubMed] [Google Scholar]
- Michel J., Nixon Z., Cotsapas L. 2006. pp. 1–61. , and ) Evaluation of oil remediation technologies for lingering oil from the Exxon Valdez oil spill of Prince William Sound, Alaska. Restoration Project 050778, Final Report for National Marine Fisheries Service, NOAA, Juneau, AK 99801‐8626, pp.
- Neff J.M., Bence A.E., Parker K.R., Page D.S., Brown J.S., Boehm P.D. Bioavailability of polycyclic aromatic hydrocarbons from buried shoreline oil residues thirteen years after the Exxon Valdez oil spill: a multispecies assessment. Environ Toxicol Chem. 2006;25:195–209. doi: 10.1897/05-339r.1. [DOI] [PubMed] [Google Scholar]
- Oudot J., Merlin F., Pinvidic P. Weathering rates of oil components in a bioremediation experiment in estuarine sediments. Mar Environ Res. 1998;45:113–125. [Google Scholar]
- Owens E.H., Sergy G.A. Environment Canada; 2000. [Google Scholar]
- Page D.S., Boehm P.D., Douglas G.S., Bence A.E. Identification of hydrocarbon sources in the benthic sediments of Prince William Sound and the Gulf of Alaska following the Exxon Valdez oil spill. In: Wells P.G., Butler J.N., Hughes J.S., editors. American Society for Testing and Materials; 1995. pp. 41–83. [Google Scholar]
- Page D.S., Boehm P.D., Neff J.M. Environment Canada; 2008. Shoreline type and subsurface oil persistence in the Exxon Valdez spill zone of Prince William Sound, Alaska; pp. 545–563. [Google Scholar]
- Prince R.C., Clark J.R., Lindstrom J.E., Butler E.L., Brown E.J., Winter G. In: Hinchee R.E., Alleman B.C., Hoeppel R.E., Miller R.N., editors. Lewis Publishers; 1993. pp. 107–124. et al.) Bioremediation of the Exxon Valdez oil spill: monitoring safety and efficacy. In Hydrocarbon Bioremediation. , and (eds). Boca Raton, FL: , pp. [Google Scholar]
- Short J.W., Lindeberg M.R., Harris P.M., Maselko J., Rice S.D. Environment Canada; 2002. Vertical oil distribution within the intertidal zone 12 years after the Exxon Valdez oil spill in Prince William Sound, Alaska; pp. 57–72. [Google Scholar]
- Short J.W., Lindeberg M.R., Harris P.M., Maselko J.M., Pella J.J., Rice S.D. Estimate of oil persisting on the beaches of Prince William Sound 12 years after the Exxon Valdez oil spill. Environ Sci Technol. 2004;38:19–25. doi: 10.1021/es0348694. [DOI] [PubMed] [Google Scholar]
- Short J.W., Maselko J.M., Lindeberg M.R., Harris P.M., Rice S.D. Vertical distribution and probability of encountering intertidal Exxon Valdez oil on shoreline of three embayments within Prince William Sound. Environ Sci Technol. 2006;40:3723–3729. doi: 10.1021/es0601134. [DOI] [PubMed] [Google Scholar]
- Sugiura K., Ishihara M., Shimauchi T., Harayama S. Physicochemical properties and biodegradability of crude oil. Environ Sci Technol. 1997;31:45–51. [Google Scholar]
- Swannell R.P.J., Lee K., McDonagh M. Field evaluations of marine oil spill bioremediation. Microbiol Rev. 1996;60:342–365. doi: 10.1128/mr.60.2.342-365.1996. [DOI] [PMC free article] [PubMed] [Google Scholar]
- Taylor E., Reimer D. Oil persistence on beaches in Prince William Sound – a review of SCAT surveys conducted from 1989 to 2002. Mar Pollut Bull. 2008;43:458–474. doi: 10.1016/j.marpolbul.2007.11.008. [DOI] [PubMed] [Google Scholar]
- Uraizee F.A., Venosa A.D., Suidan M.T. A model for diffusion controlled bioavailability of crude oil components. Biodegradation. 1998;8:287–296. doi: 10.1023/a:1008293024768. [DOI] [PubMed] [Google Scholar]
- Venosa A.D., Suidan M.T., Wrenn B.A., Strohmeir K.L., Haines J., Berhart B.L., Holder D.A. Bioremediation of an experimental oil spill on the shoreline of Delaware Bay. Environ Sci Technol. 1996;30:1764–1775. [Google Scholar]
- Wang Z., Fingas M., Blenkinsopp S., Sergy G., Landriault M., Sigoulin L. Comparison of oil composition changes due to biodegradation and physical weathering in different oils (1998) J Chromatogr. 1998;809:87–107. doi: 10.1016/s0021-9673(98)00166-6. et al. [DOI] [PubMed] [Google Scholar]
- Wrenn B.A., Sarnecki K.L., Kohar E.S., Lee K., Venosa A.D. Effects of nutrient source and supply on crude oil biodegradation in continuous‐flow beach microcosms. J Environ Eng. 2006;132:75–84. [Google Scholar]
- Zhu X., Venosa A., Suidan M.T., Lee K. US Environmental Protection Agency, National Risk Management Research Laboratory; 2001. [Google Scholar]