

Summary
The increasing availability of the genome sequences of microorganisms involved in important bioremediation processes makes it feasible to consider developing genome‐scale models that can aid in predicting the likely outcome of potential subsurface bioremediation strategies. Previous studies of the in situ bioremediation of uranium‐contaminated groundwater have demonstrated that Geobacter species are often the dominant members of the groundwater community during active bioremediation and the primary organisms catalysing U(VI) reduction. Therefore, a genome‐scale, constraint‐based model of the metabolism of Geobacter sulfurreducens was coupled with the reactive transport model HYDROGEOCHEM in an attempt to model in situ uranium bioremediation. In order to simplify the modelling, the influence of only three growth factors was considered: acetate, the electron donor added to stimulate U(VI) reduction; Fe(III), the electron acceptor primarily supporting growth of Geobacter; and ammonium, a key nutrient. The constraint‐based model predicted that growth yields of Geobacter varied significantly based on the availability of these three growth factors and that there are minimum thresholds of acetate and Fe(III) below which growth and activity are not possible. This contrasts with typical, empirical microbial models that assume fixed growth yields and the possibility for complete metabolism of the substrates. The coupled genome‐scale and reactive transport model predicted acetate concentrations and U(VI) reduction rates in a field trial of in situ uranium bioremediation that were comparable to the predictions of a calibrated conventional model, but without the need for empirical calibration, other than specifying the initial biomass of Geobacter. These results suggest that coupling genome‐scale metabolic models with reactive transport models may be a good approach to developing models that can be truly predictive, without empirical calibration, for evaluating the probable response of subsurface microorganisms to possible bioremediation approaches prior to implementation.
Introduction
The current inability to predictively model the growth and activity of microorganisms in the subsurface severely limits the capacity to predict the fate and transport of subsurface contaminants and to confidently design bioremediation strategies prior to field trials. Several codes for simulation of groundwater flow, solute transport and geochemical reactions (‘reactive transport models’) have been extensively developed, and can be effectively used for evaluating management alternatives and designing bioremediation strategies (Steefel et al., 2005). In contrast, it is well recognized that current models to predict the activity of the microbial community, which can substantially impact contaminant mobility via a diversity of degradation and transformation reactions, are woefully inadequate. In general, microbial activity is described in current reactive transport models by overly simplified representations that fail to capture: (i) the complex nature in which a diversity of environmental conditions influence microbial metabolism and (ii) the ability of microorganisms to adapt their metabolism to optimize growth and activity in a given environment. Models that can accurately predict microbial growth and activity are particularly important when dealing with the dynamic conditions that are expected when microbial activity in the subsurface is artificially stimulated in order to promote desired bioremediation reactions. These temporally dynamic conditions are further magnified by hydrologic flow and mass transport processes in heterogeneous geological systems that create a spatially variable environment within which microbial communities exist.
The era of complete genome sequencing of microorganisms has made it conceivable to apply much more sophisticated, genome‐scale microbial models to bioremediation (Lovley, 2003; Lovley et al., 2008). However, such models need to be experimentally and computationally tractable. For example, from an understanding of which genes are present as well as their function and expression patterns under different environmental conditions, it is theoretically possible to construct reaction‐based models for the biochemical mechanisms involved in cellular metabolism. However, experimentally validating the kinetic parameters for hundreds of such reactions and measuring pools of a large number of metabolites under various conditions is not feasible with current methods. An alternative approach is constraint‐based modelling (Price et al., 2004; Reed et al., 2006; Feist and Palsson, 2008). In this method the potential metabolic reactions of the organism are first mapped based on the genome sequence and other available physiological data. Then the objective for which the metabolic function of the microorganism will be optimized must be chosen. Typically, this is set to maximize biomass production, that is, growth, although other choices such as minimization of resource utilization, maximization of ATP production etc. have been reported (Schuetz et al., 2007). Then for a given environmental condition (e.g. a specific electron donor) the optimal flux of all metabolites through the possible metabolic reactions is then calculated with linear programming methods.
The constraint‐based modelling approach has been shown to accurately predict microbial growth under a variety of environmental conditions (Reed et al., 2006; Feist and Palsson, 2008). It can even predict the growth rates that microorganisms will achieve when they are placed in new environments that require the accumulation of beneficial mutations in order to evolve the appropriate metabolic capabilities to effectively compete in that new environment (Ibarra et al., 2002; Fong and Palsson, 2004). The constraint‐based modelling approach may be particularly well suited for modelling microorganisms in heterogeneous environments because it does not assume constant yield coefficients and has been shown to account for the changes in the metabolic network in response to nutrient limitations (Varma et al., 1993; Schuetz et al., 2007). Dynamic extensions of the constraint‐based modelling approach have been proposed to model the temporal changes in the metabolic state such as the diauxic growth of Escherichia coli on mixtures of multiple susbstrates (Mahadevan et al., 2002; Covert et al., 2008).
The typical microbial component of subsurface reactive transport models treats growth yield for a given form of metabolism as a constant (Schäfer et al., 1998; Regnier et al., 2005; Scheibe et al., 2006). However, in reality a range of environmental conditions are likely to influence growth yields. The influence of environmental parameters on growth yields can be captured with constraint‐based models. For example, during in situ uranium bioremediation solid‐phase Fe(III) oxides are the primary electron acceptor for the growth of Geobacter species on the acetate released into the subsurface (Finneran et al., 2002). There is only a finite concentration of Fe(III) at any particular location in the subsurface. Therefore, over time the Fe(III) in the sediments closest to the site of acetate injection is depleted and can limit the Geobacter activity (Anderson et al., 2003; Vrionis et al., 2005). As an initial step towards the goal of including a constraint‐based microbial sub‐model in a comprehensive model for in situ uranium bioremediation, a constraint‐based model of Geobacter sulfurreducens was previously constructed (Mahadevan et al., 2006). This model accurately describes the growth of G. sulfurreducens under various conditions and predicted the phenotype of gene deletions with 90% success (qualitative prediction of growth or no growth) (Segura et al., 2008). The model was a valuable tool for developing strategies for increasing the respiration rate of G. sulfurreducens for microbial fuel cell applications (Izallalen et al., 2008). The G. sulfurreducens constraint‐based model predicts that metabolic fluxes under Fe(III)‐limiting conditions are significantly different than when the electron donor, acetate, limits metabolism. Under electron acceptor‐limiting conditions the predicted growth yield is 25% of that under electron donor‐limiting conditions as more of the acetate that is consumed is directed towards catabolic reactions. Furthermore, under electron acceptor‐limiting conditions some of the electrons derived from acetate oxidation are released as hydrogen. These predictions are consistent with decreased growth yields observed in Fe(III)‐limited chemostats (Esteve‐Nunez et al., 2005) and hydrogen production in such cultures (A. Esteve‐Nunez, in preparation). These results further support the ability of the G. sulfurreducens genome‐scale metabolic model to accurately represent the network level changes in physiology in response to perturbations in the local environment and suggest that the metabolism of Geobacter species can change dramatically as conditions change during in situ uranium bioremediation.
Nutrient availability may also greatly influence growth yields during bioremediation. For example, at the uranium bioremediation field study site in Rifle, CO, ammonium concentrations varied from 300 µM to undetectable within a small field plot (P. Mouser, unpublished data). Due to the high energetic cost of nitrogen fixation growth yields of Geobacter species per mole of acetate consumed are significantly higher in the presence of ammonium than when nitrogen fixation is required (Bazylinski et al., 2000; Methe et al., 2005) and this yield difference is captured in the constraint‐based model. A range of other environmental variables such as the availability of phosphate (N'Guessan et al., 2008), dissolved iron for assimilation into iron‐containing proteins (O'Neil et al., 2008) and oxygen (Mouser et al., 2009) among others are likely to also be important factors influencing the growth of Geobacter species during in situ uranium bioremediation.
Communities of multiple organisms can be modelled with constraint‐based modelling (Stolyar et al., 2007), but for simplicity, we have chosen an example of in situ subsurface bioremediation application that is essentially catalysed by one microbial genus as an initial attempt to apply constraint‐based modelling to bioremediation. Uranium is mobile in the oxidized form, U(VI), but relatively insoluble in the reduced form, U(IV). Various microorganisms can reduce U(VI) (Lovley et al., 1991; Lovley and Phillips, 1992; Lloyd and Macaskie, 2000; Lloyd and Lovley, 2001; Lovley et al., 2004). Stimulating microbial reduction of U(VI) to U(IV) in the subsurface is a promising strategy for immobilizing subsurface uranium contamination and preventing its further mobility (Finneran et al., 2002; Anderson et al., 2003; Vrionis et al., 2005; Wall and Krumholz, 2006). Molecular analyses have revealed that stimulating microbial U(VI) reduction with the addition of simple organic electron donors such as acetate or ethanol commonly results in the growth of Geobacter species as the primary U(VI)‐reducing microorganisms (Holmes et al., 2002; Chang et al., 2005; Mohanty et al., 2008), although other organisms have been observed to predominate in some cases (Cardenas et al., 2008). At a uranium‐contaminated study site in Rifle, CO the addition of acetate to the groundwater effectively stimulated removal of U(VI) from the groundwater (Anderson et al., 2003; Yabusaki et al., 2007). U(VI) removal is associated with a bloom of Geobacter species with this one genus accounting for over 80% of the microbial population during active U(VI) removal from the groundwater (Anderson et al., 2003; Holmes et al., 2005; Holmes et al., 2007). This predominance of Geobacter suggests that if it was possible to predictively model the growth and activity of Geobacter this would provide a microbial model sufficient to predictively model acetate‐dependent in situ uranium bioremediation at the Rifle site.
Here we demonstrate how constraint‐based modelling is likely to contribute a better representation of the growth and activity of Geobacter species in the subsurface than other commonly employed microbial models and describe a method for coupling the constraint‐based G. sulfurreducens model with existing hydrological and geochemical models. We demonstrate that even this first‐generation coupled model is able to adequately describe U(VI) reduction in a recent in situ uranium bioremediation field experiment.
Results and discussion
Influence of environmental conditions on growth yields
For the initial modelling effort described here, the three factors whose concentrations are known to vary greatly during in situ uranium bioremediation, acetate, Fe(III) and ammonium were considered. Other factors will be incorporated into future modelling efforts. The physiology of subsurface Geobacter was modelled for 1000 possible combinations of environmental conditions during in situ uranium bioremediation representing all possible combinations for 10 discrete concentrations within environmentally relevant ranges for acetate (0–3 mM), Fe(III) (0–10 mM) and ammonium (0–1 mM). To increase resolution of the table at low concentrations (where metabolic limitations are expected and fluxes change most rapidly), we used an exponential distribution of sampling points within the ranges above rather than uniform spacing. Note that for consistency in reaction stoichiometry all concentrations are expressed in molar units; the method of converting solid‐phase Fe(III) concentrations to molar units is described in the Experimental procedures section. Rates of substrate uptake are required as inputs to the constraint‐based model. These were modelled with Michaelis–Menten kinetics because uptake of acetate and Fe(III) follows Michaelis–Menten kinetics (Esteve‐Nunez et al., 2005) and presumably this is also true for ammonium. This coupling of the constraint‐based model with a Michaelis–Menten kinetic model is referred to as the hybrid constraint‐based model.
The hybrid model predicted no growth of Geobacter for 600 of the 1000 different potential environmentally relevant combinations of acetate, Fe(III) and ammonium availability that were modelled. It was predicted that under these conditions, the concentration of one or more substrates was too low to supply enough ATP for maintenance energy requirements. For example, when acetate availability is the factor limiting growth a minimum flux of 0.9 mmol gdw−1 h−1 is required (Fig. 1A) where ‘gdw’ represents grams dry weight of microbial biomass. When Fe(III) availability limits growth a minimum flux of 7.2 mmol gdw−1 h−1 for Fe(III)s) is needed to provide enough ATP for maintenance energy requirements (Fig. 1C). Flux rate is related to substrate availability and the inability to grow at low concentrations of limiting substrate results in a minimum threshold concentration of that substrate, below which Geobacter cannot metabolize the substrate (Fig. 1B and D). Similar minimum thresholds for the substrate butyrate have been observed during the growth of Syntrophus aciditrophicus (Jackson and Mcinerney, 2002). Predicted thresholds are ∼0.001 mM for acetate, and ∼0.1 mM for Fe(III)s).
Figure 1.
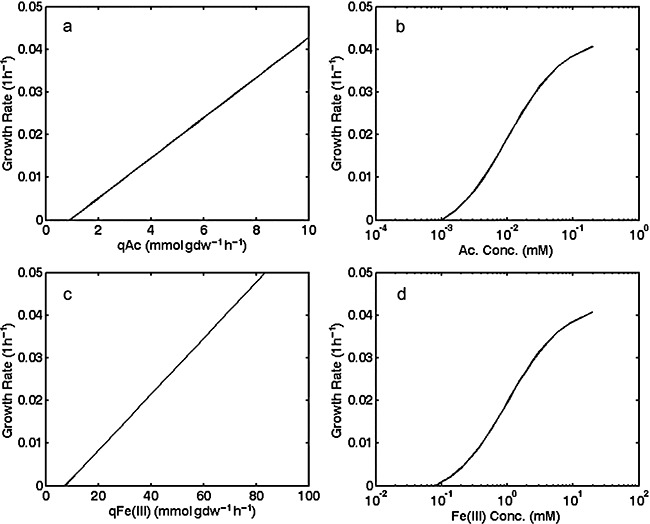
Predictions from genome‐scale model of growth rates at different uptake rates of acetate and Fe(III) and for different acetate and Fe(III) concentrations when acetate or Fe(III) availability is the factor limiting growth. A. Acetate uptake (qAc) as a function of growth rate when acetate is the limiting nutrient. B. Acetate concentration as a function of growth rate when acetate is the limiting nutrient. C. Fe(III) consumption rate [qFe(III)] as a function of growth rate when Fe(III) is the limiting nutrient. D. Fe(III) concentration as a function of growth rate when Fe(III) is the limiting nutrient.
For the remaining 400 out of the 1000 possible combinations of nutrient availability the predicted biomass yield varied over nearly an order of magnitude, from approximately 0.5 to 4.2 g of cell dry weight per mole of acetate consumed (Fig. 2). Note that, because of lumping of values into histogram bins, the range of the individual values is larger than the range of bin midpoints shown in Fig. 2, and that a small number of biomass yield values lower than 1.0 g of cell dry weight per mole of acetate consumed were not included in the histogram plot because they constituted only about 1% of the total number. As indicated in Fig. 2, the same growth yield was possible for different types of nutrient limitation, depending upon the concentration of all three nutrients. These results indicate that, based upon nutrient availability, growth yield can vary substantially and that different physiological states can have similar biomass yields.
Figure 2.
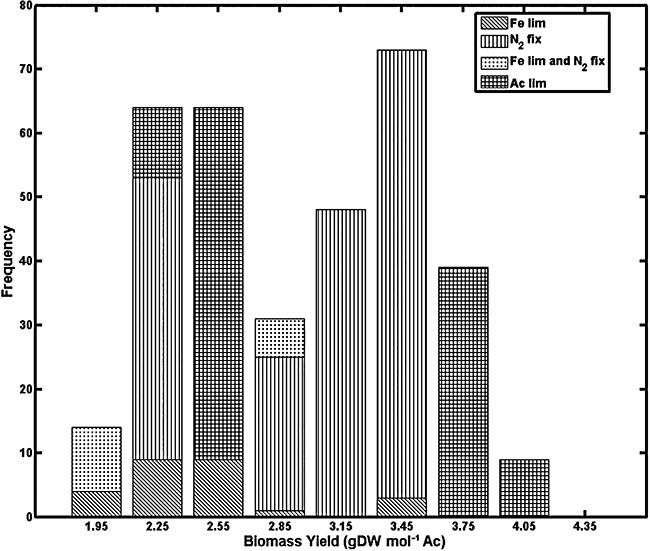
Frequencies of biomass yield levels within the 1000‐element look‐up table generated by the in silico model of G. sulfurreducens for various environmental conditions. In the legend, ‘N2 fix’ denotes nitrogen fixation, and ‘Fe lim’ and ‘Ac lim’ denote iron‐limited and acetate‐limited conditions respectively.
Coupling the constraint‐based model with reactive transport model
In order to determine how Geobacter will respond in subsurface environments undergoing bioremediation it is useful to couple the constraint‐based Geobacter model with a reactive transport model that can define the spatial and temporal variability in geochemical environments experienced by the microorganisms. For the reactive transport model, we used the code HYDROGEOCHEM (Yeh et al., 2004).
HYDROGEOCHEM is a comprehensive simulator of coupled fluid flow, hydrologic transport, heat transfer and biogeochemical reactions under variably saturated conditions in two or three dimensions. It uses a finite element method on unstructured grids, iteratively solving fluid flow, heat transfer and reactive chemical transport equations. A general reaction‐based approach to biogeochemical processes was implemented in the code so that it can be applied to a wide range of problems (Fang et al., 2003; Fang et al., 2006). Programmed reaction types include aqueous complexation, adsorption‐desorption, ion‐exchange, oxidation‐reduction, precipitation‐dissolution and microbially mediated reactions.
Coupling the reactive transport model with the hybrid constraint‐based model is illustrated conceptually in Fig. 3. The right side of the figure represents the HYDROGEOCHEM reactive transport model, which simulates hydrologic and geochemical processes within the aquifer discretized on a numerical grid as described in the Experimental procedures section. At each time step the constraint‐based metabolic model is referenced to specify metabolic reaction rates for the simulated geochemical conditions in each grid element at that time. The metabolic model provides fluxes for all microbially mediated reactions. These fluxes then feed back to the reactive transport model as reaction rates for the current time step, and the reactive transport model is stepped forward one time interval, after which the process is repeated. The step of referencing of the metabolic model from the reactive transport model can take one of two forms: (i) concurrent execution of the metabolic model through a direct subroutine call from the reactive transport model or (ii) selection of metabolic fluxes at each time step of the reactive transport simulation from a large set of pre‐calculated metabolic model solutions covering the expected range of environmental conditions.
Figure 3.
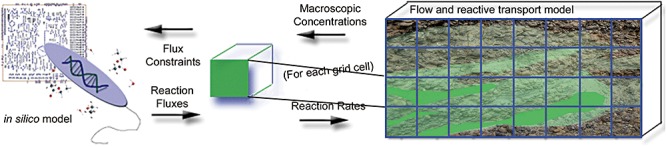
Schematic representation of the coupling between an in silico model of microbial metabolism (left) and a subsurface reactive transport model (right). The coupling can be in the form of either direct calls to the in silico model during execution of the reactive transport model or prior simulation of a large number of scenarios using the in silico model to generate a look‐up table that is then referenced during execution of the reactive transport model. In either case, flux constraints from the reactive transport model dictate the output from the in silico model, which is in turn fed back to the reactive transport model in terms of reaction fluxes (including biomass yields).
While direct coupling through a subroutine call is conceptually straightforward, it would require construction and solution of a linear programming problem (the constraint‐based model) for each grid cell of the reactive transport model at each time step. For a field‐scale reactive transport model with explicit representation of geologic heterogeneity on a fine grid, the number of grid cells could be very large [e.g. millions (White et al., 2008)]. Therefore, computational demands of the direct coupling approach may be prohibitive. Furthermore, some linear systems could fail to converge to an optimal solution, which could cause a large simulation to halt frequently unless proper error‐handling rules were implemented.
Although there are some potential solutions to these problems, and we continue to pursue direct coupling of the constraint‐based and reactive transport codes, as a first demonstration we followed the second approach above that does not require repeated solution of the constraint‐based model during execution of the reactive transport model. This approach utilizes pre‐calculated predictions of the hybrid constraint‐based model for the 1000 possible combinations of environmentally relevant concentrations of acetate, Fe(III) and ammonium described above as a look‐up table. During execution of the reactive transport model, reaction fluxes are obtained by interpolating within the look‐up table. At each time step and for each grid cell a subroutine is called that interrogates the look‐up table and linearly interpolates between the concentrations nearest those occurring in the given grid cell to define reaction fluxes and biomass yields.
Column simulation
The coupled reactive transport/metabolic model described above was executed for a hypothetical column experiment. The hypothetical (simulated) column was 15 cm long and 2.5 cm in diameter, with a porosity of 0.38 and a water flux rate of 0.35 ml min−1. The initial sediment concentration of Fe(III) was 7.8 mM (58.6 mg per kg dry sediment) and the initial biomass was 1 µM [approximately 5 × 10⁶ cells ml−1 assuming a dry cell weight of 2.1 × 10⁻¹¹ mg/cell based on previously reported measurements for Geobacter species (Tang et al., 2007); see Experimental procedures for conversion between molar units and cells ml−1]. A constant feed of 3 mM acetate solution was injected into the upstream end of the simulated column. For comparison, the system was also simulated using an equivalent conventional Monod kinetic reaction model. Details of both models are provided in the Experimental procedures section below.
Comparison of the coupled reactive transport/metabolic model with conventional Monod modelling demonstrated that there were some similarities in the predictions of both models. For example, for both models the acetate concentration at or near the injection level of the column remained near 3.0 mM at all times, with the exception of a small drop around 30 h in the Monod model and a nearly imperceptible drop near 100 h in the coupled model (Fig. 4A). Both models predicted that dissolved Fe(II) increases (Fig. 4B) as Fe(III) reduction takes place (Fig. 4D), and then drops off when the solid‐phase Fe(III) becomes depleted.
Figure 4.
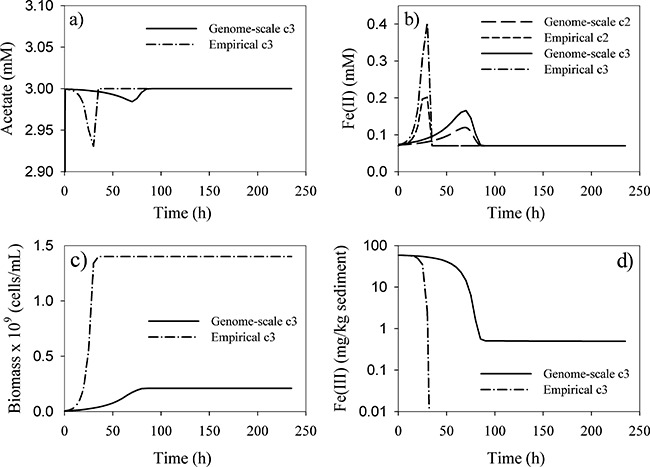
Comparison of simulations of reduction of Fe(III) by G. sulfurreducens in a hypothetical column experiment with acetate as the electron donor. Solid line: coupled genome‐scale metabolic model and geochemical simulation. Dashed lines: simulation with the conventional empirical Monod model. All figures except (b) show simulated concentrations at the column outlet, 15 cm from the inlet of the column. Because of the fast flow and high acetate concentration relative to reaction rates, differences in concentrations along the column axis are negligible in most cases. However, Fe(II) concentrations accumulate along the length of the column as Fe(III) reduction is occurring at similar rates everywhere in the column. Therefore, (b) shows Fe(II) concentrations at two locations: c2 = midpoint of the column (7.5 cm from the inlet); c3 = column outlet (15 cm from the inlet).
However, there were two important differences between the predictions of the two models. The conventional Monod model predicted much more cell growth than the metabolic model (Fig. 4C). This difference is due to the lower yield coefficients computed by the metabolic model relative to the thermodynamically based constant value used in the conventional model. This result is consistent with other recent experimental and theoretical studies that have shown that Geobacter species have lower energy transfer efficiencies during growth coupled to Fe(III) reduction than the yields that are predicted with thermodynamics‐based approaches (Tang et al., 2007; Sayyar et al., 2008). In such approaches it is typically assumed that the fraction of electron donor that is converted to biomass is 0.6 (Rittmann and McCarty, 2001). However, a 50% lower energy transfer efficiency for biomass yield is needed to represent the observed physiology of G. sulfurreducens (Sayyar et al., 2008). Because of the imposed conditions of excess acetate and ammonium throughout the simulation, and abundant iron through most of the feasible growth stage, the large majority (over 99%) of the biomass yield values drawn from the look‐up table were at the high end of the distribution, although a small number of lower yields were used during the portion of the simulation that was iron‐limited prior to infeasibility. Therefore, in this simulation, the relatively low yield predicted by the genome‐scale model is more important than variability in yield. However, under more highly variable conditions as would be expected in a heterogeneous field system, spatial and temporal variability in biomass yield could play a more significant role. These hypothetical column simulations are being used to guide design of planned laboratory experiments that will exercise the coupled model through a broad range of environmental conditions and provide a rigorous test of the coupled model.
Another important distinction between the predictions of the two modelling approaches was that the Monod model predicted continued activity of Geobacter until Fe(III) was completely depleted (Fig. 4D). In contrast, the metabolic model predicted that Geobacter activity will stop at Fe(III) concentrations of 0.1 mM because, as noted above, at this level not enough energy to meet maintenance requirements is conserved. This prediction of a minimum threshold of Fe(III) necessary to support the activity of Geobacter is qualitatively consistent with field results and laboratory incubations of sediments that have consistently indicated that the activity of Geobacter species in subsurface sediments stops before all of the readily reducible Fe(III) is depleted (Finneran et al., 2002; Anderson et al., 2003).
Simulation of in situ uranium bioremediation
Next, the ability of the coupled hybrid constraint‐based and reactive transport models to predict the fate of uranium in an in situ uranium bioremediation field experiment was evaluated. In 2002 a field experiment was conducted at the uranium bioremediation study site in Rifle, CO (Anderson et al., 2003). Acetate was introduced into the groundwater through a series of injection wells and downgradient geochemical changes were monitored in a series of monitoring wells (Fig. 5). As detailed in the Experimental procedures section a pre‐existing reactive transport model (Yabusaki et al., 2007; Y. Fang, S.B. Yabusaki, S.J. Morrison, J.P. Amonette and P.E. Long, in preparation) was coupled with the hybrid constraint‐based model using the look‐up table approach. The time frame of the simulation was limited to the period when Fe(III) reduction was the predominant terminal electron‐accepting process and U(VI) was being actively removed from the groundwater; at longer time intervals accessible Fe(III) became depleted, sulfate reduction became the predominant terminal electron accepting process, and U(VI) was no longer effectively reduced (Anderson et al., 2003). Modelling the sulfate reduction phase with a genome‐based model is not yet feasible because of the lack of genome sequence for an appropriate acetate‐oxidizing sulfate reducer.
Figure 5.
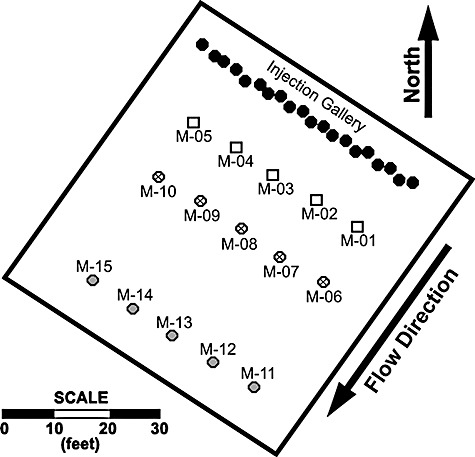
Diagram showing the well layout at the Rifle, CO bioremediation research site. Well numbers are referenced in Fig. 6. Black closed circles represent wells in the injection gallery; labelled wells are monitoring locations. Modified from fig. 1 of Yabusaki and colleagues (2007).
For the original field‐scale model, rate parameters for microbial Fe(III) and U(VI) reduction coupled to acetate oxidation were determined by calibration of the model outputs to observed concentration trends and the potential energy yield (Rittmann and McCarty, 2001) was held constant (Yabusaki et al., 2007). In contrast, the only variable for the constraint‐based model approach was the initial cell biomass, which was set at 5 × 10⁵ cells ml−1, consistent with enumeration of Fe(III) reducers in this environment (Holmes et al., 2007). Because U(VI) reduction pathways have not yet been specifically identified in the genome‐scale model, we used the fitted rate formulations and parameters from Yabusaki and colleagues (2007) to simulate U(VI) reduction in the coupled model. Under that formulation the U(VI) reduction rate depends on the acetate and U(VI) concentrations and is biomass‐independent. Therefore, any differences in predicted rates of U(VI) reduction between the two modelling approaches are the result of differences in predictions of acetate utilization rates.
In the field experiment, acetate concentrations were, as expected, initially highest in the wells closest to the injection gallery and U(VI) was reduced first within this zone (Fig. 6). As acetate migrated downgradient there was a corresponding initiation of U(VI) reduction in successive sets of downgradient zones. Differences between model predictions and specific observation points primarily reflect the fact that the field experiment had substantial variability in delivery of acetate throughout the test plot due to non‐uniform injection rates and flow heterogeneities (Anderson et al., 2003; Vrionis et al., 2005; Yabusaki et al., 2007).
Figure 6.
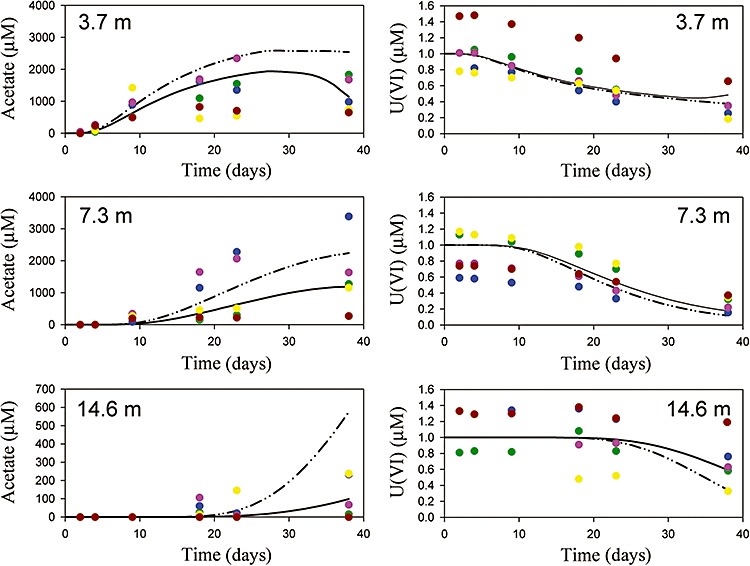
Acetate utilization and U(VI) reduction at the Rifle, CO bioremediation research site. Results are shown for three groups of monitoring wells at three different distances from the acetate injection gallery: top = 3.7 m, middle = 7.3 m, bottom = 14.6 m. Coloured symbols represent field observations from the 2002 experiment (Anderson et al., 2003; Yabusaki et al., 2007), with each colour denoting a single well in the group over time. Dashed lines represent numerical simulation results using the coupled in silico and reactive transport model, and solid lines are the simulation results from the original model (Yabusaki et al., 2007).
The predictions of the coupled and original models are very similar overall (Fig. 6). Although both modelling approaches can simulate the observations equally well in a post‐experimental sense, the coupled model did not require parameter calibration to the experiment data. Thus, the coupled modelling approach offers the possibility of not only describing, but actually predicting field‐scale behaviour.
In general, the coupled model appears to slightly under‐predict acetate utilization rates, leading to higher acetate concentrations. In particular, at the farthest wells from the injection gallery simulated acetate concentrations for the coupled model are too high at the later time points. However, this result is sensitive to the assumed initial biomass and the acetate uptake rate assumed for the metabolic model runs. Therefore, it would be possible to optimize the initial biomass and acetate uptake rate as calibration parameters to provide the best fit to the observations, although this was not attempted here as the refinement of calibration parameters was not a goal of this study. It would probably be better to attempt to experimentally constrain these parameters as inputs to the model and use the coupled model in a predictive manner without calibration parameters.
Conclusions
The results suggest that genome‐scale metabolic models can be combined with the appropriate reactive transport models to effectively describe bioremediation processes. The constraint‐based metabolic modelling approach offers several potential advantages over more conventional Monod modelling of bioremediation. Most importantly, the growth and activity of the microorganisms influencing bioremediation are predicted from detailed information on the physiology of these microorganisms. This makes it feasible to generate predictive models that derive from first principles rather than the empirical parameter fitting typical of previously described microbial models. For this reason the appropriate genome‐scale models are likely to be applicable to a wider range of environmental conditions and locations than more empirically calibrated models. For example, the results demonstrate that constraint‐based modelling can predict important changes in the flux of substrates that result from changes in environmental conditions and the associated differences in cell yield that impact on the extent of cell growth in the subsurface. This contrasts with the much less realistic assumption of fixed yields in conventional Monod modelling. Another key output from the constraint‐based modelling approach is the prediction of minimum thresholds of substrates that are necessary in order to maintain metabolism. The concept of minimum metabolic thresholds limiting the activity and interaction of microorganisms has existed for some time (Lovley et al., 1982; Lovley, 1985), but until now, metabolic‐based strategies for estimating environmentally relevant minimum thresholds have not been available.
Admittedly, the constraint‐based model summarized here is still relatively simplistic compared with the complexity of subsurface environments. It does not contain important factors such as death rates of microorganisms and focuses on only a few of the nutrients that might potentially impact on metabolism and growth yields. Furthermore, although it is likely that in situ uranium bioremediation can reasonably be modelled by considering just the growth and activity of Geobacter species, the communities involved in most bioremediation processes are much more complex, which will require expanding the modelling approach to incorporate multiple genome‐scale models. Finally, the local geochemical environment experienced by microorganisms varies at length scales much smaller than that typically used to discretize reactive transport model domains. The assumption of full mixing at the sub‐grid scale therefore introduces significant scale issues into simulations, which will best be addressed by implementing coupled geochemical/metabolic simulations at the pore scale and developing methods for rigorously upscaling to model grid scales. Attempts to increase the complexity of the modelling to incorporate these considerations are underway.
Experimental procedures
Genome‐scale metabolic model simulations
A previously published genome‐scale metabolic model was used to simulate the metabolic flux distributions for acetate‐limiting and Fe(III)‐limiting conditions (Mahadevan et al., 2006). In both cases, the acetate uptake was fixed to 10 mmol gdw−1 h−1 based on experimentally observed acetate uptake rates (Esteve‐Nunez et al., 2005). In the case of Fe(III) limitation, Fe(III) consumption rate was constrained to be lower than 50 mmol gdw−1 h−1 so as to simulate Fe(III) limitation.
As simulations of the genome‐scale metabolic model require the uptake of the limiting nutrient as an input, we specified the uptakes rates of the key nutrients [acetate, Fe(III) and NH4] using Michaelis–Menten kinetics. The Vmax parameters in the Michaelis–Menten uptake kinetics were set to be 10 mmol gdw−1 h−1 for acetate, 100 mmol gdw−1 h−1 for Fe(III), 0.5 mmol gdw−1 h−1 for NH4, while the KS parameters were fixed to 0.01 mM for acetate, 1 mM [represented as the amount of Fe(III) per litre of aqueous volume] for Fe(III) and 0.1 mM for NH4. These parameters were chosen so that the growth rates were consistent with the known microbial physiology (Esteve‐Nunez et al., 2004; Esteve‐Nunez et al., 2005).
In order to identify the infeasibility threshold during acetate‐limiting conditions, a range of acetate concentrations were specified so that the acetate uptake was varied from 0 to 10 mmol gdw−1 h−1, while allowing unlimited Fe(III) consumption. For identifying the infeasibility threshold during Fe(III)‐limiting conditions, we specified the Fe(III) concentration range so that the Fe(III) consumption rate varied from 0 to 100 mmol gdw−1 h−1, while acetate uptake was unlimited (excess acetate).
In order to generate the look‐up table, we choose 10 different concentrations of acetate, Fe(III) and NH4, over their allowed ranges, resulting in 1000 combinations. For each of these 1000 cases, we calculated the uptake/consumption rates and imposed these constraints to restrict the uptake/consumption rates and maximized the growth rate to obtain the metabolic flux distribution.
Column simulations
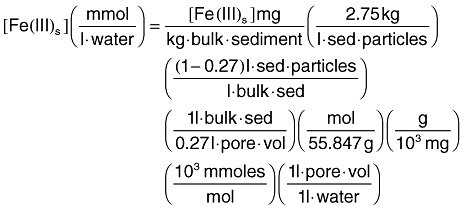
The HYDROGEOCHEM model was used to perform the original and coupled simulations of porous media flow, advection and dispersion of soluble species [acetate, NH4, Fe(II)], iron reduction coupled to acetate oxidation and biomass growth in a hypothetical homogeneous one‐dimensional (1‐D) flow system. The simulated column was 15 cm long and 2.5 cm in diameter, with a porosity of 0.38 and a water flux rate of 0.35 ml min−1 (which corresponds to about 1.33 h per pore volume). A grid spacing of 0.5 cm was used. The initial sediment concentration of Fe(III)s was 7.8 mM, given in terms of moles of solid‐phase iron in a volume of aquifer containing 1 l of water; this value is equivalent to 58.6 mg of Fe(III) per kilogram of dry sediment. Conversion between molar units and weight per dry sediment assumes a porosity of 0.27 and sediment particle density of 2.75 kg l−1.
 |
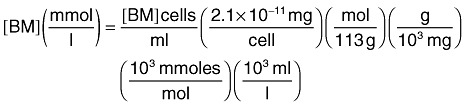
The initial biomass was 1 µM. Representation of biomass in molar units uses the following conversion, assuming a dry cell weight of 2.1 × 10⁻¹¹ mg/cell and a molecular formula of C5H7O2N with molecular weight of 113 g mol−1:
 |
A constant feed of 3 mM acetate solution was injected into the upstream end of the simulated column. Two different approaches were used to model the rate of iron reduction and biomass growth.
In the empirical Monod modelling approach the Fe(III) reduction reaction rate was calculated using a Monod formulation structured such that the reaction was controlled by whichever substrate is limiting [acetate or Fe(III)]:
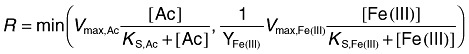 |
where Vmax,Ac and Vmax,Fe(III) are the maximum uptake rate for acetate and Fe(III) and KS,Ac and KS,Fe(III) are half saturation constants for acetate and Fe(III). YFe(III) is the stoichiometry coefficient of Fe(III) in the following reduction reaction.
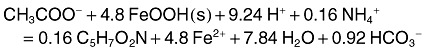 |
The stoichiometry in this irreversible reaction is energetics‐based (Rittmann and McCarty, 2001) under the assumption of a biomass molecular formula of C5H7O2N and a constant energy‐transfer efficiency value of 0.6. The Vmax parameters were set the same as for the genome‐scale simulations (see description above). Fe2+, Ca2+, K+, Mg2+, Na+, HCO3‐ and their aqueous complexes were considered in the reaction network; initial concentrations of these components were set to 7 × 10⁻⁵, 4.3 × 10⁻³, 2.7 × 10⁻³, 4.7 × 10⁻⁵, 6.5 × 10⁻³ and 7 × 10⁻⁵ M respectively. The initial pH was set to 7.0.
The genome‐scale approach utilizes the look‐up table generated with the genome‐scale model (as described above) to prescribe the consumption rates of acetate, NH4 and Fe(III), the production rate of Fe(II), and the microbial yield at different points in space and time, rather than using the Monod rate formulation and constant reaction stoichiometry and yield coefficient.
Field‐scale simulations
The HYDROGEOCHEM model was used to perform the Monod and genome‐scale simulations of porous media flow, advection and dispersion of soluble species [acetate, NH4, Fe(II)], iron reduction coupled to acetate oxidation and biomass growth at an uranium bioremediation experimental research site. The Old Rifle UMTRA site is on a flood plain of the Colorado River, and the shallow unconfined aquifer at the site is in an alluvium layer approximately 7 m thick with the average water table at ∼4 m depth. The aquifer is contaminated by residual uranium leached from the removed mill tailings (Anderson et al., 2003; Chang et al., 2005; Vrionis et al., 2005), transported by groundwater as hexavalent U(VI) with maximum concentrations c. 300 µg l−1. The aquifer is typically characterized by low dissolved oxygen (< 0.2 p.p.m.) and nitrate (< 0.25 p.p.m.). Additional description of the site hydrogeology and geochemical characterization can be found in Anderson and colleagues (2003).
For both the empirical Monod and genome‐scale models, we used the steady 1‐D flow and transport modelling specification of Yabusaki and colleagues (2007), in which a Darcy flux of 0.075 m day−1 and a dispersivity of 0.95 m were calibrated with the bromide tracer data for the 2002 experiment. A uniform porosity of 0.27 was assumed based on previous characterization (DOE, 1999). The 1‐D model represents the gallery of 20 fully penetrating injection wells as an upgradient boundary at which the injected acetate solution was assumed to be completely mixed with inflowing groundwater over the full saturated thickness and injection gallery width. Representing a 3‐D system as 1‐D also assumes that groundwater flow and reactive transport behaviour is uniform vertically and laterally within the experimental domain, which implies that physical and chemical heterogeneities in the directions orthogonal to the 1‐D domain are neglected. Such variability exhibits itself in variations between observed tracer and reactive solute concentrations at different wells the same distance from the injection point (Fig. 6), thus implying that this model attempts to simulate observed concentrations at each of three sets of monitoring wells (as indicated in Fig. 5) only in an average sense. The 1‐D domain downgradient of the injection gallery is discretized with 120 uniform 0.3‐m‐long grid cells (a total simulation distance of 36 m). The three sets of monitoring wells are located 3.7, 7.3 and 14.6 m downgradient of the injection gallery. The initial aqueous concentrations (and inflow concentrations at the upgradient model boundary) were set at 70 µM for Fe(II) and 1.0 µM for U(VI), based on measured concentrations at background wells (upgradient of the injection gallery). In the empirical Monod model, NH4 is considered to be non‐limiting.
The reaction systems for the two models differ primarily in terms of how the rate of Fe(III) reduction (coupled to acetate utilization) is defined, whether biomass is explicitly modelled and how the microbial yield coefficient is specified. The original, empirical Monod model (Yabusaki et al., 2007) does not directly simulate changes in biomass (in other words, reaction rates are not biomass‐dependent), but does use an assumption of constant biomass yield in specifying the stoichiometry of microbially mediated reactions. That stoichiometry is energetics‐based (Rittmann and McCarty, 2001) under the assumption of a biomass molecular formula of C5H7O2N and an energy‐transfer efficiency value of 0.6. In contrast, the coupled model explicitly calculates biomass yield under varying conditions (as represented in Fig. 2) and tracks changes in biomass over time, and the rates of microbially mediated reactions are specified per unit of biomass. Accordingly, in the coupled model it is necessary to specify the initial biomass concentration, which was assumed to be 5 × 10⁵ cells ml−1. As no direct experimental observations are available, this value was treated as a calibration parameter. However, the value selected is consistent with Geobacter concentrations observed in carbon‐poor surficial aquifers (Holmes et al., 2007). Also, because of heterogeneity and local diffusion gradients at the pore scale, solutes are not fully mixed at the field scale as they are in the chemostat experiments on which microbial uptake rates were based. Therefore, we reduced the uptake rates for acetate, iron and ammonium by one order of magnitude to generate the look‐up table used for the field‐scale simulation.
The reaction for Fe(III) reduction in the original Yabusaki and colleagues (2007) model is
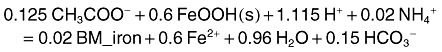 |
The reaction for U(VI) reduction is given by
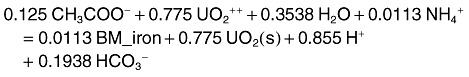 |
The rate of acetate utilization in the original model is given by the sum over multiple double Monod terms, each representing a particular terminal electron acceptor as follows (Yabusaki et al., 2007):
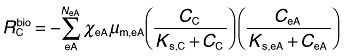 |
where NeA = number of terminal electron acceptors, Cc = acetate concentration, CeA = terminal electron acceptor concentration, µm,eA = acetate oxidation rate coefficient for the terminal electron acceptor, Ks,C = half‐saturation coefficient for acetate, Ks,eA = half‐saturation coefficient for the terminal electron acceptor.
χ eA is the indicator coefficient for using the terminal electron acceptor, which is not related to thermodynamics and is determined by the concentration of the precedent terminal electron acceptor, which is more energetically favourable. Several parameters in this system were estimated using a stepwise calibration approach as described by Yabusaki and colleagues (2007), and Y. Fang, S.B. Yabusaki, S.J. Morrison, J.P. Amonette and P.E. Long (in preparation). In the original model (Yabusaki et al., 2007), three terminal electron acceptors were considered [Fe(III), U(VI) and sulfate], but here we consider only the early portion of the simulation dominated by Fe(III) and U(VI) reduction, prior to onset of sulfate reduction. The rate of consumption/generation of other species [e.g. NH4, Fe(II)] is then computed from the acetate utilization rate using the reaction stoichiometry and assumed constant energy‐transfer efficiency.
In the coupled genome scale/reactive transport model, the rate formulation above is replaced by the rate of acetate utilization coupled to Fe(III) reduction extracted from the pre‐computed look‐up table based on the genome‐scale metabolic model. The same approach described above was used to create the look‐up table based on the genome‐scale metabolic model simulations, except that the ranges considered for the three substrates [acetate, Fe(III) and NH4] were changed to reflect the range of concentrations at the field site. In the case of NH4, no field observations were available, so a background concentration of 1.0 mM was assumed. Concentrations of aqueous uranium [U(VI)aq] are very small relative to the abundance of other electron acceptors [in this case, Fe(III)]. Therefore, it is typically assumed that uranium reduction does not contribute significantly to the metabolism of metal‐reducing microbial populations. Accordingly, the existing genome‐scale metabolic model of G. sulfurreducens does not explicitly consider pathways for U(VI) reduction. Therefore, the U(VI) reduction rate for the coupled model was calculated based on the acetate and U(VI) concentrations using the same double‐Monod rate model as the original model. Differences between the original and coupled model in terms of simulated uranium concentrations result indirectly from differences in acetate utilization rates coupled to iron reduction between the Monod kinetic and genome‐based models.
Acknowledgments
This research was supported by the Office of Science (BER), US Deparment of Energy, Cooperative Agreement No. DE‐FC02‐02ER63446 and Grant No. DE‐FG02‐07ER64367. Pacific Northwest National Laboratory is operated by Battelle for the US Department of Energy.
References
- Anderson R.T., Vrionis H.A., Ortiz‐Bernad I., Resch C.T., Peacock A., Dayvault R. Stimulating the in situ activity of Geobacter species to remove uranium from the groundwater of a uranium‐contaminated aquifer. Appl Environ Microbiol. 2003;69:5884–5891. doi: 10.1128/AEM.69.10.5884-5891.2003. et al. [DOI] [PMC free article] [PubMed] [Google Scholar]
- Bazylinski D.A., Dean A.J., Schuler D., Phillips E.J.P., Lovley D.R. N‐2‐dependent growth and nitrogenase activity in the metal‐metabolizing bacteria, Geobacter and Magnetospirillum species. Environ Microbiol. 2000;2:266–273. doi: 10.1046/j.1462-2920.2000.00096.x. [DOI] [PubMed] [Google Scholar]
- Cardenas E., Wu W.M., Leigh M.B., Carley J., Carroll S., Gentry T. Microbial communities in contaminated sediments, associated with bioremediation of uranium to submicromolar levels. Appl Environ Microbiol. 2008;74:3718–3729. doi: 10.1128/AEM.02308-07. et al. [DOI] [PMC free article] [PubMed] [Google Scholar]
- Chang Y.J., Long P.E., Geyer R., Peacock A.D., Resch C.T., Sublette K. Microbial incorporation of C‐13‐labeled acetate at the field scale: detection of microbes responsible for reduction of U(VI) Environ Sci Technol. 2005;39:9039–9048. doi: 10.1021/es051218u. et al. [DOI] [PubMed] [Google Scholar]
- Covert M.W., Xiao N., Chen T.J., Karr J.R. Integrating metabolic, transcriptional regulatory and signal transduction models in Escherichia coli. Bioinformatics. 2008;24:2044–2050. doi: 10.1093/bioinformatics/btn352. [DOI] [PMC free article] [PubMed] [Google Scholar]
- DOE. 1999.
- Esteve‐Nunez A., Nunez C., Lovley D.R. Preferential reduction of Fe(III) over fumarate by Geobacter sulfurreducens. J Bacteriol. 2004;186:2897–2899. doi: 10.1128/JB.186.9.2897-2899.2004. [DOI] [PMC free article] [PubMed] [Google Scholar]
- Esteve‐Nunez A., Rothermich A., Sharma M., Lovley D.R. Growth of Geobacter sulfurreducens under nutrient‐limiting conditions in continuous culture. Environ Microbiol. 2005;7:641–648. doi: 10.1111/j.1462-2920.2005.00731.x. [DOI] [PubMed] [Google Scholar]
- Fang Y., Yeh G.T., Burgos W.D. A general paradigm to model reaction‐based biogeochemical processes in batch systems. Water Resour Res. 2003;39:1083. [Google Scholar]
- Fang Y.L., Yabusaki S.B., Yeh G.T. A general simulator for reaction‐based biogeochemical processes. Comput Geosci. 2006;32:64–72. [Google Scholar]
- Feist A.M., Palsson B.O. The growing scope of applications of genome‐scale metabolic reconstructions using Escherichia coli. Nat Biotechnol. 2008;26:659–667. doi: 10.1038/nbt1401. [DOI] [PMC free article] [PubMed] [Google Scholar]
- Finneran K.T., Anderson R.T., Nevin K.P., Lovley D.R. Potential for Bioremediation of uranium‐contaminated aquifers with microbial U(VI) reduction. Soil Sediment Contam. 2002;11:339–357. [Google Scholar]
- Fong S.S., Palsson B.O. Metabolic gene‐deletion strains of Escherichia coli evolve to computationally predicted growth phenotypes. Nat Genet. 2004;36:1056–1058. doi: 10.1038/ng1432. [DOI] [PubMed] [Google Scholar]
- Holmes D.E., Finneran K.T., O'Neil R.A., Lovley D.R. Enrichment of members of the family Geobacteraceae associated with stimulation of dissimilatory metal reduction in uranium‐contaminated aquifer sediments. Appl Environ Microbiol. 2002;68:2300–2306. doi: 10.1128/AEM.68.5.2300-2306.2002. [DOI] [PMC free article] [PubMed] [Google Scholar]
- Holmes D.E., Nevin K.P., O'Neil R.A., Ward J.E., Adams L.A., Woodard T.L. Potential for quantifying expression of the Geobacteraceae citrate synthase gene to assess the activity of Geobacteraceae in the subsurface and on current‐harvesting electrodes. Appl Environ Microbiol. 2005;71:6870–6877. doi: 10.1128/AEM.71.11.6870-6877.2005. et al. [DOI] [PMC free article] [PubMed] [Google Scholar]
- Holmes D.E., O'Neil R.A., Vrionis H.A., N'Guessan L.A., Ortiz‐Bernad I., Larrahondo M.J. Subsurface clade of Geobacteraceae that predominates in a diversity of Fe(III)‐reducing subsurface environments. Isme J. 2007;1:663–677. doi: 10.1038/ismej.2007.85. et al. [DOI] [PubMed] [Google Scholar]
- Ibarra R.U., Edwards J.S., Palsson B.O. Escherichia coli K‐12 undergoes adaptive evolution to achieve in silico predicted optimal growth. Nature. 2002;420:186–189. doi: 10.1038/nature01149. [DOI] [PubMed] [Google Scholar]
- Izallalen M., Mahadevan R., Burgard A., Postier B., Didonato R., Jr, Sun J. Geobacter sulfurreducens strain engineered for increased rates of respiration. Metab Eng. 2008;10:267–275. doi: 10.1016/j.ymben.2008.06.005. et al. [DOI] [PubMed] [Google Scholar]
- Jackson B.E., Mcinerney M.J. Anaerobic microbial metabolism can proceed close to thermodynamic limits. Nature. 2002;415:454–456. doi: 10.1038/415454a. [DOI] [PubMed] [Google Scholar]
- Lloyd J., Macaskie L. Bioremediation of radioactive metals. In: Lovley D.R., editor. ASM Press; 2000. pp. 272–327. [Google Scholar]
- Lloyd J.R., Lovley D.R. Microbial detoxification of metals and radionuclides. Curr Opin Biotechnol. 2001;12:248–253. doi: 10.1016/s0958-1669(00)00207-x. [DOI] [PubMed] [Google Scholar]
- Lovley D.R. Minimum threshold for hydrogen metabolism in methanogenic bacteria. Appl Environ Microbiol. 1985;49:1530–1531. doi: 10.1128/aem.49.6.1530-1531.1985. [DOI] [PMC free article] [PubMed] [Google Scholar]
- Lovley D.R. Cleaning up with genomics: applying molecular biology to bioremediation. Nat Rev Microbiol. 2003;1:35–44. doi: 10.1038/nrmicro731. [DOI] [PubMed] [Google Scholar]
- Lovley D.R., Phillips E.J.P. Reduction of uranium by desulfovibrio‐desulfuricans. Appl Environ Microbiol. 1992;58:850–856. doi: 10.1128/aem.58.3.850-856.1992. [DOI] [PMC free article] [PubMed] [Google Scholar]
- Lovley D.R., Dwyer D.F., Klug M.J. Kinetic‐analysis of competition between sulfate reducers and methanogens for hydrogen in sediments. Appl Environ Microbiol. 1982;43:1373–1379. doi: 10.1128/aem.43.6.1373-1379.1982. [DOI] [PMC free article] [PubMed] [Google Scholar]
- Lovley D.R., Phillips E.J.P., Gorby Y.A., Landa E.R. Microbial reduction of uranium. Nature. 1991;350:413–416. [Google Scholar]
- Lovley D.R., Holmes D.E., Nevin K.P. Dissimilatory Fe(III) and Mn(IV) reduction. Adv Microb Physiol. 2004;49:219–286. doi: 10.1016/S0065-2911(04)49005-5. [DOI] [PubMed] [Google Scholar]
- Lovley D.R., Mahadevan R., Nevin K.P. Systems biology approach to bioremediation with extracellular electron transfer. In: Díaz E., editor. Caister Academic Press; 2008. pp. 71–96. [Google Scholar]
- Mahadevan R., Edwards J.S., Doyle F.J. Dynamic flux balance analysis of diauxic growth in Escherichia coli. Biophys J. 2002;83:1331–1340. doi: 10.1016/S0006-3495(02)73903-9. [DOI] [PMC free article] [PubMed] [Google Scholar]
- Mahadevan R., Bond D.R., Butler J.E., Esteve‐Nunez A., Coppi M.V., Palsson B.O. Characterization of metabolism in the Fe(III)‐reducing organism Geobacter sulfurreducens by constraint‐based modeling. Appl Environ Microbiol. 2006;72:1558–1568. doi: 10.1128/AEM.72.2.1558-1568.2006. et al. [DOI] [PMC free article] [PubMed] [Google Scholar]
- Methe B.A., Webster J., Nevin K., Butler J., Lovley D.R. DNA microarray analysis of nitrogen fixation and Fe(III) reduction in Geobacter sulfurreducens. Appl Environ Microbiol. 2005;71:2530–2538. doi: 10.1128/AEM.71.5.2530-2538.2005. [DOI] [PMC free article] [PubMed] [Google Scholar]
- Mohanty S.R., Kollah B., Hedrick D.B., Peacock A.D., Kukkadapu R.K., Roden E.E. Biogeochemical processes in ethanol stimulated uranium‐contaminated suhsurface sediments. Environ Sci Technol. 2008;42:4384–4390. doi: 10.1021/es703082v. [DOI] [PubMed] [Google Scholar]
- Mouser P.J., Holmes D.E., Perpetua L.A., DiDonato R., Postier B., Liu A., Lovley D.R. 2009. , and ) Quantifying expression of Geobacter spp. oxidative stress genes in pure culture and during in situ uranium bioremediation. ISME J (in press). doi: 10.1038/ismej.2008.126. [DOI] [PubMed]
- N'Guessan A.L., Elifantz H., Mouser P., Nevin K.P., Manley K., Williams K.H. 2008. et al.) Molecular analysis of phosphate limitation in Geobacter species during bioremediation of a uranium‐contaminated aquifer. In American Society for Microbiology 108th General Meeting. Boston, MA, USA.
- O'Neil R.A., Holmes D.E., Coppi M.V., Adams L.A., Larrahondo M.J., Ward J.E. Gene transcript analysis of assimilatory iron limitation in Geobacteraceae during groundwater bioremediation. Environ Microbiol. 2008;10:1218–1230. doi: 10.1111/j.1462-2920.2007.01537.x. et al. [DOI] [PubMed] [Google Scholar]
- Price N.D., Reed J.L., Palsson B.O. Genome‐scale models of microbial cells: evaluating the consequences of constraints. Nat Rev Microbiol. 2004;2:886–897. doi: 10.1038/nrmicro1023. [DOI] [PubMed] [Google Scholar]
- Reed J.L., Famili I., Thiele I., Palsson B.O. Towards multidimensional genome annotation. Nat Rev Genet. 2006;7:130–141. doi: 10.1038/nrg1769. [DOI] [PubMed] [Google Scholar]
- Regnier P., Dale A.W., Pallud C., Van Lith Y., Bonneville S., Hyacinthe C. Incorporating geomicrobial processes in reactive transport models of subsurface environments. In: Nützmann G., Viotti P., Aagaard P., editors. Springer; 2005. pp. 109–125. et al.. In Reactive Transport in Soil and Groundwater. , and (eds). Heidelberg, Germany: , pp. [Google Scholar]
- Rittmann B.E., McCarty P.L. McGraw‐Hill; 2001. [Google Scholar]
- Sayyar B., Nevin K., Lovley D., Mahadevan R. 2008. , and ) Thermodynamic electron equivalent models of Geobacter species. In American Society for Microbiology 108th General Meeting. Boston, MA, USA.
- Scheibe T.D., Fang Y., Murray C.J., Roden E.E., Chen J., Chien Y.‐J. Transport and biogeochemical reaction of metals in a physically and chemically heterogeneous aquifer. Geosphere. 2006;2:220–235. et al. [Google Scholar]
- Schuetz R., Kuepfer L., Sauer U. Systematic evaluation of objective functions for predicting intracellular fluxes in Escherichia coli. Mol Syst Biol. 2007;3:119. doi: 10.1038/msb4100162. [DOI] [PMC free article] [PubMed] [Google Scholar]
- Schäfer D., Schäfer W., Kinzelbach W. Simulation of reactive processes related to biodegradation in aquifers: 1. Structure of the three‐dimensional reactive transport model. J Contam Hydrol. 1998;31:167–186. [Google Scholar]
- Segura D., Mahadevan R., Juarez K., Lovley D.R. Computational and experimental analysis of redundancy in the central metabolism of Geobacter sulfurreducens. PLoS Comput Biol. 2008;4:e36. doi: 10.1371/journal.pcbi.0040036. [DOI] [PMC free article] [PubMed] [Google Scholar]
- Steefel C.I., DePaolo D.J., Lichtner P.C. Reactive transport modeling: an essential tool and a new research approach for the earth sciences. Earth Planet Sci Lett. 2005;240:539–558. [Google Scholar]
- Stolyar S., Van Dien S., Hillesland K.L., Pinel N., Lie T.J., Leigh J.A., Stahl D.A. Metabolic modeling of a mutualistic microbial community. Mol Syst Biol. 2007;3:92. doi: 10.1038/msb4100131. [DOI] [PMC free article] [PubMed] [Google Scholar]
- Tang Y.J.J., Chakraborty R., Martin H.G., Chu J., Hazen T.C., Keasling J.D. Flux analysis of central metabolic pathways in Geobacter metallireducens during reduction of soluble Fe(III)‐nitrilotriacetic acid. Appl Environ Microbiol. 2007;73:3859–3864. doi: 10.1128/AEM.02986-06. [DOI] [PMC free article] [PubMed] [Google Scholar]
- Varma A., Boesch B.W., Palsson B.O. Stoichiometric interpretation of Escherichia coli glucose catabolism under various oxygenation rates. Appl Environ Microbiol. 1993;59:2465–2473. doi: 10.1128/aem.59.8.2465-2473.1993. [DOI] [PMC free article] [PubMed] [Google Scholar]
- Vrionis H.A., Anderson R.T., Ortiz‐Bernad I., O'Neil K.R., Resch C.T., Peacock A. Microbiological and geochemical heterogeneity in an in situ uranium bioremediation field site. Appl Environ Microbiol. 2005:6308–6318. doi: 10.1128/AEM.71.10.6308-6318.2005. et al. [DOI] [PMC free article] [PubMed] [Google Scholar]
- Wall J.D., Krumholz L.R. Uranium reduction. Annu Rev Microbiol. 2006;60:149–166. doi: 10.1146/annurev.micro.59.030804.121357. [DOI] [PubMed] [Google Scholar]
- White M.D., Oostrom M., Rockhold M.L., Rosing M. Scalable modeling of carbon tetrachloride migration at the Hanford Site using the STOMP simulator. Vadose Zone J. 2008;7:654–666. [Google Scholar]
- Yabusaki S.B., Fang Y., Long P.E., Resch C.T., Peacock A.D., Komlos J. Uranium removal from groundwater via in situ biostimulation: field‐scale modeling of transport and biological processes. J Contam Hydrol. 2007;93:216–235. doi: 10.1016/j.jconhyd.2007.02.005. et al. [DOI] [PubMed] [Google Scholar]
- Yeh G.T., Sun J.T., Jardine P.M., Burgos W.D., Fang Y.L., Li M.H., Siegel M.D. Oak Ridge National Laboratory; 2004. [Google Scholar]