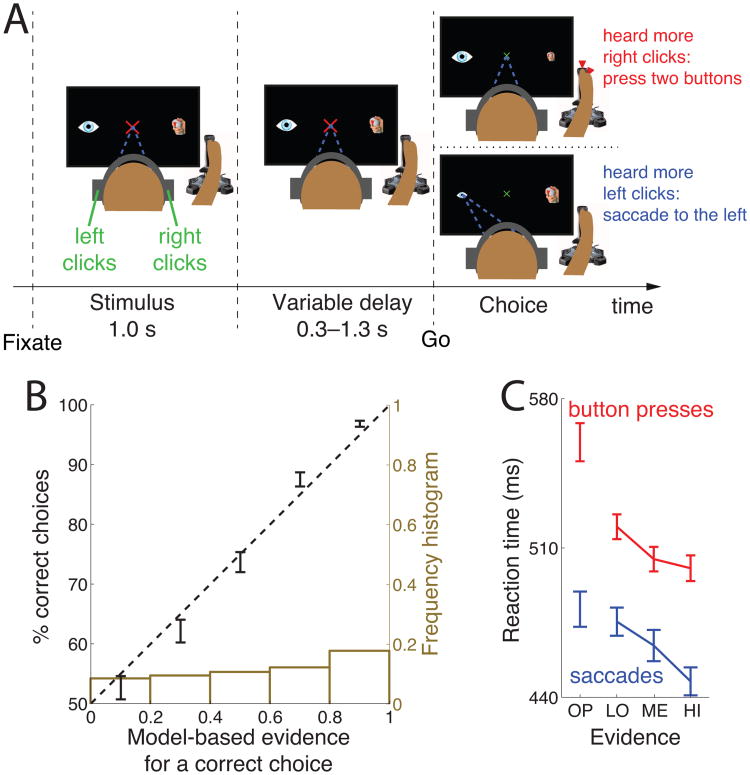
Figure 1.
Decision task and behavioral model.
(A) After acquiring a fixation cross, subjects listen to a binaurally presented auditory stimulus. Subjects decide whether they hear more click sounds in the right ear or in the left ear. The stimulus is followed by a variable delay period. After the delay, the fixation cross shrinks and changes color to green, thus cuing the subject to make a choice. If subjects heard more clicks in the right ear, they press two buttons of the joystick with their right index finger and the thumb. Otherwise, they make a saccade to the eye icon on the left side of the screen.
(B) Mean±SEM percentage of subjects' correct choices as a function of the modeled evidence for that response. The dashed line represents an ideal match between the model's predictions and the probabilistic behavior. The ideal match explains 97.6% of the variance in the 5 data points. The brown histogram gives the number of trials in each bin.
(C) Mean±SEM reaction time for four levels of decision evidence (see text), separately for button press choices (red), and saccade choices (blue).

