

Abstract
In this study we employed joint independent component analysis (jICA) to perform a novel multivariate integration of magnetoencephalography (MEG) and diffusion tensor imaging (DTI) data to investigate the link between function and structure. This model-free approach allows one to identify covariation across modalities with different temporal and spatial scales [temporal variation in MEG and spatial variation in fractional anisotropy (FA) maps]. Healthy controls (HC) and patients with schizophrenia (SP) participated in an auditory/visual multisensory integration paradigm to probe cortical connectivity in schizophrenia. To allow direct comparisons across participants and groups, the MEG data were registered to an average head position and regional waveforms were obtained by calculating the local field power of the planar gradiometers. Diffusion tensor images obtained in the same individuals were preprocessed to provide FA maps for each participant. The MEG/FA data were then integrated using the jICA software (http://mialab.mrn.org/software/fit). We identified MEG/FA components that demonstrated significantly different (p < 0.05) covariation in MEG/FA data between diagnostic groups (SP vs. HC) and three components that captured the predominant sensory responses in the MEG data. Lower FA values in bilateral posterior parietal regions, which include anterior/posterior association tracts, were associated with reduced MEG amplitude (120-170 ms) of the visual response in occipital sensors in SP relative to HC. Additionally, increased FA in a right medial frontal region was linked with larger amplitude late MEG activity (300-400 ms) in bilateral central channels for SP relative to HC. Step-wise linear regression provided evidence that right temporal, occipital and late central components were significant predictors of reaction time and cognitive performance based on the Measurement and Treatment Research to Improve Cognition in Schizophrenia (MATRICS) cognitive assessment battery. These results point to dysfunction in a posterior visual processing network in schizophrenia, with reduced MEG amplitude, reduced FA and poorer overall performance on the MATRICS. Interestingly, the spatial location of the MEG activity and the associated FA regions are spatially consistent with white matter regions that subserve these brain areas. This novel approach provides evidence for significant pairing between function (electrophysiology) and structure (white matter integrity) and demonstrates the sensitivity of this multivariate, multimodal integration technique to group differences in function and structure.
Keywords: Magnetoencephalography (MEG), Diffusion Tensor Imaging (DTI), Schizophrenia, Multisensory Integration, Multimodal Integration, Joint Independent Component Analysis (jICA)
1. Introduction
With the parallel advancement of both functional and structural brain imaging, there is a growing need to find links across these domains (Rykhlevskaia et al., 2008) to obtain a more complete view of the role that brain function and structure play in behavioral outcome. While functional and structural measures have often been considered to provide independent information, there are well-established links at the neuronal level (Chalfie et al., 1985; Gray et al., 2005). Despite these associations at the microscopic level, it is challenging to directly link function and structure at the macroscopic level (Sporns et al., 2005). Yet, the Human Connectome Project is designed specifically to characterize human brain connectivity maps to allow researchers to model brain function relative to brain structure. Based on known relationships between function and structure established through animal studies, one can hypothesize macroscopic associations between function and structure. For example, myelination helps to speed the transfer of information along axons (Waxman, 1980). Therefore, differences in myelination could directly impact the transfer of information between cortical regions.
A handful of previous studies have investigated correlations between MEG and DTI measures (Busse et al., 2005; Fernandez et al., 2011; Gaetz et al., 2010; Jung et al., 2012; Kamada et al., 2007; Roberts et al., 2009; Stufflebeam et al., 2008). All but one of these studies employed a region of interest approach whereby MEG timing and amplitude were linked with DTI measures in one region of interest. This approach allows one to address specific hypotheses, but introduces the risk of missing other critical tracts that may also influence the brain function under study. On the other hand, taking a whole-brain univariate approach by testing whether DTI measures in any voxel correlate with MEG measures tends to be limited in sensitivity due to multiple comparison corrections. For example, Stufflebeam et al. (2008) compared whole brain FA measures to one MEG variable (visual latency). While this approach represents a step forward by performing whole brain analysis of the FA data, it does not capture the spatio-temporal complexity of the MEG data in the multimodal integration and additional univariate comparisons would likely render the results nonsignificant.
A multivariate approach that capitalizes on covariation across datasets and maintains the high dimensionality of both integrated modalities is joint independent component analysis (jICA). This approach has already been used successfully to combine different modalities [e.g. multiple fMRI paradigms (Calhoun et al., 2006a), fMRI with structural MRI/DTI (Calhoun et al., 2006b; Sui et al., 2011), and EEG timing information with fMRI spatial maps (Calhoun et al., 2006c)]. In Calhoun et al. (2006c), the covariation between the timecourse from one EEG electrode location and the spatial fMRI contrast map was identified, providing a means to link data with entirely different scales. The jICA approach provides a single linkage parameter between the data from each of the imaging modalities (e.g. EEG/fMRI) for each independent component and each subject, thereby reducing the multiple comparisons that often limit the ability to fully describe cross-modal datasets. The linkage parameter and the independent components are identified based on covariation across modalities despite the different units measured by each technique (temporal or spatial). This provides a model-free approach to identify latent factors in complex datasets across vastly different data structures. Despite the wide range of multimodal integration performed using this approach (fMRI/fMRI, fMRI/sMRI, and EEG/fMRI) to date, jICA has not been used to fuse MEG and DTI data.
Fusing data across modalities is important for disorders like schizophrenia where functional and structural deficits are widely reported, but the link between these disparate results has not yet been established. Schizophrenia is a heterogeneous disorder of unknown etiology characterized by a complex set of symptoms in addition to cognitive deficits (Green et al., 2004). Furthermore, a broad range of brain abnormalities including both focal and distributed changes in structure and function have been identified in schizophrenia (Ellison-Wright and Bullmore, 2009; Gur and Gur, 2010; Naatanen and Kahkonen, 2009; Rissling et al., 2010; Schmitt et al., 2011); thus schizophrenia may provide one of the better models from which to study the function/structure relationships due to the broad literature base and the heterogeneity within the disorder.
Structural deficits in schizophrenia have been described consistently with recent meta-analyses identifying widespread decreases in gray matter volume in medial temporal lobe, superior temporal lobe and parietal cortex (Schmitt et al., 2011; Segall et al., 2009). DTI studies have described various changes in white matter integrity in patients with schizophrenia (Konrad and Winterer, 2008) with methods and results varying greatly across studies. The variations across studies is underscored by the results of a quantitative meta-analysis showing reduced fractional anisotropy (FA) in schizophrenia patients relative to healthy controls, in only two common regions in left hemisphere: deep frontal and deep temporal white matter (Ellison-Wright and Bullmore, 2009). The large variation in results across studies may be related to the variation in specific populations, study size and/or analysis approaches. In a much larger cohort than any of the individual studies included in the meta-analysis, Caprihan et al. (2011) identified widespread differences in FA between schizophrenia patients versus controls suggesting a broad impact on white matter integrity in schizophrenia. This unimodal DTI study also employed multivariate ICA to analyze FA maps which may have provided increased sensitivity to group differences, compared to univariate measures. Based on these wide-ranging deficits in white matter and inconsistency of results across studies, a multimodal and multivariate approach is warranted to better understand the link between function and structure in heterogeneous disorders such as schizophrenia.
Functional differences in schizophrenia range from reports of atypical basic sensory processing [e.g. auditory: (Naatanen and Kahkonen, 2009; Thoma et al., 2003); visual: (Butler and Javitt, 2005; Silverstein and Keane, 2011) dorsal visual stream deficits (Butler and Javitt, 2005; Kim et al., 2006; Schechter et al., 2003)] to altered network activations during cognitive tasks (Gur and Gur, 2010; Ragland et al., 2012). Furthermore, unisensory deficits have been associated with cognitive deficits and clinical outcome measures in schizophrenia (Butler et al., 2008; Javitt, 2009; Leitman et al., 2005). Despite a wide range of functional studies, multisensory integration has been less well studied in schizophrenia. Multisensory integration studies in schizophrenia provide evidence of deficits in multisensory processing (de Gelder et al., 2002; Williams et al., 2010) and are most often attributed to deficits in functional connectivity. Yet, Stone et al. (2011) also showed both behavioral and cortical compensation in patients with schizophrenia using multisensory versus unisensory stimuli.
Here we utilize the jICA approach to integrate the MEG timeseries with whole brain DTI measures, which is a natural extension of the previous integration of EEG and fMRI [temporal and spatial measures (Calhoun et al. 2006c)]. In the current study, we employ MEG to capitalize on the increased spatial specificity provided by planar gradiometers, compared with EEG. The FA spatial maps are identical in data structure to a single fMRI spatial map. We assert that the jICA approach is particularly useful for studying a heterogeneous group since it capitalizes on the rich within-subject covariation across modalities. To assess cortical connectivity in schizophrenia, a multisensory integration paradigm was employed during the MEG recording. Based on the role that white matter plays in facilitating transfer of information in the brain, decreased white matter integrity is expected to result in desynchronization or delay of the signal transfer between brain regions, and thereby result in the reduction of MEG amplitude and/or prolongation of peak latencies. Therefore, we hypothesized that reduced FA values in temporal and posterior brain regions (e.g. superior longitudinal fasciculus) would be associated with either delayed activity or reduced amplitude MEG responses. Furthermore, based on previous reports of dorsal stream deficits in patients with schizophrenia (Butler and Javitt, 2005) and the strong representation of peripheral visual field input to the dorsal visual areas (Livingstone and Hubel, 1987; Stephen et al., 2002; Ungerleider and Desimone, 1986), we hypothesized that patients would show greater deficits in the peripheral visual condition (dorsal stream processing) than in the central visual condition (ventral stream processing).
2. Materials and Methods
2.1 Participants
The study was approved by the University of New Mexico Health Sciences Center Human Research Review Committee and complied with the Declaration of Helsinki. All participants provided written informed consent prior to study procedures. As a part of a larger study, we identified 29 schizophrenia patients (SP) and 29 age-matched healthy control (HC) participants with good quality MEG and DTI data, described below. Participant characteristics are presented in Table 1. All participants had no history of neurological disorders (e.g. epilepsy), as determined by a standard neurological exam and review of symptoms. Participants also had no history of significant head trauma (<10 minutes loss of consciousness) and no current diagnosis of substance abuse (excluding nicotine). The healthy controls had no history of psychiatric disorder (assessed with SCID-NP) and no first degree relatives with a history of a psychotic disorder. The SP were confirmed to have a DSM-IV-TR diagnosis of schizophrenia or schizoaffective disorder with the SCID-IP. All SP were clinically stable with no recent medication change within one month of study enrollment and no change of medication across the data collection period (cognitive testing, MEG and DTI were performed at separate visits). The SP symptoms [Positive and Negative Syndrome Scale - PANSS (Kay et al., 1987)], social functioning [University of California Performance Skills Assessment - UPSA (Mausbach et al., 2007)] and antipsychotic medication dose [as olanzapine equivalents; (Gardner et al., 2010)] were determined for each patient.
Table 1.
Participant Demographics (mean – SE)
| HC (N = 29) | SP (N = 29) | |
|---|---|---|
| Age (years) | 38.1 (2.2) | 37.1 (2.9) |
| Gender (M/F) ratio | 21 M (72%), 8 F | 25 M (86%), 4 F |
| Ethnicity | 18 Caucasian (62%) 9 Hispanic (31%) 2 African American (7%) |
19 Caucasian (65%) 10 Hispanic (35%) |
| Education (years) | 14.3 (0.3)* | 13.1 (0.4)* |
| IQ | 113 (2.8)** | 101 (3.5)** |
| Olanzapine equivalent | -- | 15.6 (2.0) |
| Positive Symptoms | -- | 14.21 (0.97) |
| Negative Symptoms | -- | 15.75 (1.11) |
- p < 0.05
- p < 0.01
2.2 Neuropsychological Testing
All participants completed an extensive neuropsychological testing battery characterizing IQ (Wechsler Abbreviated Scale of Intelligence), premorbid IQ [Wechsler test of adult reading – WTAR (Wechsler, 2001)], and the Measurement and Treatment Research to Improve Cognition in Schizophrenia (MATRICS) cognitive assessment battery (Kern et al., 2008; Nuechterlein et al., 2008).
2.3 MEG Behavioral Task
During the MEG measurements, participants performed an auditory/visual multisensory integration task with unassociated visual and auditory stimuli (Lovelace et al., 2003). These stimuli were presented in an ecologically relevant visual background (soccer field; see Fig. 1). Visual (V) stimuli were presented at one of two positions (centered at 1.8 and 8° below fixation for “far” and “near” stimuli, respectively). Participants were required to fixate upon the goalie in the image, which was centered horizontally and vertically with the participants’ nasion at a distance of 1 meter. The Far and Near stimuli were scaled (stimuli subtended 1° and 2.7° visual angle, respectively) to conform with the cortical magnification factor (Rovamo and Virsu, 1979) and to activate an equivalent patch of occipital cortex across the two stimuli. The auditory (A) stimulus was a 550 Hz tone (200ms duration with 30 ms Hanning ramp up/down) presented at two different volumes [45 dB (Far) and 63 dB (Near) above hearing threshold] to mimic the perception of a soccer ball bouncing near or far from the participant. Hearing threshold was determined independently for each ear of each participant just prior to beginning the task, which helped to eliminate perceived volume differences across subjects due to poor ear insert placement or peripheral hearing deficits. To determine the hearing threshold, 1000 Hz tones were randomly presented above and below threshold in a step-wise fashion. The participant was required to press a button whenever they heard a tone. Participants with hearing thresholds greater than 37 dB, after two separate ear insert placement attempts, were excluded from the study. Six conditions were presented to the participants during the task: A Near/Far, V Near/Far, AV Near/Far. A and V stimuli were always congruent during AV conditions; that is, Near and Far conditions never conflicted between stimulus modalities during multisensory presentation. All conditions were presented randomly with an inter-stimulus interval (ISI) of 1500-1900 ms. Stimuli were presented in 6 blocks to provide the participant with regular breaks. The participants were each presented with ~150 trials per condition with data collection taking approximately 45 minutes. For all conditions, the participant was instructed to decide whether the stimulus (A, V, or AV) was near or far relative to themselves by pressing a button with the index or middle finger of their right hand, respectively. Neurobehavioral Systems’ Presentation program was used for determining hearing threshold, presentation of the stimuli, and recording of behavioral data (reaction time and percent correct). Coincident stimulus triggers generated by Presentation were sent to the MEG data acquisition computer to mark stimulus timing in the MEG dataset. A practice run was presented in the MEG room prior to data collection to ensure that the participant understood the task. During the practice session the participant was provided with feedback on correct/incorrect trials to facilitate learning. This feedback (i.e., a ball rolled into the goal and/or cheering sound was heard for correct trials, or the ball missed the goal and/or a disappointed crowd sound was heard for incorrect trials) was also provided for 20% of the trials during the MEG task to encourage compliance throughout data collection. For data quality purposes, eye-tracking was performed in a subset of participants to confirm compliance with fixation instructions across groups. No significant group differences in task performance were observed in the participants who underwent eye-tracking during MEG data collection.
Fig. 1.
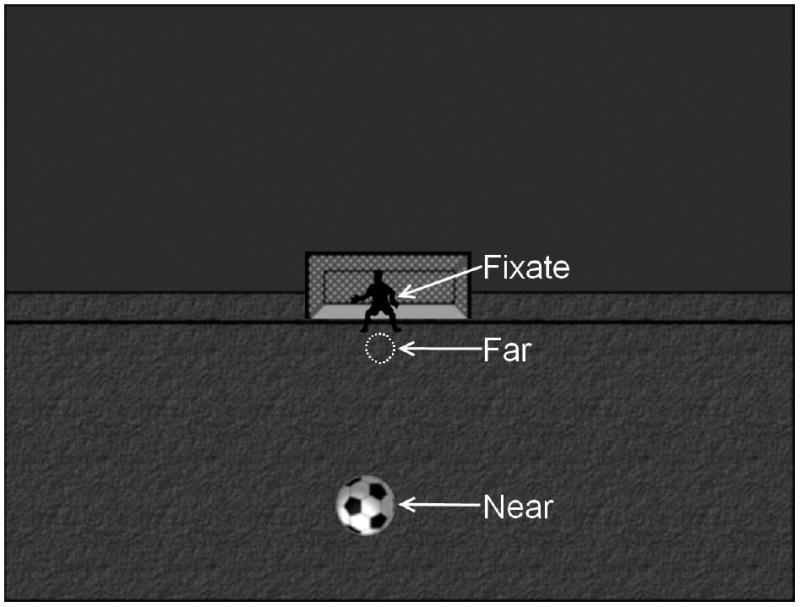
Visual stimuli. A static background (field, sky, goalie and net) was present throughout data collection. The participants were instructed to fixate on the goalie. During the conditions with a visual stimulus a soccer ball was presented to 1 of 2 locations. The soccer ball is shown here in the Near position. The Far visual stimulus location is outlined (white dashed circle).
2.4 MEG
The MEG data were collected using the Elekta Neuromag 306 channel biomagnetometer (Elekta) located in a magnetically shielded room (Vacuumschmelze, Hanau, Germany). Prior to data collection the participant was fitted with a 128-channel EEG cap (EEG data not reported here). Electrocardiogram (ECG) and electroocculogram (EOG) electrodes were also placed (ECG – just below left and right clavicle, EOG –one electrode placed just above the left eyebrow and one placed lateral to the outer canthus of the right eye) to provide signals for artifact rejection of heartbeat and eye-movements, respectively. The MEG head position indicator (HPI) coils were placed around the head and secured with tape. HPI coil location and head shape information was obtained using the Polhemus 3-D tracking device. Three fiducial points (left and right preauricular and nasion) were identified to define the head centered coordinate system in addition to points around the scalp to ease co-registration of the MEG data to the MRI structural image. The MEG data were digitized at 1000Hz (0.03-300 Hz anti-aliasing filter). Continuous HPI monitoring was enabled throughout the MEG data collection.
The MEG data were preprocessed to eliminate artifacts. In particular, the head center for each participant was identified using Neuromag MRILAB software by co-registering the MEG HPI data with the participant’s MRI. This participant-specific head center was used for the scripted Neuromag Maxfilter processing (Taulu and Kajola, 2005). The temporal signal space separation version of the Maxfilter software was employed to: 1. Eliminate distant noise sources from the data; 2. Compensate for any within-subject head movements during the MEG data collection; and 3. Re-align the sensor data to a common head position across participants. Eyeblink artifacts were identified using the EOG channel or anterior temporal MEG channels. A subject-specific averaged eyeblink was identified and modeled using the signal space projection method (Uusitalo and Ilmoniemi, 1997) within the Neuromag Graph and Xfit software. Using a scripted program, MNE (http://www.martinos.org/mne/) was employed to reject bad trials, apply the eyeblink projectors and average the data by stimulus condition.
We did not perform source analysis of the MEG data to maintain the higher data dimensionality associated with MEG waveforms and instead worked in sensor space using the jICA approach. Joint ICA assumes a one-dimensional temporal component requiring that any time information beyond a single sensor be concatenated end-to-end (Liu et al., 2009). Therefore, to limit the length of the MEG timecourse for the ICA analysis while maintaining the spatial variability in the temporal MEG signal, we summarized the MEG signals into a local field power (LFP) measure. The MEG channels were divided into 12 regions (left and right - frontal, central, anterior and posterior temporal, parietal and occipital) with an equal number of planar gradiometers (8 x- and y-planar gradiometer pairs) in each region (see Fig. 2). To limit the spatial spread of the signal, we only included planar gradiometers in the LFP to obtain regional waveforms (Hamalainen et al., 1993). The appropriate unisensory responses (A and V - Near or Far) were combined with the two multisensory conditions AV Near/Far and two different jICA analyses were performed to allow for comparison across the Near/Far conditions. The MEG LFP waveforms were combined into one timeseries and the MEG independent components (see below) were divided back into regions and conditions using custom Matlab programs.
Fig. 2.
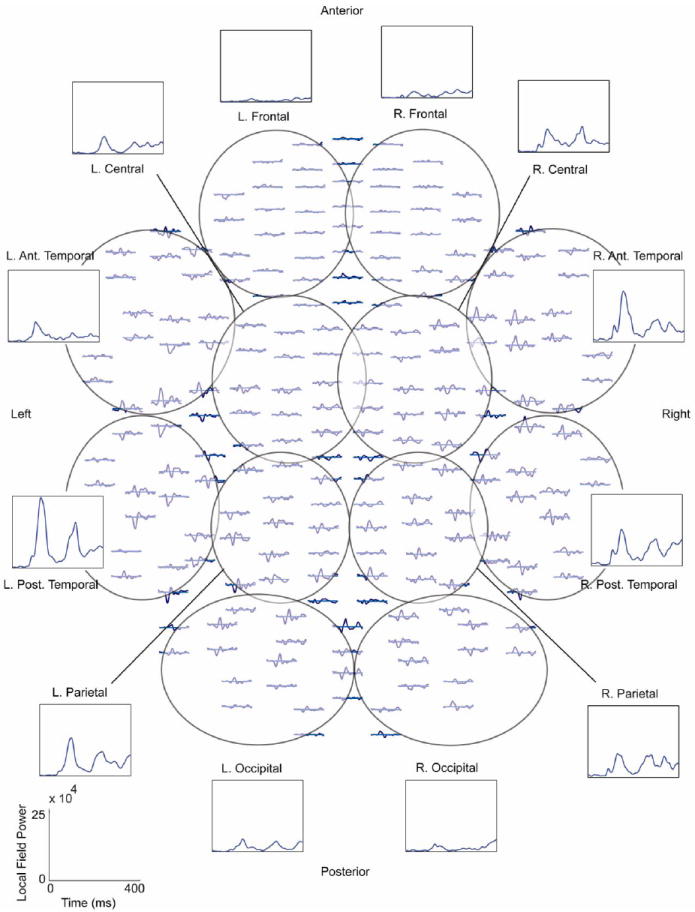
Top down view of magnetoencephalography (MEG) planar gradiometer sensor array. The approximate channel groups used for the local field power (LFP) grouping of the MEG channels are outlined and labeled. An example of the individual waveforms and the LFP for the different regions is included for the AV Near condition for one healthy control. The LFP timecourses were concatenated end-to-end to form one long timeseries for the joint independent component analysis (jICA). LFP scale is shown in the lower left corner. R. = right, L. = left, Ant. = anterior, Post. = posterior.
2.5 MRI/DTI
All MRI images were obtained with a Siemens 3T Trio TIM scanner using the standard 12-channel phased array head coils provided with the system. Sagittal T1-weighted anatomical images were obtained with a multi-echo 3D MPRAGE sequence [TR/TE/TI=2530/1.64, 3.5, 5.36, 7.22, 9.08/1200 ms, flip angle=7°, field of view (FOV)=256 × 256 mm, matrix=256 × 256, 1 mm thick slice, 192 slices, GRAPPA acceleration factor = 2]. The DTI data were collected along the anterior commissure/posterior commissure line, with FOV=256 × 256 mm, 128 × 128 matrix, slice thickness of 2 mm (isotropic 2 mm resolution), NEX=1, TE=84 ms and TR=9000 ms. A multiple channel radio frequency coil was used, with GRAPPA (X2), 35 gradient directions, b=800 s/mm2 and 5 measurements with b=0.
The DTI data processing was performed using FSL and consisted of the following steps: 1) DTI quality check. Data was checked for signal drop out due to subject motion or vibration, significant noise in the phase encoding direction and excessive motion. Participants with signal drop out, noise, or motion were excluded from this analysis, 2) Calculation of diffusion tensor. The diffusion tensor and FA were calculated using dtifit (FSL). All DTI data were registered to the MNI atlas to facilitate cross-subject comparisons. Furthermore, an isotropic 10 mm Gaussian smoothing function was applied to the FA maps using SPM to help account for natural anatomical variation across participants. This amount of smoothing was based on the previous DTI literature in schizophrenia which ranges from no smoothing to 16 mm (Jones et al., 2005).
2.6 jICA
The MEG and DTI data were combined using the approach outlined in Calhoun et al. (2006c) and jICA was performed using the Fusion ICA Toolbox (http://mialab.mrn.org/software). This data-driven approach links the data across modalities in a unit-less comparison of joint associations. Briefly, the MEG data were represented by a single temporal vector for each participant (regions/conditions were concatenated to generate a long single trial of MEG timeseries data for all participants) and the three dimensional FA map voxels were concatenated into a single spatial vector for each participant. Then, the MEG data vectors were combined across participants into a participant × time data matrix (xMEG) and the DTI data vectors were combined across participants into a participant × voxel data matrix (xFA). The MEG and DTI data were scaled by matching the sums of squares across modalities and then combined into a single data matrix [xMEG xFA]. A single scaling factor is used for each modality to maintain the relative amplitude of the MEG and DTI measures across participants. This combined scaled matrix is then used to identify a common mixing matrix by solving the standard ICA equation x = Ac where x is the original data, c are the independent components, and A is the mixing matrix determined by the independent component analysis constraints. In this case, x is the scaled multimodal data matrix [xMEG xFA] and c results in a similarly combined format: [xMEG xFA] = A[cMEG cFA]. The common mixing matrix (A) is obtained by using the infomax algorithm described by Bell and Sejnowski (1995). Multiple ICA analyses are performed as a part of this procedure to confirm the consistency of the ICA analyses. Further details of this approach are described in Calhoun et al. (2006c).
The number of components was determined empirically by first estimating the number of components for the MEG and FA maps separately. Using these component numbers as a guide, the jICA analysis was performed multiple times to identify the number of components which provided component stability across similar component numbers and meaningful divisions of MEG timeseries. With high component numbers (>20) a large number of components did not contribute significantly to the MEG timecourse power (noise sources). With low component numbers (<5), the MEG peak activity was not well separated. The final number of components were 11 for the Near and 12 for the Far jICA analyses. Components were analyzed further if there was a significant group difference based on the ICA loading parameters or if the component MEG timeseries explained a significant portion of the original MEG timeseries (evaluated by z-score significance test to evaluate whether the component accounted for a significant proportion of the original MEG signal relative to the baseline MEG amplitude).
2.7 Statistical Analysis
Reaction times (RT) were compared using a mixed measures analysis of variance (ANOVA). Condition (A, V, AV) and location (Near/Far) were within-subjects factors while group (SP vs. HC) was the between-subjects factor. The jICA components were compared statistically between groups to determine if there were significant differences in the independent component (IC) loading factors between HC versus SP. One IC loading factor is obtained for each participant for each component within a jICA analysis. A higher IC loading factor signifies increased contribution to that component. These IC loading factors were compared with a t-test using the jICA software to determine group differences in IC loading factor weights. Step-wise linear regression was used to determine the predictive power of medication (olanzapine equivalent) and clinical measures (positive and negative symptoms) on IC loading factors in SP. Step-wise linear regression was also used to determine the predictive power of the IC loading factors on RT and cognitive outcomes (MATRICS) across both groups. Significance levels for multiple regressions performed on the same dependent variable were adjusted to account for multiple comparisons. ANOVA and regression analyses were performed using IBM SPSS 20.
3. Results
3.1. Demographics
The participants were well-matched on age, gender, ethnicity and parental education (p > 0.1 for all matching variables). As expected, the SP group attained lower levels of education (p = 0.032) and had reduced IQ scores (p = 0.008) relative to the HC group.
3.2 Reaction Times
The behavioral results show facilitation of the mean RTs in the AV multisensory conditions relative to the unisensory conditions, as predicted. There was a significant condition (A vs. V vs. AV) by group (HC vs SP) interaction (see Table 2) for both Far and Near conditions (F(2,54) = 5.1, p = 0.009). To look at facilitation specifically, we performed a post-hoc 2-way ANOVA (V vs AV; HC vs. SP) to confirm the significant condition x group simple interaction (F(1,54) = 11.4, p = 0.001) with greater behavioral facilitation for SP relative to HC. The AV RTs were compared to V RTs in this case because the participants’ RTs were faster for V than A. Despite a significant between-subjects effect in the full model (A, V, AV), there was no significant difference by group of the AV RTs (F(1,54) = 0.004, p = 0.953) suggesting unisensory RT deficits are compensated for in the AV conditions. By defining facilitation as the smallest difference between unisensory RT and multisensory RT, it was confirmed that the SP group had greater facilitation than HC with a significant main effect of facilitation (fac(SP) > fac(HC) – F(1,54) = 8.5, p = 0.005).
Table 2.
Reaction Times [mean (SE)]
| Near | Far | |||||
|---|---|---|---|---|---|---|
| Participants | A | V | AV | A | V | AV |
| HC | 586 (22.9) | 427 (21.4) | 405 (18.7) | 588 (21.1) | 436 (20.7) | 421 (19.0) |
| SP | 550 (23.8) | 451 (22.2) | 405 (19.4) | 542 (21.8) | 464 (21.4) | 416 (19.7) |
3.3. jICA Components
The DTI data quality was equivalent across groups based on the participant selection process, which eliminated participants who could not remain sufficiently still to obtain good DTI scans. Furthermore, the signal to noise ratio (SNR) was equivalent across groups for the MEG data (SNR for AV Near: HC – 30 (1.7), SP – 26 (1.3); p > 0.05).
We identified 3 ICs in the two jICA analyses that corresponded to the initial prominent sensory peaks (left and right auditory and visual) in the MEG timecourses. The first prominent auditory peak (100-200 ms) was consistently divided into two separate components with one accounting for the 100-200 ms peak visible in right temporal channels (Fig. 3) and one accounting for the auditory 100-200 ms peak visible in left temporal channels (Fig. 4A). In Fig. 3A we show the right anterior temporal component associated with all 12 MEG regions to demonstrate that this component primarily represented auditory activity found in the right temporal sensors in the 100-200 ms time window. For example, in the R. A. Temp. region, the component peaks at the same time as the MEG LFP waveform (compare red tracings with black tracings). Furthermore, the component strength is reduced in all other MEG regions. It is also clear that this component is specifically sensitive to auditory stimuli since there was no significant signal in the V Near condition (see V Near - Fig. 3B). Finally, although the fusion analysis was performed separately for the different AV conditions (Near/Far), the fusion models provided remarkable consistency in components across these analyses (Fig. 3C). The primary FA tract associated with the right temporal MEG component was the splenium of the corpus callosum. There were significant main effects of group (see Table 3; F(1,55) = 4.14, p = 0.047) and location (F(1,55) = 12.1, p = 0.001) for the loading factors of this component implying greater linkages related to the larger amplitudes in HC seen in both modalities (MEG and FA).
Fig. 3.

Right Temporal 100-200 ms MEG Component. A. MEG right temporal component across MEG local field power (LFP) regions. The response to the auditory Near stimulus for each of the 12 regions is shown in bold black lines (healthy controls – solid, schizophrenia patients – dashed). By focusing on just one component (red lines) across the MEG waveform regions, it is clear that this component is specific to the peak shown in sensors located over the right anterior and right posterior temporal (R. A. Temp and R. P. Temp) lobes. R. L. P. Temp. = right/left posterior temporal, Occ. = occipital. B. R. A. Temp LFP across conditions. The top plot is the same as that shown in 3A (Near auditory – A Near). In addition, the responses to the Near visual (V Near) and Near multisensory (AV Near) are shown for the same region. As expected, there is no considerable early response in this region during the V Near condition. Also, the same component explains the early peak in the right temporal channel group during the AV condition. C. Right temporal component across Near/Far fusion analyses. The fusion analysis was performed separately for the different multisensory conditions AV Near/Far. We found good agreement in components across the analyses as demonstrated in this plot. Consistent fractional anisotropy (FA) maps were identified for this right temporal component showing increased FA primarily in the splenium of the corpus callosum. In addition this component consistently explained the first prominent peak seen over right temporal cortex.
Fig. 4.
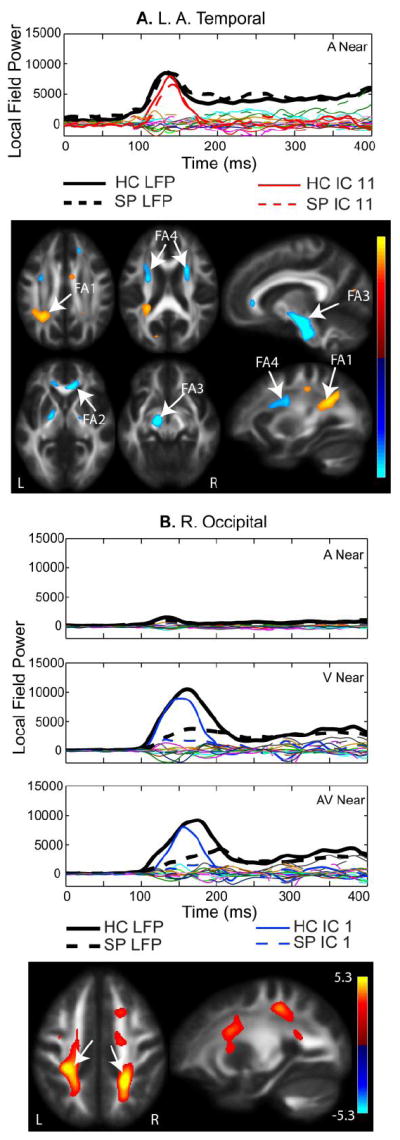
A. Left Anterior Temporal 100-200 ms IC. MEG component for the Near auditory condition is shown. All components from the independent component analysis (ICA) are plotted. The average MEG LFP response for the left anterior temporal region is shown in bold black lines (healthy controls – solid, schizophrenia patients– dashed). The independent component denoted in red is described as the left temporal component, based on the spatial specificity to this MEG region. The fractional anisotropy (FA) map shows increased FA in the left parietal lobe associated with posterior regions of the anterior/posterior association fiber tracts (FA region 1), the genu of the corpus callosum (FA2), the cortico-spinal tract (FA3), and anterior regions that overlap with projection and association fiber tracts (FA4). B. Occipital IC. The IC loading factors for this component were significantly different with HC having larger loading parameters than SP, which corresponds to greater FA bilaterally in the parietal cortex corresponding to the posterior region of the anterior/posterior association fiber tracts (see arrows). Similar to the right temporal component shown in Fig. 3B, the occipital component consistently explained the first prominent peak seen in the channels over left and right occipital cortex. In this case, occipital activity was not divided into left/right occipital components.
Table 3.
Summary of Independent Component (IC) Loading Factor ANOVA results
| Sensory Components | |
|---|---|
| Right Temporal | HC > SP |
| Left Temporal | -- |
| Occipital | HC > SP* |
| Other Components | |
| Mid-latency Temporal | SP > HC |
| Late Central | SP > HC |
This effect was more pronounced in the Near (peripheral visual) condition
The left auditory 100-200 ms component is shown in Figure 4A for the left anterior temporal LFP region. Figure 4A also displays all other components from the jICA analysis in this LFP region. The left temporal component did not show a significant group difference in loading parameters, but it accounted for a significant proportion of the original waveform based on a 2-tailed z-test (p = 0.02) based on the peak amplitude. The components shown in red (solid for HC and dashed for SP) account for the 100-200 ms peak in the left temporal channels, whereas the remaining components did not contribute significantly to the 100-200 ms peak. The activity was localized to the left temporal region, similar to the right temporal component shown in Fig. 3 (i.e., the ICs are spatially selective). The FA regions that co-varied with the left temporal component (Fig. 4A) include posterior regions of the anterior/posterior association fiber tracts (FA1), the genu of the corpus callosum (FA2), the cortico-spinal tract (FA3) and anterior regions that overlap with projection and association fiber tracts (FA4). There were no significant group or location effects for the left temporal IC loading factors.
Figure 4B shows the occipital component associated with the first prominent visual peak (100-200 ms) seen in the occipital channels of the MEG waveforms and the FA map associated with this component. Analogous to the auditory components, there was no distinguishable peak in this component in the occipital channels during the auditory condition, providing additional evidence for separation of these components by sensory response. Increased FA in white matter regions of the parietal cortex, which include anterior/posterior association tracts, was associated with the visual peak in the MEG waveforms. In this case, there was a clear group difference in amplitude. The mixed measures ANOVA comparison of IC loading factors showed a significant group by location interaction (Table 3; main effect of group: F(1,55) = 17.5, p < 0.001; location by group interaction: F(1,55) = 16.2, p < 0.001), with a larger difference in amplitude for peripheral (near) visual stimuli (HC>SP).
Two other components showed significant group differences in jICA loading factors. These components were only identified in the jICA analysis of the Near condition (peripheral visual stimuli). The later temporal (200-300 ms) component (Near only) was associated with increased FA in the anterior projection tracts (Fig 5A – FA1) and left temporal association tracts (Fig. 5A -- FA2). The bilateral late-central component (Near only - Fig. 5B; 250-400 ms) was associated with increased FA in a right medial frontal white matter region which encompasses association and projection white matter tracts. This component was significantly different by group (Table 3; F(1,55) = 16.9, p < 0.001), with SP showing greater IC loading factor values than HC.
Fig. 5.
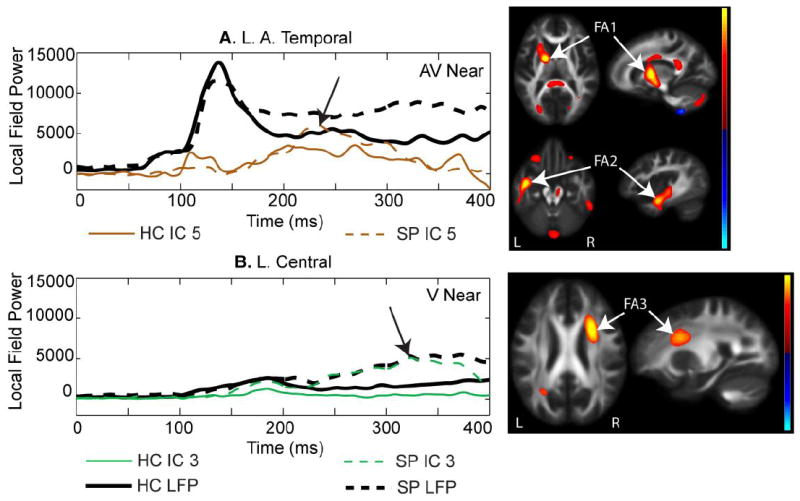
A. Temporal 200-300 ms component. This component was prominent in temporal regions similar to that shown in Fig. 4A, but this component explained a later segment of the magnetoencephalography (MEG) data (200-300 ms). This component was associated with FA increases in anterior projection fiber tracts (FA1) and association tracts in the left posterior temporal region (FA2). B. Central component. This component was prominent in bilateral MEG central LFP regions and consistently showed increased amplitude in schizophrenia patients (SP) over healthy controls (HC). This component was associated with increased FA in a right medial frontal region (FA3) with overlapping association and projection tracts.
To assess the sensitivity of the multivariate jICA approach relative to a univariate approach, we performed a simple regression between the maximal FA voxel and the peak amplitude of the MEG occipital component (Fig. 4B). The maximal FA voxel was located in the left superior parietal region shown in Fig. 4B. The peak MEG amplitude was obtained at 161 ms for the V Near data, representing the peak latency of the visual response. The participant FA and MEG values from the original datasets (prior to jICA) were significantly correlated (r = 0.31; p = 0.019) in this univariate analysis.
Finally, we performed a jICA analysis with 6mm Gaussian smoothing of the FA maps (instead of 10mm) in the Near condition to determine if smoothing affected the jICA results. The results showed surprising consistency across the two smoothing options (6mm and 10mm). The same 11 components were identified in the jICA analysis with the same components showing significant group differences. The correlation of the loading parameters between the two jICA analyses were in the range of 0.968 - 1 (p < 0.000001 for N = 29). This extremely high degree of correlation is also visible in the MEG and DTI component maps across all 11 components (see examples in Supplementary Fig. 1). As expected, the 6 mm smoothing results in more focal FA regions than the 10 mm smoothing condition. The high correlation values were present for both HC and SP with no difference between groups.
3.4. Regression Analysis of IC loading factors with Behavioral and Cognitive Outcomes
To determine the possible influence of clinical outcome measures on IC loading factors, we ran a step-wise linear regression analysis for the SP group. Predictor variables entered into this model included: age, gender, medication dose, negative and positive symptoms, UPSA score, conceptual disorganization and delusions. Conceptual disorganization and delusions were included based on the general hypothesis of our multisensory paradigm that impaired cortical connectivity is directly related to these two symptoms. Conceptual disorganization predicted IC loading factors for the occipital component for the Far condition (β = -0.42; ΔR2 = 0.18; p-value = 0.046; see left column Fig. 6); however, this is not significant with Bonferroni correction across ICs (p < 0.01). The trend shows that lower conceptual disorganization scores corresponded with larger amplitude IC loading factors.
Fig. 6.
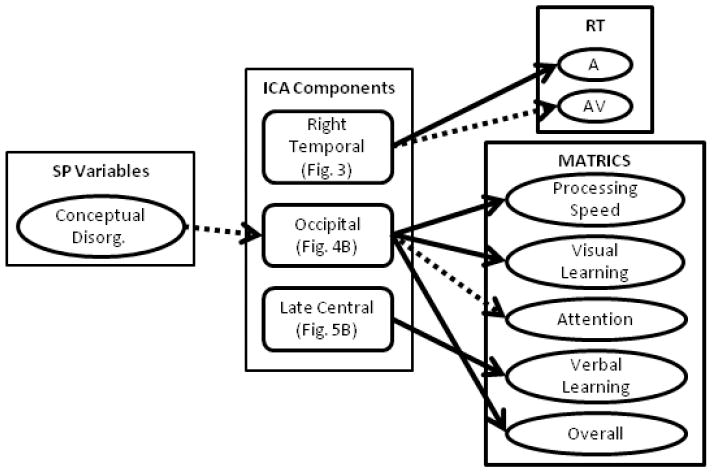
Summary of step-wise linear regression analyses. We performed step-wise linear regression to determine the influence of patient symptoms and medication on independent components as well as the influence of the components on behavioral (RT) and cognitive outcome (MATRICS) measures. The influence of clinical symptoms and medication could only be performed in schizophrenia patients, as this data was not available for healthy controls. To determine ICA predictors of behavior a separate step-wise linear regression was performed in which both HC and SP were included in the model. Significant predictors are denoted by arrows from the middle to the right hand column (see Tables 4 & 5). Solid lines correspond to associations that passed Bonferroni correction and dashed lines denote trends. Conceptual Disorg. = Conceptual Disorganization.
We also performed step-wise linear regression across both groups to determine if specific components influenced the behavioral reaction times while controlling for age and gender (see Fig. 6). The results are summarized in Table 4. The right temporal component (Fig. 4) predicted auditory (A) RT across the fusion analyses (Near and Far) as well as a trend (significant without Bonferroni correction) with AV Far RT. Age was predictive of RT for the (V) RT Near conditions only. While gender and the other jICA components described were also entered into the model, none of these variables were predictive of RT when considering the full model.
Table 4.
Step-wise Regression Parameters: Independent Component (IC) Loading Factors that Predict RT
| RTs | R. Temporal Component | ||
|---|---|---|---|
| β | ΔR2 | p-value | |
| Auditory (A) | |||
| Near | 0.41 | 0.16 | 0.002 |
| Far | 0.44 | 0.20 | 0.001 |
| AV | |||
| Far | 0.31 | 0.09 | 0.022* |
not significant with Bonferroni correction p<0.01
Finally, we performed a final set of step-wise linear regression analyses to identify the predictive ability of the jICA components on outcome results for the MATRICS, while controlling for age and gender (Fig. 6). The results are summarized in Table 5. Only the Near condition ICs were predictive of MATRICS scores. The occipital component (Fig. 4B) was predictive of processing speed, visual learning, attention (trend) and overall MATRICS score. The central component (Fig. 5) was predictive of verbal learning. The occipital component showed a positive correlation with MATRICS scores, whereas the central component was negatively correlated with verbal learning.
Table 5.
Step-wise Regression Parameters: Near - Independent Component (IC) Loading Factors that Predict MATRICS performance
| MATRICS | Near | ||
|---|---|---|---|
| β | ΔR2 | p-value | |
| Occipital | |||
| Processing Speed | 0.39 | 0.15 | 0.003 |
| Visual Learning | 0.41 | 0.17 | 0.001 |
| Attention | 0.31 | 0.10 | 0.02* |
| MATRICS Overall | 0.40 | 0.16 | 0.004 |
| Central | |||
| Verbal Learning | -0.41 | 0.16 | 0.002 |
not significant with Bonferroni correction p<0.01
4. Discussion
This multivariate analysis provides insight into how multimodal variation across MEG and DTI data can be utilized to explore relationships between function and structure in combination with clinical outcome characteristics, behavioral RT, and cognitive functioning in patients versus healthy controls. It provides a method to analyze whole-brain, multimodal data without having to control for thousands of multiple comparisons, as required with univariate analyses. In addition, the technique provides consistent results when performing jICA analyses across different MEG conditions (Near/Far) and different levels of FA smoothing (6 vs. 10 mm), suggesting that the components identified by jICA are robust to small changes in MEG amplitude and FA extent. Application of this technique to schizophrenia has provided evidence of novel functional and structural associations, as well as identifying significant associations between occipital function, posterior white matter and cognitive function.
4.1 Using jICA to link MEG/DTI data
One of the greatest challenges facing the integration of neuroimaging datasets is the high-dimensionality of the datasets and the multiple comparisons needed to fully assess linked features. This challenge becomes clear when reviewing previous studies that have linked MEG and DTI datasets which, to date, have been performed by limiting the dimensionality of one or both modalities (Busse et al., 2005; Fernandez et al., 2011; Gaetz et al., 2010; Jung et al., 2012; Kamada et al., 2007; Roberts et al., 2009; Stufflebeam et al., 2008). This region of interest approach may allow one to address specific questions, but it does not allow for a full characterization of linked features. The challenge associated with univariate approaches is the number of multiple comparisons required to integrate complex datasets. For example, we performed a univariate analysis of the original FA and MEG data based on the maximal features identified in the occipital component (Fig. 4B). We obtained a significant association between the FA value and the peak amplitude of the MEG visual response across subjects, providing supporting evidence for the validity of the jICA results. However, the significance level of this univariate comparison most likely would not survive multiple comparison corrections with the FA map containing >900K voxels and the MEG data containing greater than 14K timepoints. In contrast, the jICA approach matches joint variance across multiple voxels/timepoints as well as across modalities, thus condensing thousands of data points into a small number of components with a single loading factor per component/participant. This model-free approach provides a means to link high dimensional datasets, such as those obtained using MEG and DTI without the same multiple comparison restrictions. As described in further detail below, this approach provides a novel view of linkages between MEG and DTI measures which shows both similarities and differences between participant groups.
Although the current jICA approach emphasizes either spatial or temporal factors, the MEG data also contain spatial information. We observed spatial consistency between the MEG component activation regions and the associated FA regions in 3/5 components. These results suggest that the jICA approach provides a simplified view of the complex data obtained with MEG and FA maps and may provide a method to better understand and parse the features that benefit or hinder patients or healthy controls in performing a specific task. The occipital MEG component (Fig. 4B) was mostly associated with differences in FA in superior parietal white matter regions which is comprised of a complex network of tracts which include projection tracts from subcortical structures, cortico-cortical tracts linking posterior brain regions, and association fiber tracts that link posterior and frontal brain regions. Furthermore, MEG LFP amplitude over bilateral central brain regions was associated with differences in FA in medial frontal white matter regions (e.g. Fig. 5B). Finally, a left temporal, mid-latency component (Fig. 5A) showed amplitude differences over temporal lobes in the MEG data and corresponded to variations in FA in left anterior temporal lobe. Two components showed mixed associations between MEG and FA (increased and decreased FA) with right temporal MEG amplitude associated with FA variation in the splenium of the corpus callosum (Fig. 3) and left temporal MEG component showing multiple regions of FA associations, including left parietal association tracts (FA1). This may represent the impact of white matter integrity on the functioning of the broader cortical network.
4.2 Application of jICA to Schizophrenia
The behavioral results provide evidence that all participants were able to perform the task well. Furthermore, the results are consistent with our previous study showing increased RT facilitation for the multisensory conditions in the SP group relative to HC (Stone et al., 2011). There was a small overlap in participants from the EEG study to the current MEG study (18/58 – 31% with an equal split between SP/HC); however, data collection occurred at a separate visit. Furthermore, the current study utilizes twice the sample size as our previous study. Therefore, the current results can be viewed as a partial replication of the previously reported behavioral results. While on the surface these results appear to conflict with those of Williams et al. (2010) where HC participants showed greater AV facilitation than SP, Williams et al. performed a cumulative probability function analysis, which emphasizes the fastest RTs, whereas we report mean RT, which emphasizes overall performance. This may imply that multisensory stimuli capture patients’ attention more readily than unisensory stimuli, thereby reducing lapses in attention that lead to long RT. In addition, de Gelder et al. (2002) reported no differences in multisensory RTs across groups but did not compare unisensory vs. multisensory RTs. Therefore, our results showing equivalent multisensory RTs by group are consistent with Gelder’s previous work; here we extend these findings to report group differences when comparing unisensory to multisensory RTs here and in Stone et al. (2011).
The jICA analysis identified ICs which demonstrated unique patterns of functional and spatial associations with respect to behavioral and cognitive assessments. For example, the right temporal component (Fig. 3) with small group differences (HC > SP; Table 3) revealed that increased FA/MEG amplitudes were associated with increased RT, implying an association with poorer performance. This pattern of increased amplitude associated with decreased performance is similar to previous results in aging suggesting that in some circumstances, increased brain activation may be related to increased effort, which is interpreted as compensation for poorer performance (Cabeza, 2002). Alternatively, a moderate level of temporal lobe activation may be optimal based on our study of auditory recognition in mild cognitive impairment (MCI) and Alzheimer’s disease (AD) where the two clinical groups either had increased activation of anterior temporal lobe (MCI patients) or decreased/undetected activation (AD patients) relative to HC (Aine et al., 2010). However, in our current study, amplitude was marginally greater for HC vs. SP; therefore, it is unclear how this IC influences RT. Further study is needed to better understand the role of these regions in influencing behavioral measures. On the other hand, a prominent group difference (HC > SP) in the occipital component (Fig. 4B) demonstrated an association between increased MEG amplitude and increased FA in bilateral parietal cortex with improved performance (improved processing speed, visual learning, and overall MATRICS score) which is consistent with the jICA group difference of HC > SP. This is also consistent with the broader schizophrenia literature generally showing reduced amplitude visual evoked responses (Lalor et al., 2012; Yeap et al., 2008) and reduced FA (Ellison-Wright and Bullmore, 2009; Hoptman, 2010; Konrad and Winterer, 2008) in SP. Furthermore, parietal white matter includes subregions of the superior longitudinal fasciculi [SLF I and SLF II (Makris et al., 2005)], both of which are associated with visuospatial attention (Thiebaut de Schotten et al., 2011). SLF II includes bidirectional tracts, allowing for bottom-up sensory input to frontal regions in addition to modifications of function from frontal feedback. These associations are consistent with deficits in attention and spatial processing in patients with schizophrenia reported across the age range (Irani et al., 2012).
In contrast, the late central IC (Fig. 5B) showed an association between increased MEG amplitude relative to increased FA in the right medial frontal white matter tracts, where loading factors were greater for SP than HC, in this case. Furthermore, increased MEG amplitude/FA corresponded to poorer verbal learning scores suggesting that this component isolated a link between function/structure that is maladaptive. There is accumulating evidence that increased FA in some regions may be related to increased psychotic symptoms [in particular hallucinations (Hubl et al., 2004; Volpe et al., 2008)], which suggests that increased connectivity may underlie some aspects of this psychopathological domain (Alba-Ferrara and de Erausquin, 2013). The restricted symptom severity of our sample of stable outpatient SP may have limited our ability to detect this association with FA. Also, increases in FA do not provide a direct correspondence with increases in white matter integrity or myelination (Hoptman, 2010). Because FA is a relative measure, change in FA may be associated with differences in the pattern of crossing fibers, changes in connectivity (e.g. hyperconnectivity) or changes in white matter integrity. Analysis of a larger dataset and subgroup analyses for the patient group (e.g. patients with high vs. low hallucination ratings) may provide additional insight into the maladaptive role of increased FA in SP.
Finally, the Near/Far manipulation tested differences in visual functioning in SP relative to HC based on studies that show deficits in dorsal stream processing relative to ventral stream processing (Butler and Javitt, 2005). The IC loading factors for the occipital component showed a significant group effect (HC > SP) as well as a group x location interaction with a larger difference in amplitude in the Near (peripheral visual) condition. Furthermore, the IC loading factors for Near conditions (peripheral visual field) were associated with cognitive outcome but the IC loading factors for the Far conditions were not. Therefore, the results here provide additional evidence of dorsal stream visual processing deficits in SP relative to HC. Despite these group differences in the peripheral (Near) condition for the occipital IC, the AV Near RT was equivalent for SP and HC. These results extend the previous results of Stone et al. (2011), which showed compensation of auditory deficits in SP with multisensory (AV) stimulation. In the present study, it appears that visual deficits may also be rectified under certain multisensory conditions.
4.3 Limitations
This novel analysis combining MEG and DTI using jICA has some recognized limitations. First, FA spatial maps provide an efficient way to compare white matter changes across groups; however, it can be challenging to interpret these changes in FA with regard to specific white matter tracts. Additional development of this approach to allow integration of fiber tracking results with MEG may provide additional insight into the links between brain function and structure. Second, combining the unisensory and multisensory MEG conditions in the jICA analysis limited the ability to statistically compare across these conditions. A possible alternative would be to separate out the unisensory from the multisensory MEG data prior to jICA. However, our general approach was to combine these data into one jICA analysis to limit the need to match ICs across analyses. That is, if the visual component only appeared in the AV analysis but not the V analysis, it would also hamper the ability to compare across conditions. Further development of the jICA approach is ongoing and additional multi-task and multimodal analyses (Sui, 2012) will likely allow us to better understand the implications of specific deficits identified with this approach. Alternatively, employing the parallel ICA (Liu et al., 2008) approach in which a separate IC loading factor is provided for each modality may provide a means to analyze data with vastly different dimensionality across different datasets (e.g. behavioral and neuroimaging or genetic data). Finally, the jICA analysis has been used previously to capitalize on individual variability to identify a biomarker that differentiates bipolar and schizophrenia patients with high sensitivity and specificity using jICA with multiple fMRI tasks (Calhoun et al., 2008); therefore in a heterogeneous disorder such as schizophrenia, additional subgroup analysis may provide a better understanding of the specificity of these deficits in different groups of patients.
4.4 Conclusions
This study presents a method for integrating MEG and FA data using the multivariate jICA analysis approach. This approach has identified novel associations between function and structure in a sample dataset of schizophrenia and healthy control participants. These results demonstrate that the joint associations are robust to small differences in both MEG datasets and FA maps. Furthermore, with no a priori constraints, this data driven approach identified joint components that show considerable spatial consistency between the region of activity identified in MEG and the location of FA differences. Finally, the association between occipital function, posterior parietal FA amplitude and cognitive performance provides further evidence that basic sensory functioning may be an important factor for understanding cognitive deficits in schizophrenia (Javitt, 2009). Future studies may help to determine if these different regions of activity, as measured by MEG and DTI, are associated with different subgroups of schizophrenia. Further multivariate extensions of this approach that move beyond individual regions of interest and timecourse peak amplitudes will further elucidate the structure/function relationship. The Human Connectome Project (Van Essen et al., 2012), designed to understand normal connectivity of the human brain through multimodal data acquisition (using structural MRI, DTI, fMRI, and MEG/EEG), underlines the necessity to develop multivariate methods to perform multimodal integration while capitalizing on individual subject variability. Further extending this approach to N-way (sMRI, fMRI, DTI, MEG) analyses (e.g. Sui et al. 2012) will facilitate an understanding of the structure/function relationship and the role that it plays in heterogeneous disorders such as schizophrenia.
Supplementary Material
Comparison of components with 6 mm smoothing of the FA maps. The jICA analysis was performed a second time with the FA maps with 6 mm isotropic smoothing compared to 10 mm isotropic smoothing reported in the paper. Four components are shown with good agreement between both the MEG and FA component maps. Compare A with Fig. 4A, B with Fig. 4B, C with Fig. 5A and D with Fig. 5B.
Acknowledgments
This project was supported by grants from the National Center for Research Resources (5P20RR021938), the National Institute of General Medical Sciences (8P20GM103472), and National Institute of Biomedical Imaging and Bioengineering (R01EB006841) from the National Institutes of Health. We thank the participants for their time to make this study possible. We thank Laura Urrea, Aaron Gonzales, David Stone, Megan Schendel and Frances Clark for their help with data collection.
Abbreviations
- MEG
magnetoencephalography
- EEG
electroencephalography
- DTI
diffusion tensor imaging
- FA
fractional anisotropy
- jICA
joint independent component analysis
- SP
schizophrenia patient
- HC
healthy control
- A
auditory
- V
visual
- AV
auditory/visual
- L
left
- R
right
- ISI
interstimulus interval
- RT
reaction time
- EOG
electrooculogram
- ECG
electrocardiogram
- HPI
head position indicator
- LFP
local field power
- IC
independent component
Footnotes
Publisher's Disclaimer: This is a PDF file of an unedited manuscript that has been accepted for publication. As a service to our customers we are providing this early version of the manuscript. The manuscript will undergo copyediting, typesetting, and review of the resulting proof before it is published in its final citable form. Please note that during the production process errors may be discovered which could affect the content, and all legal disclaimers that apply to the journal pertain.
Contributor Information
BA Coffman, Email: bcoffman@mrn.org.
RE Jung, Email: rjung@mrn.org.
JR Bustillo, Email: jbustillo@salud.unm.edu.
CJ Aine, Email: aine@unm.edu.
VD Calhoun, Email: vcalhoun@mrn.org.
References
- Aine CJ, Bryant JE, Knoefel JE, Adair JC, Hart B, Donahue CH, Montano R, Hayek R, Qualls C, Ranken D, Stephen JM. Different strategies for auditory word recognition in healthy versus normal aging. Neuroimage. 2010;49:3319–3330. doi: 10.1016/j.neuroimage.2009.11.068. [DOI] [PMC free article] [PubMed] [Google Scholar]
- Alba-Ferrara LM, de Erausquin GA. What does anisotropy measure? Insights from increased and decreased anisotropy in selective fiber tracts in schizophrenia. Front Integr Neurosci. 2013;7:9. doi: 10.3389/fnint.2013.00009. [DOI] [PMC free article] [PubMed] [Google Scholar]
- Bell AJ, Sejnowski TJ. An information-maximization approach to blind separation and blind deconvolution. Neural Comput. 1995;7:1129–1159. doi: 10.1162/neco.1995.7.6.1129. [DOI] [PubMed] [Google Scholar]
- Busse L, Roberts KC, Crist RE, Weissman DH, Woldorff MG. The spread of attention across modalities and space in a multisensory object. Proc Natl Acad Sci U S A. 2005;102:18751–18756. doi: 10.1073/pnas.0507704102. [DOI] [PMC free article] [PubMed] [Google Scholar]
- Butler PD, Javitt DC. Early-stage visual processing deficits in schizophrenia. Curr Opin Psychiatry. 2005;18:151–157. doi: 10.1097/00001504-200503000-00008. [DOI] [PMC free article] [PubMed] [Google Scholar]
- Butler PD, Silverstein SM, Dakin SC. Visual perception and its impairment in schizophrenia. Biol Psychiatry. 2008;64:40–47. doi: 10.1016/j.biopsych.2008.03.023. [DOI] [PMC free article] [PubMed] [Google Scholar]
- Cabeza R. Hemispheric asymmetry reduction in older adults: the HAROLD model. Psychol Aging. 2002;17:85–100. doi: 10.1037//0882-7974.17.1.85. [DOI] [PubMed] [Google Scholar]
- Calhoun VD, Adali T, Pearlson GD, Kiehl KA. Neuronal chronometry of target detection: fusion of hemodynamic and event-related potential data. Neuroimage. 2006c;30:544–553. doi: 10.1016/j.neuroimage.2005.08.060. [DOI] [PubMed] [Google Scholar]
- Calhoun VD, Maciejewski PK, Pearlson GD, Kiehl KA. Temporal lobe and “default” hemodynamic brain modes discriminate between schizophrenia and bipolar disorder. Hum Brain Mapp. 2008;29:1265–1275. doi: 10.1002/hbm.20463. [DOI] [PMC free article] [PubMed] [Google Scholar]
- Calhoun VD, Adali T, Kiehl KA, Astur R, Pekar JJ, Pearlson GD. A method for multitask fMRI data fusion applied to schizophrenia. Hum Brain Mapp. 2006a;27:598–610. doi: 10.1002/hbm.20204. [DOI] [PMC free article] [PubMed] [Google Scholar]
- Calhoun VD, Adali T, Giuliani NR, Pekar JJ, Kiehl KA, Pearlson GD. Method for multimodal analysis of independent source differences in schizophrenia: combining gray matter structural and auditory oddball functional data. Hum Brain Mapp. 2006b;27:47–62. doi: 10.1002/hbm.20166. [DOI] [PMC free article] [PubMed] [Google Scholar]
- Caprihan A, Abbott C, Yamamoto J, Pearlson G, Perrone-Bizzozero N, Sui J, Calhoun VD. Source-based morphometry analysis of group differences in fractional anisotropy in schizophrenia. Brain Connect. 2011;1:133–145. doi: 10.1089/brain.2011.0015. [DOI] [PMC free article] [PubMed] [Google Scholar]
- Chalfie M, Sulston JE, White JG, Southgate E, Thomson JN, Brenner S. The neural circuit for touch sensitivity in Caenorhabditis elegans. J Neurosci. 1985;5:956–964. doi: 10.1523/JNEUROSCI.05-04-00956.1985. [DOI] [PMC free article] [PubMed] [Google Scholar]
- de Gelder B, Vroomen J, Annen L, Masthof E, Hodiamont P. Audio-visual integration in schizophrenia. Schizophrenia Research. 2002;59:211–218. doi: 10.1016/s0920-9964(01)00344-9. [DOI] [PubMed] [Google Scholar]
- Ellison-Wright I, Bullmore E. Meta-analysis of diffusion tensor imaging studies in schizophrenia. Schizophr Res. 2009;108:3–10. doi: 10.1016/j.schres.2008.11.021. [DOI] [PubMed] [Google Scholar]
- Fernandez A, Rios-Lago M, Abasolo D, Hornero R, Alvarez-Linera J, Paul N, Maestu F, Ortiz T. The correlation between white-matter microstructure and the complexity of spontaneous brain activity: a difussion tensor imaging-MEG study. Neuroimage. 2011;57:1300–1307. doi: 10.1016/j.neuroimage.2011.05.079. [DOI] [PubMed] [Google Scholar]
- Gaetz W, Scantlebury N, Widjaja E, Rutka J, Bouffet E, Rockel C, Dockstader C, Mabbott D. Mapping of the cortical spinal tracts using magnetoencephalography and diffusion tensor tractography in pediatric brain tumor patients. Childs Nerv Syst. 2010;26:1639–1645. doi: 10.1007/s00381-010-1189-8. [DOI] [PubMed] [Google Scholar]
- Gardner DM, Murphy AL, O’Donnell H, Centorrino F, Baldessarini RJ. International consensus study of antipsychotic dosing. Am J Psychiatry. 2010;167:686–693. doi: 10.1176/appi.ajp.2009.09060802. [DOI] [PubMed] [Google Scholar]
- Gray JM, Hill JJ, Bargmann CI. A circuit for navigation in Caenorhabditis elegans. Proc Natl Acad Sci U S A. 2005;102:3184–3191. doi: 10.1073/pnas.0409009101. [DOI] [PMC free article] [PubMed] [Google Scholar]
- Green MF, Kern RS, Heaton RK. Longitudinal studies of cognition and functional outcome in schizophrenia: implications for MATRICS. Schizophr Res. 2004;72:41–51. doi: 10.1016/j.schres.2004.09.009. [DOI] [PubMed] [Google Scholar]
- Gur RE, Gur RC. Functional magnetic resonance imaging in schizophrenia. Dialogues Clin Neurosci. 2010;12:333–343. doi: 10.31887/DCNS.2010.12.3/rgur. [DOI] [PMC free article] [PubMed] [Google Scholar]
- Hamalainen M, Hari R, Ilmoniemi RJ, Knuutila J, Lounasmaa OV. Magnetoencephalography - Theory, instrumentation, and applications to noninvasive studies of the working human brain. Rev Mod Phys. 1993;65:413–497. [Google Scholar]
- Hoptman MJ. Clinical correlates of MRI white matter abnormalities in schizophrenia. Prilozi. 2010;31:115–133. [PubMed] [Google Scholar]
- Hubl D, Koenig T, Strik W, Federspiel A, Kreis R, Boesch C, Maier SE, Schroth G, Lovblad K, Dierks T. Pathways that make voices: white matter changes in auditory hallucinations. Arch Gen Psychiatry. 2004;61:658–668. doi: 10.1001/archpsyc.61.7.658. [DOI] [PubMed] [Google Scholar]
- Irani F, Brensinger CM, Richard J, Calkins ME, Moberg PJ, Bilker W, Gur RE, Gur RC. Computerized neurocognitive test performance in schizophrenia: a lifespan analysis. Am J Geriatr Psychiatry. 2012;20:41–52. doi: 10.1097/JGP.0b013e3182051a7d. [DOI] [PMC free article] [PubMed] [Google Scholar]
- Javitt DC. When doors of perception close: bottom-up models of disrupted cognition in schizophrenia. Annu Rev Clin Psychol. 2009;5:249–275. doi: 10.1146/annurev.clinpsy.032408.153502. [DOI] [PMC free article] [PubMed] [Google Scholar]
- Jones DK, Symms MR, Cercignani M, Howard RJ. The effect of filter size on VBM analyses of DT-MRI data. Neuroimage. 2005;26:546–554. doi: 10.1016/j.neuroimage.2005.02.013. [DOI] [PubMed] [Google Scholar]
- Jung P, Klein JC, Wibral M, Hoechstetter K, Bliem B, Lu MK, Wahl M, Ziemann U. Spatiotemporal dynamics of bimanual integration in human somatosensory cortex and their relevance to bimanual object manipulation. J Neurosci. 2012;32:5667–5677. doi: 10.1523/JNEUROSCI.5957-11.2012. [DOI] [PMC free article] [PubMed] [Google Scholar]
- Kamada K, Todo T, Masutani Y, Aoki S, Ino K, Morita A, Saito N. Visualization of the frontotemporal language fibers by tractography combined with functional magnetic resonance imaging and magnetoencephalography. J Neurosurg. 2007;106:90–98. doi: 10.3171/jns.2007.106.1.90. [DOI] [PubMed] [Google Scholar]
- Kay SR, Fiszbein A, Opler LA. The positive and negative syndrome scale (PANSS) for schizophrenia. Schizophr Bull. 1987;13:261–276. doi: 10.1093/schbul/13.2.261. [DOI] [PubMed] [Google Scholar]
- Kern RS, Nuechterlein KH, Green MF, Baade LE, Fenton WS, Gold JM, Keefe RS, Mesholam-Gately R, Mintz J, Seidman LJ, Stover E, Marder SR. The MATRICS Consensus Cognitive Battery, part 2: co-norming and standardization. Am J Psychiatry. 2008;165:214–220. doi: 10.1176/appi.ajp.2007.07010043. [DOI] [PubMed] [Google Scholar]
- Kim D, Wylie G, Pasternak R, Butler PD, Javitt DC. Magnocellular contributions to impaired motion processing in schizophrenia. Schizophrenia Research. 2006;82:1–8. doi: 10.1016/j.schres.2005.10.008. [DOI] [PMC free article] [PubMed] [Google Scholar]
- Konrad A, Winterer G. Disturbed structural connectivity in schizophrenia primary factor in pathology or epiphenomenon? Schizophr Bull. 2008;34:72–92. doi: 10.1093/schbul/sbm034. [DOI] [PMC free article] [PubMed] [Google Scholar]
- Lalor EC, De Sanctis P, Krakowski MI, Foxe JJ. Visual sensory processing deficits in schizophrenia: is there anything to the magnocellular account? Schizophr Res. 2012;139:246–252. doi: 10.1016/j.schres.2012.05.022. [DOI] [PMC free article] [PubMed] [Google Scholar]
- Leitman DI, Foxe JJ, Butler PD, Saperstein A, Revheim N, Javitt DC. Sensory contributions to impaired prosodic processing in schizophrenia. Biol Psychiatry. 2005;58:56–61. doi: 10.1016/j.biopsych.2005.02.034. [DOI] [PubMed] [Google Scholar]
- Liu J, Demirci O, Calhoun VD. A Parallel Independent Component Analysis Approach to Investigate Genomic Influence on Brain Function. IEEE Signal Process Lett. 2008;15:413–416. doi: 10.1109/LSP.2008.922513. [DOI] [PMC free article] [PubMed] [Google Scholar]
- Liu J, Kiehl KA, Pearlson G, Perrone-Bizzozero NI, Eichele T, Calhoun VD. Genetic determinants of target and novelty-related event-related potentials in the auditory oddball response. Neuroimage. 2009;46:809–816. doi: 10.1016/j.neuroimage.2009.02.045. [DOI] [PMC free article] [PubMed] [Google Scholar]
- Livingstone M, Hubel D. Psychophysical evidence for separate channels for perception of form, color, movement, and depth. J Neurosci. 1987;7:3416–3468. doi: 10.1523/JNEUROSCI.07-11-03416.1987. [DOI] [PMC free article] [PubMed] [Google Scholar]
- Lovelace CT, Stein BE, Wallace MT. An irrelevant light enhances auditory detection in humans: a psychophysical analysis of multisensory integration in stimulus detection. Brain Res Cogn Brain Res. 2003;17:447–453. doi: 10.1016/s0926-6410(03)00160-5. [DOI] [PubMed] [Google Scholar]
- Makris N, Kennedy DN, McInerney S, Sorensen AG, Wang R, Caviness VS, Jr, Pandya DN. Segmentation of subcomponents within the superior longitudinal fascicle in humans: a quantitative, in vivo, DT-MRI study. Cereb Cortex. 2005;15:854–869. doi: 10.1093/cercor/bhh186. [DOI] [PubMed] [Google Scholar]
- Mausbach BT, Harvey PD, Goldman SR, Jeste DV, Patterson TL. Development of a brief scale of everyday functioning in persons with serious mental illness. Schizophr Bull. 2007;33:1364–1372. doi: 10.1093/schbul/sbm014. [DOI] [PMC free article] [PubMed] [Google Scholar]
- Naatanen R, Kahkonen S. Central auditory dysfunction in schizophrenia as revealed by the mismatch negativity (MMN) and its magnetic equivalent MMNm: a review. Int J Neuropsychopharmacol. 2009;12:125–135. doi: 10.1017/S1461145708009322. [DOI] [PubMed] [Google Scholar]
- Nuechterlein KH, et al. The MATRICS Consensus Cognitive Battery, part 1: test selection, reliability, and validity. Am J Psychiatry. 2008;165:203–213. doi: 10.1176/appi.ajp.2007.07010042. [DOI] [PubMed] [Google Scholar]
- Ragland JD, Cohen NJ, Cools R, Frank MJ, Hannula DE, Ranganath C. CNTRICS imaging biomarkers final task selection: Long-term memory and reinforcement learning. Schizophr Bull. 2012;38:62–72. doi: 10.1093/schbul/sbr168. [DOI] [PMC free article] [PubMed] [Google Scholar]
- Rissling AJ, Makeig S, Braff DL, Light GA. Neurophysiologic markers of abnormal brain activity in schizophrenia. Curr Psychiatry Rep. 2010;12:572–578. doi: 10.1007/s11920-010-0149-z. [DOI] [PMC free article] [PubMed] [Google Scholar]
- Roberts TP, Khan SY, Blaskey L, Dell J, Levy SE, Zarnow DM, Edgar JC. Developmental correlation of diffusion anisotropy with auditory-evoked response. Neuroreport. 2009;20:1586–1591. doi: 10.1097/WNR.0b013e3283306854. [DOI] [PubMed] [Google Scholar]
- Rovamo J, Virsu V. An estimation and application of the human cortical magnification factor. Exp Brain Res. 1979;37:495–510. doi: 10.1007/BF00236819. [DOI] [PubMed] [Google Scholar]
- Rykhlevskaia E, Gratton G, Fabiani M. Combining structural and functional neuroimaging data for studying brain connectivity: a review. Psychophysiology. 2008;45:173–187. doi: 10.1111/j.1469-8986.2007.00621.x. [DOI] [PubMed] [Google Scholar]
- Schechter I, Butler PD, Silipo G, Zemon V, Javitt DC. Magnocellular and parvocellular contributions to backward masking dysfunction in schizophrenia. Schizophr Res. 2003;64:91–101. doi: 10.1016/s0920-9964(03)00008-2. [DOI] [PubMed] [Google Scholar]
- Schmitt A, Hasan A, Gruber O, Falkai P. Schizophrenia as a disorder of disconnectivity. Eur Arch Psychiatry Clin Neurosci. 2011;261(Suppl 2):S150–154. doi: 10.1007/s00406-011-0242-2. [DOI] [PMC free article] [PubMed] [Google Scholar]
- Segall JM, Turner JA, van Erp TG, White T, Bockholt HJ, Gollub RL, Ho BC, Magnotta V, Jung RE, McCarley RW, Schulz SC, Lauriello J, Clark VP, Voyvodic JT, Diaz MT, Calhoun VD. Voxel-based morphometric multisite collaborative study on schizophrenia. Schizophr Bull. 2009;35:82–95. doi: 10.1093/schbul/sbn150. [DOI] [PMC free article] [PubMed] [Google Scholar]
- Silverstein SM, Keane BP. Perceptual organization impairment in schizophrenia and associated brain mechanisms: review of research from 2005 to 2010. Schizophr Bull. 2011;37:690–699. doi: 10.1093/schbul/sbr052. [DOI] [PMC free article] [PubMed] [Google Scholar]
- Sporns O, Tononi G, Kotter R. The human connectome: A structural description of the human brain. PLoS Comput Biol. 2005;1:e42. doi: 10.1371/journal.pcbi.0010042. [DOI] [PMC free article] [PubMed] [Google Scholar]
- Stephen JM, Aine CJ, Christner RF, Ranken D, Huang M, Best E. Central versus peripheral visual field stimulation results in timing differences in dorsal stream sources as measured with MEG. Vision Res. 2002;42:3059–3074. doi: 10.1016/s0042-6989(02)00415-7. [DOI] [PubMed] [Google Scholar]
- Stone DB, Urrea LJ, Aine CJ, Bustillo JR, Clark VP, Stephen JM. Unisensory processing and multisensory integration in schizophrenia: a high-density electrical mapping study. Neuropsychologia. 2011;49:3178–3187. doi: 10.1016/j.neuropsychologia.2011.07.017. [DOI] [PMC free article] [PubMed] [Google Scholar]
- Stufflebeam SM, Witzel T, Mikulski S, Hamalainen MS, Temereanca S, Barton JJ, Tuch DS, Manoach DS. A non-invasive method to relate the timing of neural activity to white matter microstructural integrity. Neuroimage. 2008;42:710–716. doi: 10.1016/j.neuroimage.2008.04.264. [DOI] [PMC free article] [PubMed] [Google Scholar]
- Sui J. A novel N-way brain imaging data fusion model and its application to schizophrenia. Human Brain Mapping 2012; Beijing, China. 2012. [Google Scholar]
- Sui J, Pearlson G, Caprihan A, Adali T, Kiehl KA, Liu J, Yamamoto J, Calhoun VD. Discriminating schizophrenia and bipolar disorder by fusing fMRI and DTI in a multimodal CCA+ joint ICA model. Neuroimage. 2011;57:839–855. doi: 10.1016/j.neuroimage.2011.05.055. [DOI] [PMC free article] [PubMed] [Google Scholar]
- Taulu S, Kajola M. Presentation of electromagnetic multichannel data: The signal space separation method. Journal of Applied Physics. 2005:97. [Google Scholar]
- Thiebaut de Schotten M, Dell’Acqua F, Forkel SJ, Simmons A, Vergani F, Murphy DG, Catani M. A lateralized brain network for visuospatial attention. Nat Neurosci. 2011;14:1245–1246. doi: 10.1038/nn.2905. [DOI] [PubMed] [Google Scholar]
- Thoma RJ, Hanlon FM, Moses SN, Edgar JC, Huang M, Weisend MP, Irwin J, Sherwood A, Paulson K, Bustillo J, Adler LE, Miller GA, Canive JM. Lateralization of auditory sensory gating and neuropsychological dysfunction in schizophrenia. Am J Psychiatry. 2003;160:1595–1605. doi: 10.1176/appi.ajp.160.9.1595. [DOI] [PubMed] [Google Scholar]
- Ungerleider L, Desimone R. Projections to the superior temporal sulcus from the central and peripheral field representations of V1 and V2. J Comp Neurol. 1986;248:147–163. doi: 10.1002/cne.902480202. [DOI] [PubMed] [Google Scholar]
- Uusitalo MA, Ilmoniemi RJ. Signal-space projection method for separating MEG or EEG into components. Med Biol Eng Comput. 1997;35:135–140. doi: 10.1007/BF02534144. [DOI] [PubMed] [Google Scholar]
- Van Essen DC, et al. The Human Connectome Project: A data acquisition perspective. Neuroimage. 2012 doi: 10.1016/j.neuroimage.2012.02.018. [DOI] [PMC free article] [PubMed] [Google Scholar]
- Volpe U, Federspiel A, Mucci A, Dierks T, Frank A, Wahlund LO, Galderisi S, Maj M. Cerebral connectivity and psychotic personality traits. A diffusion tensor imaging study. Eur Arch Psychiatry Clin Neurosci. 2008;258:292–299. doi: 10.1007/s00406-007-0796-1. [DOI] [PubMed] [Google Scholar]
- Waxman SG. Determinants of conduction velocity in myelinated nerve fibers. Muscle Nerve. 1980;3:141–150. doi: 10.1002/mus.880030207. [DOI] [PubMed] [Google Scholar]
- Wechsler D. Wechsler Test of Adult Reading. San Antonio, TX: Psychological Corporation; 2001. [Google Scholar]
- Williams LE, Light GA, Braff DL, Ramachandran VS. Reduced multisensory integration in patients with schizophrenia on a target detection task. Neuropsychologia. 2010;48:3128–3136. doi: 10.1016/j.neuropsychologia.2010.06.028. [DOI] [PMC free article] [PubMed] [Google Scholar]
- Yeap S, Kelly SP, Sehatpour P, Magno E, Garavan H, Thakore JH, Foxe JJ. Visual sensory processing deficits in Schizophrenia and their relationship to disease state. Eur Arch Psychiatry Clin Neurosci. 2008;258:305–316. doi: 10.1007/s00406-008-0802-2. [DOI] [PubMed] [Google Scholar]
Associated Data
This section collects any data citations, data availability statements, or supplementary materials included in this article.
Supplementary Materials
Comparison of components with 6 mm smoothing of the FA maps. The jICA analysis was performed a second time with the FA maps with 6 mm isotropic smoothing compared to 10 mm isotropic smoothing reported in the paper. Four components are shown with good agreement between both the MEG and FA component maps. Compare A with Fig. 4A, B with Fig. 4B, C with Fig. 5A and D with Fig. 5B.