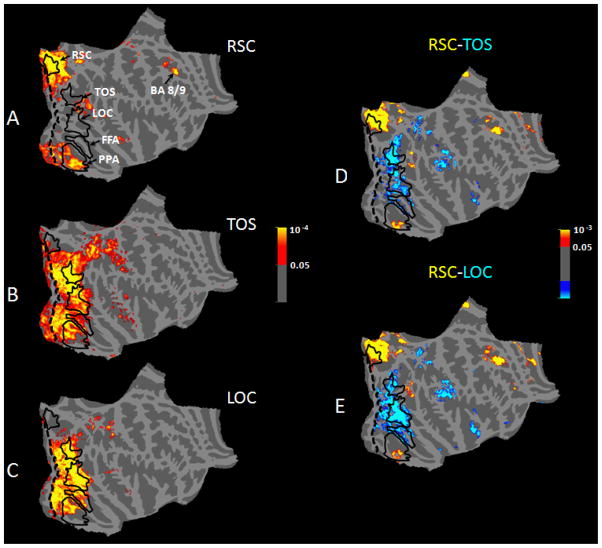
Figure 5.
Functional connectivity analysis in the right hemisphere with seed regions in RSC (A), TOS (B), and LOC (C), and difference maps in the connectivity of areas RSC vs. TOS (D) and RSC vs. LOC (E). In all panels, the color code represents the significance of the resting state temporal correlation between the seed region and the connected area. In panels D & E, red/yellow indicates a stronger positive correlation with RSC, and blue/cyan indicates stronger positive correlation with either TOS (D) or LOC (E). Borders of all areas (except for V1) were defined based on separate independent scan sessions (solid black lines). The V1 border (dashed black line) was based on cytoartitectonics. Data in the left hemisphere were similar (Figure S3).

