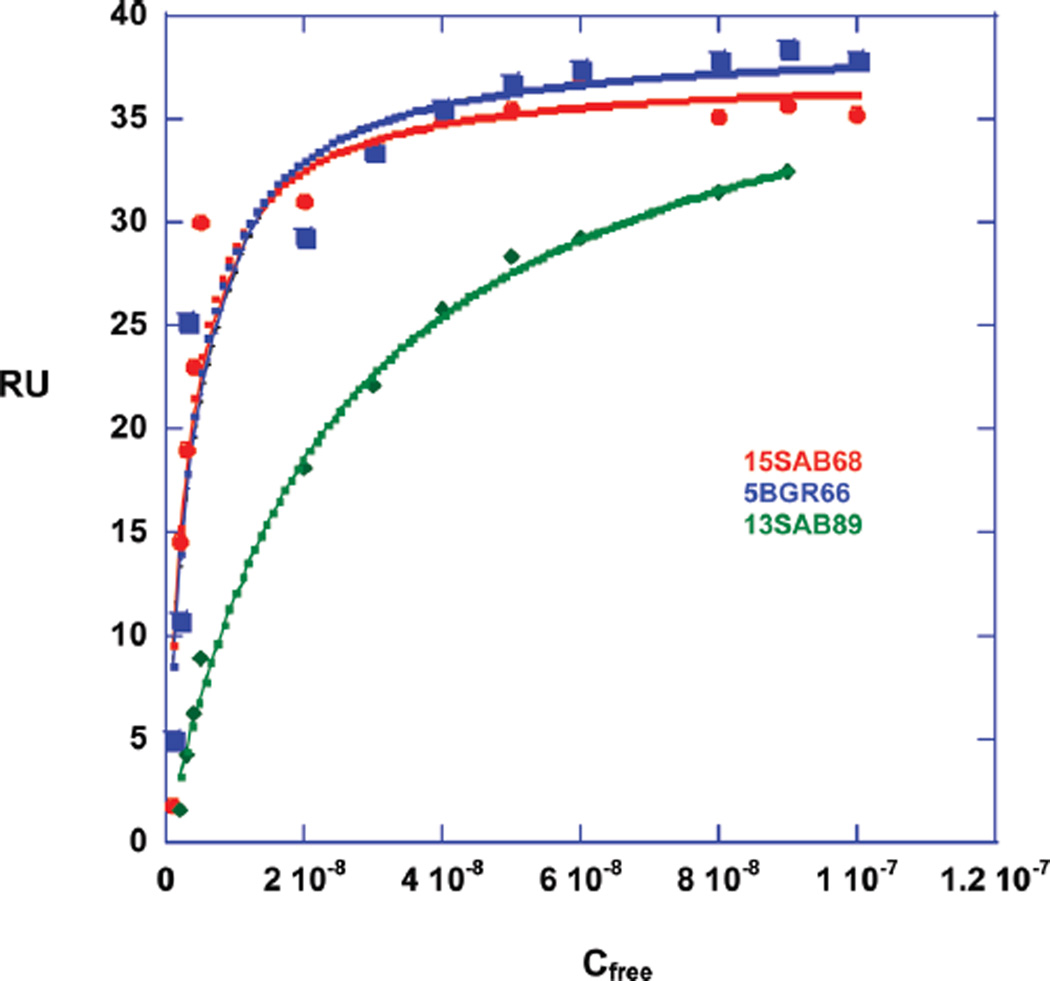
Figure 5.
RU values vs free compound concentration. The RUs from 1 to 10 nM were calculated from kinetic fitting with the mass transfer model. The RUs from 10 to 100 nM were measured from steady-state fitting. The data were fitted in a one-site model for 15SAB68 (red) and 5BGR66 (blue) and a two-site model for 13SAB89 (green) with one strong and one nonspecific binding. The nonspecific binding is approximately 100 times weaker than the primary binding.

