

Abstract
Myoblast fusion into functionally distinct myotubes, and their subsequent integration with the nervous system, is a poorly understood phenomenon with important applications in basic science research, skeletal muscle tissue engineering, and cell-based biosensor development. We have previously demonstrated the ability of microelectrode arrays (MEAs) to record the extracellular action potentials of myotubes, and we have shown that this information reveals the presence of multiple, electrophysiologically independent myotubes even in unstructured cultures where there is extensive physical contact between cells (Langhammer et al., Biotechnol Prog 27:891–895, 2011). In this paper, we explore the ability of microscale topographical trenches to guide the myoblast alignment and fusion processes and use our findings to create a substrate-embedded MEA containing topographical trenches that are able to direct myotube contractility to specific locations. By combining substrate-embedded MEA technology with topographical patterns, we have developed a lab-on-a-chip test bed for the non-invasive examination of myotubes.
Keywords: Microelectrode array, Myoblast alignment, Myoblast fusion, Topographical trenches, Substrate embedding
INTRODUCTION
Muscle tissue generates controllable, graded, and sustainable forces through the highly regulated activation of distinct motor units, each consisting of a unique set of muscle fibers.10 The ability of skeletal myotubes to remain electrophysiologically distinct from their neighbors, therefore, is one of the traits required to fulfill this role. This stands in stark contrast to other electrogenic cell types, such as neurons, where CNS function depends on the formation of multicellular networks, or cardiomyocytes, where cardiac output depends on the synchronicity of their contractions. Each myotube’s ability to remain independent from its neighbors is made more puzzling by the developmental origin of myotubes, which are formed by the rapid fusion of myoblasts from a seemingly homogenous pool of precursor cells. Not only does this fusion process result in highly aligned, tightly packed, yet independent myotubes within a single muscle, but also in the formation of distinct muscles with specific sites of attachment relative to the joints at which they act. Despite the clear importance of regulating the myoblast fusion process in the development of the musculoskeletal system, little is known about the process itself.23,25 The study of myotube independence has applications outside of basic science as well. Muscle tissue engineering is a field with multiple applications in human health and regenerative medicine. The study of how to generate and manipulate myotube formation and how to integrate these myotubes with the nervous system are important steps in muscle tissue engineering for clinical applications.12,24
By integrating tissue engineering techniques with novel dual-modality (optical and bioelectrical) sensing technologies, we are developing a lab-on-a-chip test bed for non-invasive examinations of myotube fusion. Previous work from our laboratory demonstrated that we can use microelectrode array technology to record electrical activity from myotubes and to differentiate signals from myotubes and neurons when they are co-cultured.15 Additionally, because an important aspect of muscle tissue is its highly aligned structure, we investigate the incorporation of topographical guidance cues into our sensing array as a means of exercising control over culture morphology. Most tissue engineering tools take advantage of topographical or chemical means of inducing ordered culture architecture similar to that observed in vivo. However, while myotube alignment is clearly important to muscle tissue’s ability to efficiently produce large forces, the generation of controlled, sustainable, repeatable contractions requires the selective and coordinated activation of independently operable motor units.10,20 Although a great deal of effort has been placed on cataloging our ability to encourage myotube differentiation, development, and alignment, less effort has been directed towards developing ways to exert control over myotube independence.17 Unraveling the mechanisms by which these independent motor units are created and maintained from a nearly homogenous pool of progenitor cells is therefore an important step in muscle tissue engineering.23 Additionally, control of myotube formation has implications for creating microscale devices or sensors based on biological elements.13 Preserving independent control over myotubes, rather than allowing them to fuse randomly, will improve such devices by increasing the number of independent cellular signal transducers (for biosensor applications) or actuators (in biorobotics applications).
This paper introduces and validates a new technology platform which we hope to use in the future to study myoblast fusion. There is clearly a deficit of knowledge regarding this topic, but it is only because there are not many good ways of exploring it. The importance of our current work is that we describe a new tool that can now be used by other researchers, as well as ourselves, to perform more detailed experiments probing myoblast fusion biology. It is our hope that this combination of technologies, topographical guidance cues and microelectrode array recording, will act as a seed platform with the potential to be adapted for use in a wide variety of applications following relatively simple redesign. For example, electrode contact spacing and shape can be modified to provide basic science researchers a tool for monitoring myoblast fusion during development. For cell-based biosensor applications, topographical guidance cues can be used to direct myotubes to electrode sites in order to maximize the number of independent signal producing units available to a detection array. Finally, topographical modifications can be used to produce microenvironments capable of sustaining multiple cell types in structured co-cultures. Examples of these microenvironments include the co-culture of myotubes with motor neurons for the examination of simple neural circuits, such as the spinal reflex arc, the development of a functional neuromuscular tissue phantom for high-throughput screening and biodetection, or the development of a regenerative neural interface targeted to the peripheral nervous system.
MATERIALS AND METHODS
Myotube Isolation and Culture
Myoblasts were isolated and cultured as previously described.17 Briefly, pregnant Sprague-Dawley rats were sacrificed by CO2 inhalation at gestational day 21 and pups were removed by Cesarean section. Hind limb muscles were removed, and tissue was finely minced and digested (20 min at 37 °C) in PBS containing 1.5 U/mL collagenase (type D, Roche, Mannheim, Germany) and 2.5 U/mL dispase (type II, Roche, Mannheim, Germany). Single cells were separated from debris, pelleted by centrifugation, and resuspended in growth medium consisting of Ham’s F-10 medium plus 20% fetal bovine serum, 1% penicillin/streptomycin (all from Invitrogen, Carlsbad, CA) and 2.5 ng/mL human b-FGF (Promega Corporation, Madison, WI). Cells were then plated into 75 cm2 flasks and incubated for 24 h. Adherent cells were resuspended and plated onto multielectrode arrays (MEAs; also known as microelectrode arrays) in differentiation medium consisting of neurobasal medium including 2% B-27 supplement, 1% penicillin/streptomycin, and 1% GlutaMAX (all from Invitrogen, Carlsbad, CA) at a surface density of 300,000 cells/cm2. Prior to seeding, surfaces were coated overnight with 40 μg/mL laminin (Sigma Aldrich, St. Louis, MO).
Spinal Cord Explant Culture
Spinal cord explants were prepared using procedures based on Gahwiler et al.9 Briefly, pregnant Sprague-Dawley rats were sacrificed by CO2 inhalation at gestational day 15, and pups were removed by Cesarean section. Spinal cord was removed posteriorly and transferred to a PDMS-lined petri dish, bisected longitudinally, and finely minced transversely into sections 200–300 μm thick. Explants were then plated onto MEAs, all of which had been adsorbed overnight with 10 μL of 40 μg/mL laminin in medium, at which point they were precisely positioned in the central explant zone of each recording field. After 5 min, allowing for initial adhesion, enough medium was added to just cover the explant, and it was placed in an incubator at 5% CO2 and 37 °C. Medium was replaced every 2 days.
Quantification of Myoblast and Myotube Alignment
To assess the affect of topographical features on the alignment of myotubes, myoblasts were seeded onto polydimethylsiloxane (PDMS) substrates bearing either 30 × 30 μm, 50 × 50 μm, 100 × 100 μm, 150 × 150 μm, 200 × 200 μm, or 400 × 400 μm trenches (trench width μm × separation μm). PDMS monomer (Dow Corning, Sylgard 184) was mixed 10:1 with curing agent and poured over a silicon wafer, which had been lithographically patterned with a 40 μm thick layer of SU-8, into which the negative pattern of our groove geometries had been developed. After degassing under vacuum for 30 min, the PDMS was cured overnight at 37 °C. The PDMS was then peeled from the surface of the silicon SU-8 master, resulting in a positive pattern of grooves of 40 μm in depth. PDMS substrates with a smooth surface were used as an unaltered control, and each surface was prepared in triplicate. The PDMS surface was adsorbed with either laminin, polyethyleneimine (PEI) or poly-D-lysine (PDL) prior to myoblast seeding. Two randomly selected fields, showing 0.55 mm2, from each myoblast-seeded substrate were imaged using a phase contrast microscope at 12 h post seeding and every 24 h after that until day in vitro (DIV) 8. Myoblast alignment in these images was assessed using a modification of the image intensity gradient algorithm.2,11 Briefly, each image was broken into square tiles. The intensity gradient of each pixel in this square interrogation window in both the X direction (δx) and Y direction (δy) is calculated and then averaged across the field. An angle, θ, is then calculated based on the arctan of δy/δx, which represents the average orientation of optical density within that field. This series of operations is repeated for every square tile, and the distribution of resultant θ’s provides a measure of bulk culture alignment. Squares located on trench edges were excluded to prevent the introduction of substrate-based alignment bias.
Creation of a Prototype for a Substrate-Embedded MEA
A prototype device was designed incorporating topographical modifications that direct myotube formation, as determined by our previous experiments. In addition, we also wanted to optimize spinal cord explant outgrowth so that we could create a device that could record from co-cultures of myotubes and spinal cord explants to understand how communication between these two cell types develop. We manipulated the local microenvironment to optimize the system for this purpose.
Specifically, two regions of trenches are used to direct myotube formation to specific electrode sites and are connected to a central field for a spinal cord explant, which is spatially separated from the grooves to allow neuron/myotube contact only through axonal outgrowth (Fig. 1). The two wing regions, oriented horizontally and vertically, consist of four grooves 100 μm in width, 40 μm in depth with a single 100 μm diameter electrode contact at the bottom. The central field contains five recording electrodes to record from multiple points beneath the explant body and axonal outgrowth. A large pad is included as an internal reference electrode (not shown). The electrodes are patterned to interface with a Multichannel Systems MEA recording head-stage through external contact pads located around the periphery of the chip (Fig. 1b).
FIGURE 1.

Myo-MEA prototype. (a) Microscopic view of prototype recording field showing one of the four recording fields. (b) Image of finished prototype, including PDMS culture chamber. This figure has been reproduced from Langhammer et al.16
The electrode contact and lead pattern is produced using a lift-off technique21 as shown in Fig. 2. A PDMS ring is affixed to the surface creating a culture chamber around four recording fields, enabling multiple simultaneous experiments (Fig. 1b). It should be noted that the production process used to create the topographical trenches on the myo-MEA is different from the process that we used to create the topographical trenches in PDMS in our initial experiments. The soft-lithography technique was used in the initial experiments to determine a rough approximation of the optimal feature size as it is a quick and straight forward method. However, soft-lithography could not have been used to create the features on the myo-MEA because the production process is incompatible with building topographical features on top of an existing electrode pattern. Therefore, the production process was changed in order to create trenches on the myo-MEAs. As a result, the final substrate material of the growing surface of the myo-MEA differed from the previous experiments in which we were determining the effect of, and the ideal dimensions of, topographical trenches. The effective difference between the two substrates is likely small, however, because they are both adsorbed with laminin prior to cell seeding. Further, any differences resulting are likely to be dwarfed by the differences resulting from the geometries of the grooves. As such, we expect that the myotube behavior on the myo-MEAs will be analogous to what we witnessed in our initial experiments using trenches of the same diameter.
FIGURE 2.

Schematic of microfabrication process. (a)–(d) A layer of photoresist (pink) bearing the electrode pattern (black masking area) is produced on glass (gray-blue) using standard optical lithography. (e) and (f) The photoresist is undercut using a short hydrofluoric acid (HF) etch (dark gray) followed by sputtering of a 200/700 nm thick chromium/gold (Cr/Au; dark yellow) conducting electrode layer. (g) The photoresist is dissolved in acetone, removing the conducting layer everywhere (gray-blue) except the electrode pattern (dark yellow). (h) A layer of SU-8 photoresist (green) is then spin-coated onto the electrode-patterned surface and (i) exposed and developed using a topographical feature mask (black) to generate topographical trenches with the appropriate diameter determined by our prior experiments, and (j) and (k) central confinement regions, also selectively exposing the electrode contact pads located at the bottom of both while leaving the electrode leads electrically insulated from the culture environment.
The fabrication process generates devices capable of recording myotube and explant extracellular action potentials (EAPs) and withstands repeated cycles through the sterilization-usage-regeneration processes involved in cell culture. In examinations of the electrode noise-floors (data not shown), it was determined that the gold leads establish electrical continuity between the recording contact sites and the external contacts which interface with the MCS head stage. Electrode noise was low (~3 μV) for functional electrodes, while it was elevated to the maximum noise detectible using the MEA recording array (~40 μV) where electrode continuity with the culture fluid was lost (either by scratching the lead under the SU-8 insulating layer or through incomplete development of trenches). The SU-8 layer has good adhesion properties, without cracking or delamination flaws. Additionally, the SU-8 layer is optically clear, facilitating the observation of culture conditions in and around the experimental fields. Final prototypes have four recording fields inside of the PDMS culture ring, enabling parallel experiments (Fig. 1b).
Electrophysiological and Optical Data Acquisition and Analysis
Recordings of spontaneous cellular activity were performed on a heat-controlled stage at 37 °C at room atmosphere using a standard multi channel systems (MCS) recording array, sampling extracellular voltage from 60 contact pads at 20,000 Hz. These recordings were acquired on either the fully topographically modified myo-MEA, our fabricated MEA without topographical features, or a commercially available MEA (Multichannel Systems Part No. HD30/10-ITO-gr), to compare responses across the three devices. The commercial MEA is manufactured on glass with indium tin oxide (ITO) conducting lines, passivated with silicon nitride, and contains titanium nitride electrode contacts of 10 μm diameter and contact pad spacing of 200 μm. Recordings of myocyte cultures were made at 14 days in vitro (DIV14), when spontaneous contractile activity is maximal. Spike sorting was performed using custom algorithms composed in a MATLAB environment and based in part on the algorithms discussed in Adamos et al.1 Briefly, potential spikes were identified using a voltage threshold of 5× the root mean squared noise for each channel. All spikes were aligned to their point of maximal deflection based on a window 2 ms preceding and 4 ms following the threshold breakpoint, and principal component analysis was performed on the resulting set of vectors. Using their position in a 2D space based on the first two principal components, likely spike events were then clustered using a K-means algorithm. The clustering process was user-guided, where the experimenter identified the starting number of clusters, and was then able to split and join clusters iteratively until spikes were correctly classified based on visual investigation. Because each cell produces action potentials with a unique shape, each of the resulting clusters represents the activity of a single cell (or “unit”) as its activity is recorded in the extracellular voltage trace from a single electrode. Metrics of spike characteristics were then calculated based on the morphology of the average spike shape for each unit. In our case, signal-to-noise ratio (SNR) is the ratio of the peak-to-valley amplitude of a spike shape to the RMS noise recorded on that electrode, and the Unit SD is the average SD along the 6 ms window surrounding the point of maximal deflection.
Analysis of Contractile Activity
An unordered myotube culture was grown on the topographically modified myo-MEA. Videos of cells were acquired using the Qcapture-pro software at a frame rate of 25 frames per second. Automated localization of contractile activity was performed as discussed in Langhammer et al.17 Briefly, videos were analyzed using a series of image processing steps and pattern recognition steps, which make it possible to identify regions of synchronized contractility within videos of myotube cultures, returning the location of the contractile myotubes as well as their pattern of contractions.
RESULTS
Myotube Morphology on PDMS Substrates with Microscale Topographical Trenches
We first wanted to optimize conditions for myotube alignment. Consistent with prior results, we found that both microscale chemical7,8,19,27 and topographical2,14 patterning techniques were effective at directing myotube alignment (Figs. 3a and 3b). Conditions affecting the rate of fusion and the final myotube morphology (shape and size) include seeding density and surface chemistry. Surfaces adsorbed with pro-fusion proteins, such as laminin, promoted myotube differentiation while those adsorbed with non-bioactive adhesion promoters, such as PEI or PDL, did not (data not shown). On laminin adsorbed surfaces, myoblast fusion and maturation into striated myotubes was robust. Myotubes in the inter-trench plateau regions tended to be flattened out and non-overlapping, pushing more of the myotube into one focal plane and facilitating visualization of the striations (Fig. 3c). Cell growth in the trench regions tended to be more three-dimensional and allowed for multi-layered growth, requiring images from serial Z-planes to show myotube striations (Fig. 3d). While this produced local changes in cell density, each low magnification image revealed a constant cell density because it contained equal portions of trench and plateau regions regardless of trench geometry; this characteristic is due to our selection of substrates with equal trench width and spacing.
FIGURE 3.

Myotube morphology on chemically and topographically patterned substrates. (a) Myotubes at DIV 11 grown on unpatterned (top) and laminin-striped (middle and bottom) glass. (b) Myotubes at DIV 11 grown on PDMS substrates topographically modified with 30 μm grooves (left), 50 μm grooves (middle) and 150 μm grooves (right) of 40 μm depth. Striations in myotubes at DIV 14 grown in the plateau region (c) and groove regions (d) of a topographically modified PDMS substrate.
Also consistent with previous studies,19 we found that there is an optimal width for creating patterns of physically isolated, unbranching myotubes (Fig. 3a). For chemical patterns, it has been observed previously that as the feature size is reduced below this critical size, myotubes either connect between features or fail to adhere and mature, and as feature size is increased over the critical size, several myotubes are able to associate within each feature. Optimal trench spacing for achieving a 1:1 trench-to-myotybe relationship was similar to the dimensions for chemical spacing. Figure 3b shows primary myocyte cultures on trench widths of 30, 50, and 150 μm. On 50 μm trench geometry, each feature contained a single myotube. In the larger groove geometries, multiple myotubes co-localized within the same feature, and on smaller trench geometries, myotubes were able to reach across trenches. The width of individual myotubes, however, appeared largely unchanged between these different scenarios.
We used the optical gradient method to identify the effective angle of alignment for each square field of the microscope image based on the average X- and Y-intensity gradients of the pixels therein (Figs. 4a and 4b—bottom, red bars). The orientation of each square field can then be compared to the orientation of the trenches. The distribution of orientations for the entire image relative to the primary trench direction will be highly concentrated around zero for cultures that are highly aligned with trench axis (Fig. 4a—top) or will be flat for cultures with random growth (Fig. 4b—-top). To characterize this distribution, the average angular deviation from the trench axis can be calculated, which will be approximately 45° in the case of random growth and will be lower in the cases of more organized growth.2,3
FIGURE 4.
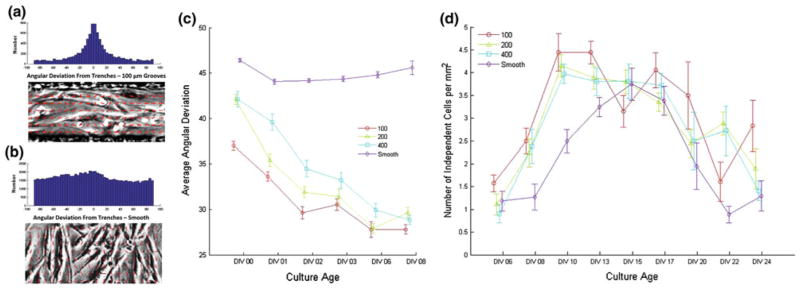
Myoblast alignment with major trench axis from DIV 0–8. (a) Angular deviation distribution (top) of local alignment fields detected using gradient method (example field bottom) for myoblasts on 100 μm trenches (40 μm deep) 12 h after seeding. (b) Angular deviation distribution (top) of local alignment fields detected using gradient method (example field bottom) for myoblasts on an unpatterned PDMS substrate. (c) Average amplitude of angular deviation from the major trench axis for substrates with 100, 200, 400 μm, and unpatterned control for timepoints from 12 h following seeding to DIV 8. (d) The number of independently active cells per unit surface area in grooved and smooth myotube cultures as a function of culture age.
Analysis of myoblast and myotube alignment using this method showed that myotube alignment was induced by topographical guidance cues, consistent with prior studies on guidance cues of similar size. Myotube cultures seeded on PDMS substrates with trenches had an average angular deviation noticeably lower than that observed in cultures grown on smooth PDMS substrates, which was approximately equal to the 45° expected from truly random growth (Fig. 4c).
Analysis over the timescale from DIV 0 through DIV 8, however, showed a number of additional trends in myoblast alignment and fusion into myotubes. While myotubes on all grooved substrates ultimately reach the same degree of directed orientation by DIV 8, there are transient differences between substrates bearing 100, 200, and 400 μm trench geometries during early time points (Fig. 4c). Alignment of myoblasts, even before they have begun to fuse into myotubes, occurs sooner on the narrower trench geometries, as exhibited by the alignment of unfused myoblasts as early as 12 h after seeding on 100 μm trenches (Fig. 4a) relative to an unpatterned control (Fig. 4b).
With the recent development of an algorithm for quantifying myotube association based on videos of spontaneous contractility,17 we are now able to look at the effects of topographical guidance cues on this measure of myotube function in addition to simple morphological examination. When this spontaneous activity is quantified, we see a similar trend as is observed in the myotube alignment data (Fig. 4d). While myotube cultures on grooved substrates exhibited a greater number of spontaneously contractile cells during early time points (i.e., DIV 8–13), the myotube cultures on smooth substrates ultimately caught up to them and produced similar quantities of spontaneously contractile cells (i.e., DIV 15–17).
Topographical Features Constructed on Top of the Substrate-Embedded MEA Direct Myotube Formation and Morphology
We next wanted to confirm that our myotube alignment could be duplicated on substrate-embedded MEAs. As seen in Fig. 5, multiple myotubes are observed to form along the bottom of the trenches, aligned in parallel with the major trench axis. Similarly, the topographical features are able to direct myotube contractility to the trenches. However, because these trenches are open ended and connect to a large open field, they have the interesting effect of funneling multiple myotubes to a single trench (Fig. 5d), and of funneling separate “fingers” of a single myotube down multiple trenches (Fig. 5c). We previously confirmed that myotube contractility appears to be directed to, aligned with, and confined largely within the trenches.16 The highest degree of order is achieved at 100 μm, with disorder increasing as the length of uninterrupted trench width increases. This is important since we need the contractile activity of myotubes to be in specific areas (trenches) where the electrodes are located so that myotube activity can be detected by the electrodes.
FIGURE 5.

Myotube differentiation and guidance on myo-MEA topographical features. (a) and (b) Myotubes lying along the bottom of trenches and on top of electrode contacts in a “wing” region. (c) and (d) Myotube contractility funneled down trenches. The green, red, blue, and purple thatched regions delineate individual, independent myotube contractions determined by the algorithm described in Langhammer et al.17
Detection of Myotube EAPs
We confirmed that we are able to use the topographically modified myo-MEA prototypes to record the bioelectrical activity of spontaneously active myotubes in similar fashion to commercially available MEAs.15 Spike sorting of the resulting extracellular voltage traces is possible, yielding unit-specific EAPs with high reproducibility and low intra-unit variance (Fig. 6d). A comparison was made of myotube EAP qualities measured on three different types of electrode; (1) topographically modified myo-MEAs, (2) the myo-MEA electrode pattern without the insulating topographical SU-8 layer, and (3) commercially available MEAs. There is similar EAP morphology recorded on all substrates, exhibiting the characteristic multiphasic and unpredictable EAP morphologies (Fig. 6a). However, there is an amplification of EAP amplitude observed on the fully insulated prototypes (Fig. 6b) relative to both the uninsulated and the commercially available MEAs. This also contributed to the larger SNR seen on EAP recordings of the insulated myo-MEA (Fig. 6c); however, the effect is less than would be expected based on the larger amplitudes. This finding is consistent with the theory that guidance of myotube formation to electrode sites by the topographical trenches results in an increase in electrode sealing,4–6 but that the reduction in recording surface area results in a higher noise floor. The finding that the uninsulated myo-MEA electrode pattern also showed increased amplitude and SNR over the commercially available MEA is somewhat surprising, as theory would dictate that current leakage through the uninsulated leads and into solution would diminish the effective voltage recorded. However, in cultures this dense, the overlying cell layer may provide some insulation, diminishing this current shunt. When combined with the much larger surface area available for recording, this may explain the observed increase in amplitude.
FIGURE 6.
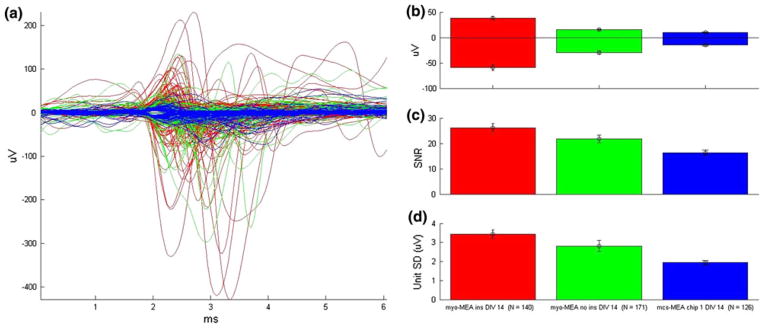
Myo-MEA recordings of myotube EAPs. EAPs are detected from sister cultures grown on topographically patterned myo-MEA (red), uninsulated myo-MEA (green), and commercially available MEAs (blue). (a) All units for each device superimposed (6 ms of data shown). (b) Average positive and negative deflection for all units measured in μV. (c) Average SNR for all units. (d) Average unit SD for all units.
Changes in Myotube Dynamics due to Topographical Modification
It is possible to identify spatial and temporal patterns in myotube activation using the spike sorted EAP data. These patterns of activity are affected by the topographical patterning of the electrode. Figure 7a shows 5 s of data recorded from the four fields of a myo-MEA. Total activity is the result of a combination of repeating vertical banding patterns (generated by myotubes that span multiple trenches and the central region), and units that fire in isolation (generated by myotubes confined to a single trench). Obvious repeating activation motifs occurring in 3 s of data from a single recording field have been identified by hand (Fig. 7b—colored rectangles). The distribution of the synchronous bursting patterns is limited to each of the four recording fields (i.e., there is little activity that spans more than 1 recording field). By comparison to the insulated myo-MEA, there are two noteworthy observations about the EAP activity recorded by the uninsulated myo-MEA electrode pattern. There are more units recorded on it (a 20% increase over the insulated myo-MEA, compared to Figs. 7c and 7d), and these units have a higher activation rate. This is consistent with the much larger recording field, which in the uninsulated myo-MEA includes the leads as well as the contacts. This larger electrode area records activity of all cells along its path, contributing to the larger number of units detected. Additionally, these units are active more frequently, and are capable of switching between “seizure-like” state (Fig. 7d), where every unit fires synchronously and rapidly, and more “non-seizure-like” state (Fig. 7c), where individual units and activation motifs can be identified. One explanation is that the culture is able to grow in an uninterrupted sheet in which every cell is mechanically coupled to every other cell. This may create a situation where contraction of a myotube mechanically triggers the contraction of neighboring cells, even though they may remain electrophysiologically distinct. The presence of the topographical cues may be enough to break up the mechanical coupling to the point that culture-wide “epileptic” events are no longer possible. To further support this point, we find that myotubes grown on the commercially available MEA show less frequent recording events due to substrate insulation decreasing the number of myotubes in contact with each electrode trace while simultaneously preserving synchronized depolarization behavior seen with the unpatterned/uninsulated myo-MEA (Fig. 7e).
FIGURE 7.

Patterns of myotube activation on topographically patterned vs. uninsulated myo-MEAs. (a) Five seconds of activity detected in four fields of a topographically patterned myo-MEA. (b) Three seconds of data from a single recording field in which repeating activation motifs have been identified by hand (colored rectangles). Activity detected in four fields of an uninsulated myo-MEA during non-seizure-like (c) and seizure-like (d) activity. Recordings made at DIV 14. Each raster plot consists of four horizontal fields, representing each of the four recording fields. The electrodes in each field are color-coded according to location (central electrodes in green, wing electrodes in red). (e) Myotubes grown on a commercially available MEA show less frequent recording events due to substrate insulation decreasing the number of myotubes in contact with each electrode trace while preserving synchronized depolarization behavior seen on the uninsulated myo-MEA in (d). The raster plot shows 30 s of data recorded from a myotube culture at DIV 12 and expanded view of 1 s data segments from within the 30 s data as indicated by the red rectangle. An example of both a synchronized network and single myotube depolarization spanning multiple electrode contacts are shown (blue and green rectangles, respectively).
Spatial Distribution of Neuronal and Myotube EAP Sources
For our myo-MEA to be useful, we must be able to detect distinct activity from neurons vs. myotubes. To confirm that this is indeed the case, we recorded from the central region containing the spinal cord explant and its neurites while simultaneously recording from the myotubes. Spinal cord explants adhere to the myo-MEA surface, with the explant body largely confined to the central region (Fig. 8a). By DIV 5, aggressive axonal outgrowth extends along the glass bottom and is guided down the topographical channels (Fig. 8b). By DIV 7 explant bodies generate spontaneous bursting activity detectable on the central region electrodes, consisting of multiple, rapid, EAPs (Fig. 8c). Bursting behavior can be observed from multiple explants on the same myo-MEA; however, the distance between them is sufficient that their activity is not coupled. Additionally, explant EAP activity is bound only to the central region, and even up to an age of 3 weeks in culture explant bursting activity is never detectable on the trench electrodes. By comparison, myotube EAP activity can be observed in the wing regions (red points) as well as the central regions (green points, shown in Fig. 7a).
FIGURE 8.

Explant integration with the myo-MEA. (a) Spinal cord explants cultured in central region of two neighboring recording fields. (b) Axonal guidance down trenches from DIV 2–5. (c) Raster plot of single spike activity.
DISCUSSION
In this study, we have investigated the effects of microscale topographical patterns in the form of parallel stripes on the development of structured myotube cultures, using myotube alignment, and for the first time, a measure of functional myotube independence as endpoints. Furthermore, we have developed a substrate-embedded MEA to assay for developmental changes when spinal cord explant neurons and myotubes are cultured together. We have optimized myotube alignment, and we show that electrical recordings from the neurons and myotubes can be spatially segregated. We present a tool with which to study the mechanism underlying myoblast fusion in the future.
Microscale Topographical Cues to Align Myotubes
Many different substrates have been used to drive myotube alignment.12,24 However, in many of these techniques, myotubes show a “dose-insensitivity” effect, in which myoblast response to a graded range of alignment cues tends to be essentially binary (i.e., cells are either highly aligned or completely random) rather than exhibiting a graded alignment response.14,18,22,26 This is consistent with our findings that there is little difference between the ultimate amount of alignment observed between trench widths over the range of trench geometries examined.
Additionally, we found that changes in myotube behavior in response to microscale trenches are largely a product of early events in myoblast spreading and alignment. Myotube alignment increases through DIV 8, but a large and substrate geometry-dependent difference in cell alignment on patterned and unpatterned substrates was observed as early as 12 h following seeding. This was likely due to the grooves partially guiding cell spreading in the early stages of myoblast attachment. The effect was most notable in the narrower trench geometries because these features have spatial dimensions on the same order of magnitude as the myoblasts themselves. Because myoblasts are polarized cells, which are spindle shaped, this head start in alignment most likely reduces the amount of time they need to spend migrating under their own power to achieve the end-to-end alignment thought to be required for fusion and differentiation into myotubes.
Myotube Independence in Trenches
While the effects of microscale topographical trenches on myotube alignment are relatively straightforward, their effect on myotube independence is more complicated. Based on the static images that the morphological studies are based on, it would have appeared that guidance cue geometries above or below a critical size resulted in communication between myotubes within the same feature or between features, respectively. In our own chemical and topographical patterning work, as well as that of others groups, this was visualized as branching myotubes. From these morphological studies, it follows logically that only myotubes located in separate grooves are electrically isolated from one another and would therefore twitch independently. However, based on studies of spontaneous myotube contractility, it now appears that myotubes are capable of maintaining independence from neighboring cells even when they overlap extensively. This is supported by our observation that the use of microscale topographical guidance cues resulted in earlier alignment and onset of spontaneous activity but did not increase the final number of independent cells. These observations support a conceptual model where myoblast fusion and differentiation is primarily controlled by intrinsic factors rather than the extrinsic factors delivered by the static mechanical cues found in the extracellular environment of the synthetic microscale trenches.23,25 While the small boost in myoblast alignment provided by the microscale trenches is sufficient to give the fusion/maturation process a head start, it does not alter myotube cellular physiology, and therefore, the functional endpoint reached is ultimately the same.
While microscale topographical features do not have any effect on cellular independence, they can serve the useful purpose of controlling culture mechanics. Microscale grooves can be used not only to drive culture-level myotube alignment but also to direct contractile activity to specific regions and encourage contraction in specific directions. Microscale patterning techniques may be used to generate controlled anisotropy, as exists in native tissue architecture, and to direct formation of myotubes to specific locations, as would be required by microdevices incorporating an engineered skeletal muscle component.
Structured Myotube Culture on a Topographically Modified Substrate Embedded MEA
Based on the need for an in vitro means of probing myoblast fusion and myotube independence for basic science applications, and the need for functional and structured myotube cultures for tissue engineering and biosensing applications, we have integrated topographical modifications which induce cell guidance with a substrate embedded MEA. To facilitate the device’s future integration with spinal cord explants for the development of structured motor neuron-myotube cocultures, we have selected topographical modifications in the form of two trench regions (for myotube formation) joined to a central region (designed for spinal cord explant adhesion and spreading). The topographical modifications are able to direct myotube formation and contractility, as detected optically, and the underlying substrate embedded MEA is able to record EAPs from the overlying myotubes, which can then be spike sorted to identify the activity of multiple individual myotubes recorded on a single electrode. Further, the topographical modifications induce a change in the quality of the EAPs observed which is consistent with current theories on cell-electrode interactions, and a change in the behavior of the myotube culture that is caused by the induced structure.
Feasibility of Detecting Information Transmission from a Neuronal Population to a Myotube Population in Structured Co-cultures
Our proposed system addresses the unique problem of using a structured co-culture system to identify transmission of information. Detecting this phenomena based on activity of each cell type will require a unique analytical approach. Multiple patterns of connectivity may exist, and it is important that an experimental paradigm be developed which makes it possible to detect transmission of information in a variety of different forms, and is robust against the types of noise observed in culture.
Future Directions
We have developed the techniques required to quantify contractile and bioelectric activity generated by neurons and myotubes. Furthermore, we have used microfabrication processes to create culture systems that modulate these behaviors. The next step in advancing the myo-MEA technology platform is leveraging our existing analytical tools, designed to observe individual cells, to create a means of rigorously quantifying the behavior of multiple cells acting in concert. This will provide a way to fully interpret the behaviors of myotubes and neurons (both of which are able to associate with other cells of either type) in our structured cultures. This tool will take the form of automated pattern identification algorithms that isolate the repeating motifs generated by myotubes that span multiple electrodes. Isolation of these activation motifs will allow us to identify how many independent myotubes are active on an electrode surface and their spatial distribution. Within the context of the nextgeneration hybrid-biosensors and neural interfaces we have discussed, this is a good indicator of the number of independent signals the interface will be able to record.
Acknowledgments
We thank Kate Fitzgerald, Kara Mann, and Ana Rodriguez for comments on the manuscript and Dr. Jungho Park for help with the figures. This work was funded by grants from National Science Foundation IBN-0919747; New Jersey Commission on Spinal Cord Research, #07-3070-SCR-E-0. CGL and MKK were supported by Biotechnology Fellowship, Grant 5T32GM008339 from National Institute of General Medical Sciences. CGL was also supported by a New Jersey Commission on Spinal Cord Research Predoctoral Fellowship. Figure 1 has been reproduced from Langhammer et al.16 which is Open Access and was published by the same authors of this manuscript.
References
- 1.Adamos DA, Kosmidis EK, Neophilidis G. Performance evaluation of PCA-based spike sorting algorithms. Comput Methods Programs Biomed. 2008;91:232–244. doi: 10.1016/j.cmpb.2008.04.011. [DOI] [PubMed] [Google Scholar]
- 2.Bian WN, Bursac N. Engineered skeletal muscle tissue networks with controllable architecture. Biomaterials. 2009;30:1401–1412. doi: 10.1016/j.biomaterials.2008.11.015. [DOI] [PMC free article] [PubMed] [Google Scholar]
- 3.Bian W, Liau B, Badie N, Bursac N. Mesoscopic hydrogel molding to control the 3D geometry of bioartificial muscle tissues. Nat Protoc. 2009;4:1522–1534. doi: 10.1038/nprot.2009.155. [DOI] [PMC free article] [PubMed] [Google Scholar]
- 4.Bove M, Grattarola M, Martinoia S, Verreschi G. Interfacing cultured neurons to planar substrate microelectrodes—characterization of the neuron-to-microelectrode junction. Bioelectrochem Bioenerg. 1995;38:255–265. [Google Scholar]
- 5.Buitenweg JR, Rutten WLC, Marani E. Extracellular stimulation window explained by a geometry-based model of the neuron-electrode contact. IEEE Trans Biomed Eng. 2002;49:1591–1599. doi: 10.1109/TBME.2002.804504. [DOI] [PubMed] [Google Scholar]
- 6.Buitenweg J, Rutten W, Willems W, van Nieuwkastelle J. Measurement of sealing resistance of cell-electrode interfaces in neuronal cultures using impedance spectroscopy. Med Biol Eng Compu. 1998;36:630–637. doi: 10.1007/BF02524436. [DOI] [PubMed] [Google Scholar]
- 7.Camelliti P, McCulloch AD, Kohl P. Microstructured cocultures of cardiac myocytes and fibroblasts: a two-dimensional in vitro model of cardiac tissue. Microsc Microanal. 2005;11:249–259. doi: 10.1017/S1431927605050506. [DOI] [PubMed] [Google Scholar]
- 8.Engler AJ, Griffin MA, Sen S, Bonnetnann CG, Sweeney HL, Discher DE. Myotubes differentiate optimally on substrates with tissue-like stiffness: pathological implications for soft or stiff microenvironments. J Cell Biol. 2004;166:877–887. doi: 10.1083/jcb.200405004. [DOI] [PMC free article] [PubMed] [Google Scholar]
- 9.Gahwiler BH, Capogna M, Debanne D, McKinney RA, Thompson SM. Organotypic slice cultures: a technique has come of age. Trends Neurosci. 1997;20:471–477. doi: 10.1016/s0166-2236(97)01122-3. [DOI] [PubMed] [Google Scholar]
- 10.Hodson-Tole EF, Wakeling JM. Motor unit recruitment for dynamic tasks: current understanding and future directions. J Comp Physiol B. 2009;179:57–66. doi: 10.1007/s00360-008-0289-1. [DOI] [PubMed] [Google Scholar]
- 11.Karlon WJ, Covell JW, McCulloch AD, Hunter JJ, Omens JH. Automated measurement of myofiber disarray in transgenic mice with ventricular expression of ras. Anat Rec. 1998;252:612–625. doi: 10.1002/(SICI)1097-0185(199812)252:4<612::AID-AR12>3.0.CO;2-1. [DOI] [PubMed] [Google Scholar]
- 12.Koning M, Harmsen MC, van Luyn MJA, Werker PMN. Current opportunities and challenges in skeletal muscle tissue engineering. J Tissue Eng Regener Med. 2009;3:407–415. doi: 10.1002/term.190. [DOI] [PubMed] [Google Scholar]
- 13.Kovacs GTA. Electronic sensors with living cellular components. Proc IEEE. 2003;91:915–929. [Google Scholar]
- 14.Lam MT, Sim S, Zhu XY, Takayama S. The effect of continuous wavy micropatterns on silicone substrates on the alignment of skeletal muscle myoblasts and myotubes. Biomaterials. 2006;27:4340–4347. doi: 10.1016/j.biomaterials.2006.04.012. [DOI] [PubMed] [Google Scholar]
- 15.Langhammer CG, Kutzing MK, Luo V, Zahn JD, Firestein BL. Skeletal myotube integration with planar microelectrode arrays in vitro for spatially selective recording and stimulation: a comparison of neuronal and myotube extracellular action potentials. Biotechnol Prog. 2011;27:891–895. doi: 10.1002/btpr.609. [DOI] [PMC free article] [PubMed] [Google Scholar]
- 16.Langhammer CL, Kutzing MK, Luo V, Zahn JD, Firestein BL. Development of a neural interface for PNS motor control. In: Gargiulo GD, McEwen A, editors. Applied Biomedical Engineering. Croatia: InTech Rijeka; 2011. pp. 387–418. [Google Scholar]
- 17.Langhammer CG, Zahn JD, Firestein BL. Identification and quantification of skeletal myotube contraction and association in vitro by video microscopy. Cytoskeleton. 2010;617:413–424. doi: 10.1002/cm.20457. [DOI] [PubMed] [Google Scholar]
- 18.Liao IC, Liu JB, Bursac N, Leong KW. Effect of electromechanical stimulation on the maturation of myotubes on aligned electrospun fibers. Cell Mol Bioeng. 2008;1:133–145. doi: 10.1007/s12195-008-0021-y. [DOI] [PMC free article] [PubMed] [Google Scholar]
- 19.Molnar P, Wang WS, Natarajan A, Rumsey JW, Hickman JJ. Photolithographic patterning of C2C12 myotubes using vitronectin as growth substrate in serum-free medium. Biotechnol Prog. 2007;23:265–268. doi: 10.1021/bp060302q. [DOI] [PMC free article] [PubMed] [Google Scholar]
- 20.Monti RJ, Roy RR, Edgerton VR. Role of motor unit structure in defining function. Muscle Nerve. 2001;24:848–866. doi: 10.1002/mus.1083. [DOI] [PubMed] [Google Scholar]
- 21.Park BY, Zaouk R, Madou MJ. Fabrication of microelectrodes using the lift-off technique. In: Minteer SD, editor. Methods in Molecular Biology. Vol. 321. Totowa, NJ: Humana Press Inc; 2006. pp. 23–26. [DOI] [PubMed] [Google Scholar]
- 22.Razal JM, Kita M, Quigley AF, Kennedy E, Moulton SE, Kapsa RMI, Clark GM, Wallace CG. Wet-spun biodegradable fibers on conducting platforms: novel architectures for muscle regeneration. Adv Funct Mater. 2009;19:3381–3388. [Google Scholar]
- 23.Rochlin K, Yu S, Roy S, Baylies MK. Myoblast fusion: when it takes more to make one. Dev Biol. 2010;341:66–83. doi: 10.1016/j.ydbio.2009.10.024. [DOI] [PMC free article] [PubMed] [Google Scholar]
- 24.Rowlands AS, Hudson JE, Cooper-White JJ. From scrawny to brawny: the quest for neomusculogenesis; smart surfaces and scaffolds for muscle tissue engineering. Expert Rev Med Devices. 2007;4:709–728. doi: 10.1586/17434440.4.5.709. [DOI] [PubMed] [Google Scholar]
- 25.Schnorrer F, Dickson BJ. Muscle building: mechanisms of myotube guidance and attachment site selection. Dev Cell. 2004;7:9–20. doi: 10.1016/j.devcel.2004.06.010. [DOI] [PubMed] [Google Scholar]
- 26.Shimizu K, Fujita H, Nagamori E. Alignment of skeletal muscle myoblasts and myotubes using linear micropatterned surfaces ground with abrasives. Biotechnol Bioeng. 2009;103:631–638. doi: 10.1002/bit.22268. [DOI] [PubMed] [Google Scholar]
- 27.Tourovskaia A, Figueroa-Masot X, Folch A. Differentiation-on-a-chip: a microfluidic platform for long-term cell culture studies. Lab Chip. 2005;5:14–19. doi: 10.1039/b405719h. [DOI] [PubMed] [Google Scholar]