

Abstract
Background/Aims
Globus is a foreign body sense in the throat without dysphagia, odynophagia, esophageal motility disorders, or gastroesophageal reflux. The etiology is unclear. Previous studies suggested that increased upper esophageal sphincter pressure, gastroesophageal reflux and hypertonicity of esophageal body were possible etiologies. This study was to quantify the upper esophageal sphincter (UES) pressure, contractile front velocity (CFV), proximal contractile integral (PCI), distal contractile integral (DCI) and transition zone (TZ) in patient with globus gastroesophageal reflux disease (GERD) without globus, and normal controls to suggest the correlation of specific high-resolution manometry (HRM) findings and globus.
Methods
Fifty-seven globus patients, 24 GERD patients and 7 normal controls were studied with HRM since 2009. We reviewed the reports, and selected 5 swallowing plots suitable for analysis in each report, analyzed each individual plot with ManoView. The 5 parameters from each plot in 57 globus patients were compared with that of 24 GERD patients and 7 normal controls.
Results
There was no significant difference in the UES pressure, CFV, PCI and DCI. TZ (using 30 mmHg isobaric contour) in globus showed significant difference compared with normal controls and GERD patients. The median values of TZ were 4.26 cm (interquartile range [IQR], 2.30-5.85) in globus patients, 5.91 cm (IQR, 3.97-7.62) in GERD patients and 2.26 cm (IQR, 1.22-2.92) in normal controls (P = 0.001).
Conclusions
HRM analysis suggested that UES pressure, CFV, PCI and DCI were not associated with globus. Instead increased length of TZ may be correlated with globus. Further study comparing HRM results in globus patients within larger population needs to confirm their correlation.
Keywords: Gastroesophageal reflux, Globus, High-resolution manometry
Introduction
Globus is defined as a sense of lump, a retained food bolus, or tightness in the throat. The symptom is nonpainful, frequently improves with eating, commonly is episodic, and is unassociated with dysphagia or odynophagia. Globus is unexplained by structural lesions, gastroesophageal reflux disease (GERD), or histopathology-based esophageal motility disorders.
Galmiche et al1 suggested 5 diagnostic criteria for globus as persistent or intermittent, nonpainful sensation of a lump or foreign body in the throat, occurrence of the sensation between meals, absence of dysphagia or odynophagia, absence of evidences for gastroesophageal reflux and absence of histopathology-based esophageal motility disorders.
Globus is not an uncommon symptom. Nearly half of the general population has had intermittent symptoms resembling globus, while more severe and distressing symptoms comprise up to 4% of referrals to otolaryngological specialists.2,3
Some authors suggested that globus is linked with a wide range of psychopathology in men, notably depression and somatization disorder, but there is no clearly accepted etiology nowadays.4,5 Previous studies suggested that increased upper esophageal sphincter pressure,3,6,7 gastroesophageal reflux8,9 or hypertonicity of esophageal body10 are a possible etiologies of globus.
Recently, high-resolution manometry (HRM) capable of pressure monitoring from the pharynx to the stomach together with pressure topography plotting was used for clinical diagnosis of functional esophageal disorders and clinical researches.11 Based on the recent reports, we decided to collect HRM analysis data in patients with globus symptom, thereafter compared the HRM analysis parameters including upper esophageal sphincter (UES) pressure, contractile front velocity (CFV), proximal contractile integral (PCI), distal contractile integral (DCI) and transition zone (TZ) in patients with globus, gastroesophageal reflux (GERD) patients without globus and normal controls to suggest the correlation specific HRM findings for globus.
Materials and Methods
Subjects
Total of 83 patients (59 globus patients and 24 GERD patients) who were referred to the Department of Otolaryngology and Gastroenterology at Kangbuk Samsung Hospital between January 2009 and February 2012 were studied with 36 channel HRM. We reviewed their clinical records and the HRM reports retrospectively. Two patients among the globus dropped out because their HRM records had insufficient contents of analyzable parameters. Then, we conducted prospective HRM studies in 7 normal healthy volunteers.
Total 88 patients (57 globus patients, 24 GERD patients and 7 normal controls) were enrolled in our retrospective HRM comparative study.
Fifty-nine patients, who complained isolated globus symptom (as lump or foreign body sense in the throat) without dyspepsia or pyrosis in Gastroenterology or ear, nose and throat (ENT) out-patient department (OPD), were enrolled as globus group retrospectively. Twenty-seven patients via ENT department had laryngoscopic examination in the ENT OPD. All referred by ENT department had no laryngopharyngeal reflux. Twenty-four GERD patients were enrolled via Gastroenterology OPD. They had dyspepsia and/or typical heart burn, and were diagnosed as GERD by esophagogastroduodenoscopy (EGD). But, they did not take esophageal impedence pH monitoring test. We defined endoscopic GERD by the Los Angeles classification. "Red streak," "ulcer" and "erosion" on esophagogastric junction were thought as typical findings of GERD. But, the findings of minimal changes, such as mucosal edema, friability or erythema, were not excluded in our definition of endoscopic GERD. Four patients with minimal changes were included in GERD patients group in our study.
Seven normal controls were healthy volunteers for the study. They did not have any symptoms of globus and GERD. They did not undergo EGD, laryngoscopy or esophageal impedence pH monitoring.
The study was approved by the Kangbuk Samsung Hospital Institutional Review Board.
High-resolution Manometry Protocol
HRM study was performed using a 4.2 mm outer diameter solid-state manometric assembly with 36 circumferential sensors spaced at 1 cm intervals (Sierra Scientific Instruments. Los Angeles, CA, USA). Before HRM recording, transducers were calibrated at 0 and 350 mmHg using externally applied pressure. Studies were done in a sitting position after at least 6 hour fast. After transnasal placement of manometry assembly, it was positioned to record from the hypopharynx to the stomach with 3 intragastric sensors. Then, the catheter was fixed to the nose by taping. Our manometric protocol also included a 5 minute period to assess basal sphincter pressure and ten 5 mL water swallows.
High-resolution Manometry Data Analysis
Manometric data were analyzed using software customized for processing binary manometric data into isocontour pressure plots and spatial pressure variation plots, ManoView (Sierra Scientific Instruments) and MATLAB (The MathWorks, Natick, MA, USA).
First, data were corrected for the thermal sensitivity of the pressure-sensing elements using the thermal compensation function of ManoView.
After thermal correction, the 5 minute recording before the first test swallow was subdivided into consecutive 30 second intervals. The position of the UES was readily identified on the pressure topography plots as a high-pressure zone demarcated by an abrupt increase in pressure relative to atmospheric pressure at its proximal margin and intrathoracic pressure at its distal margin. The UES, detectable as a high-pressure zone, was analyzed with a special software model (eSleeve), which allowed to analyze the highest pressure in the UES, irrespective of movement artifacts and the pressures during inspiration and expiration, was determined as Kwiatek et al6 did.
We also defined the lower margin of the UES and esophagogastric junction (EGJ) from resting state of esophagus to differentiate proximal and distal esophageal contraction from UES and EGJ as Ghosh et al12 did.13,14 The PCI and the DCI werecalculated with 30 mmHg isobaric contour pressure levels. CFV was measured as the slope of the best-fit tangent to the 30 mmHg isobaric contour pressure levels automatically by ManoView.
TZ was easily localized between the proximal and distal esophageal contractile segments as the locus of the nadir pressure amplitude during peristalsis.15 Quantifying a spatial length and temporal duration of the TZ at 30 mmHg isobaric contour pressure levels was calculated by using ManoView (Fig. 1).
Figure 1.
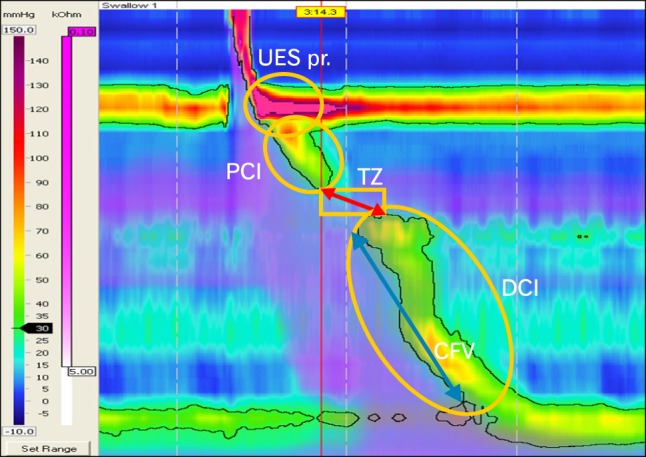
The 5 parameters in high-resolution manometry analysis. UES pr., upper esophageal sphincter pressure; PCI, proximal contractile integral; TZ, transition zone; DCI, distal contractile integral; CFV, contractile front velocity.
The 5 parameters (UES pressure, CFV, PCI, DCI and TZ) were obtained from 5 each swallowing plot, that was suitable for analysis due to relative discrete pressure difference during peristalsis. The parameters in 57 globus patients were compared with that of 24 GERD patients and 7 normal controls.
Statistical Methods
The 5 parameters (UES pressure, CFV, PCI, DCI and TZ) were summarized using medians with 5th-95th percentile range. The Kruskal-Wallis non-parametric test and ANCOVA test were used to compare patients groups and controls. Post hoc analyses were performed with Mann-Whitney U test for subgroup analysis in 3 each group (normal vs. GERD, normal vs. globus and globus vs. GERD). Bonferroni method was applied to avoid the increasement of Type 1 error. All data were analyzed using the PASW Stastics version 18.0 for Window software (SPSS Inc., Chicago, IL, USA).
Results
Subjects Demographics
Subjects demographics are shown in Table 1. Fifty-seven globus patients, 24 GERD patients, and 7 normal controls were enrolled in our study. Their median age were 43 (20-50), 51 (20-57), and 57 (30-81) years, respectively. Female was dominant (72%) in globus patients, but not in GERD patients (42%). Laryngopharyngeal reflux was ruled out in 27 patients via ENT department by laryngoscopic examination in ENT OPD. But, the other 30 globus patients and 24 GERD patients who were enrolled via Gastroenterology OPD did not take laryngoscopy. Total of 62 patients underwent endoscopy (30 in globus and 24 in GERD) (Table 1).
Table 1.
Subjects Demographics
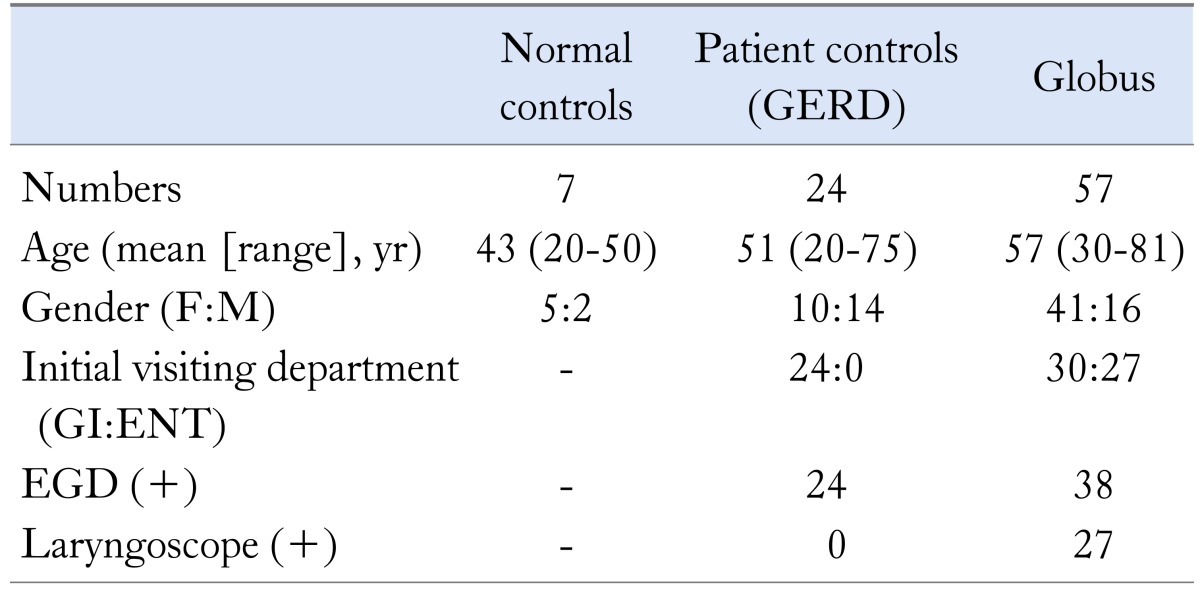
GERD, gastroesophageal reflux disease; GI, gastrointestinal medicine department; ENT, ear, nose and throat department; EGD, esophagogastroduodenoscopy.
Comparison of High-resolution Manometry Parameters
There was no significant differences in the UES pressure, CFV and body tonicity (PCI and DCI). But, TZ (spatial gap between the termination of the proximal contraction and the initiation of the distal contraction using a 30 mmHg isobaric contour) in globus patients showed significant difference compared with normal controls and patient controls (GERD patients). The median values of TZ were 4.26 cm (interquartile [IQR], 2.30-5.85) in globus, 5.91 cm (IQR, 3.97-7.62) in patient controls, and 2.26 cm (IQR, 1.22-2.92) in normal controls (P = 0.001). There was statistically significant difference in median value of TZ in each subgroup comparison (P-value was 0.011 in comparison of globus to GERD, 0.013 in comparison of globus to normal, and 0.000 in GERD to normal) (Table 2 and Fig. 2).
Table 2.
Comparison of High-resolution Manometry Parameters in Globus, Gastroesophageal Reflux Disease and Normal Controls
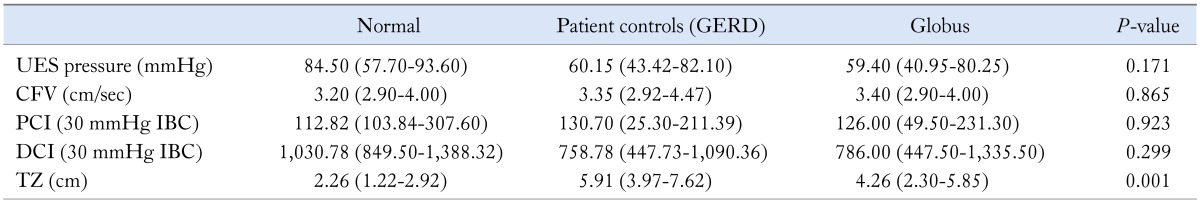
GERD, gastroesophageal reflux disease; UES, upper esophageal sphincter; CFV, contractile front velocity; PCI, proximal contractile integral; IBC, isobaric contour; DCI, distal contractile integral; TZ, transition zone.
Data are presented as median (interquartile range).
Figure 2.

The distribution box plot of measured value of transition zone in globus, gastroesophageal reflux disease (GERD) and normal controls. Above box plot shows differences of distributions and median values of measured transition zone value among the 3 groups.
Discussion
Globus sensation (also globus pharyngeus and globus hystericus) is common in the general population. Thompson and Heaton16 reported that 45 percent of 147 healthy volunteers had experienced globus sensation at least once. It was 3 times more common in women than in men who were under the age of 50, while there was no difference in prevalence between men and women over the age of 50.17 Similar gender ratio was observed in our study population. But, their median age was over the age of 50. The etiology is still unclear, and it has been proposed that varieties of disorders are associated with globus and it's clinical aspects are overlapped somewhat. Some authors suggested that an association between globus sensation and GERD.8,18,19 Chen et al10 suggested an association with visceral hypersensitivity. Other authors suggested that hypertensive UES pressure was related with globus.3,6,20
In our study, HRM analysis suggested that UES pressure, CFV and esophageal tonicity (PCI and DCI) were not associated with globus sensation. But increased length of TZ may be correlated with globus. TZ is localized stereotypical morphologic feature of peristalsis between the proximal and distal esophageal segmental contraction. Ghosh et al15 reported that 34.6% of the patients with spatial and/or temporal TZ defects had unexplained dysphagia, which was significantly more than seen with normal TZ dimensions (19.8%), and TZ defects greater than 2 cm in length and 1 second in duration were strongly associated with otherwise unexplained dysphagia, occurring in 57% of the 25 patients, and it might be related to dysphagia in a minority of patients (< 4% in this series).15
We would like to address about some hypothesis based on the previous study by Ghosh et al,21 presented at the planning stage of our research. Ghosh et al21 showed that impaired coordination of upper and lower contractile wave was associated with bolus retention of TZ, and insufficient strength of TZ, and/or increased spatial separation between upper and lower contractile wave (increased TZ) resulted in the failure of bolus fluid clearance from the TZ. The strength of TZ was reduced as the spatial separation became wider.
Two hypotheses were needed for explaining our results based on their study. First one was that bolus retention itself or impaired clearance of bolus retention might have caused the symptom of globus or GERD. Some studies showed that functional anatomical location (TZ) at aortic arch level was common site for symptomatic bolus impaction and esophageal hypersensitivity.22 We thought that first hypothesis might be the possible explanation. Second hypothesis was that someone could have had the symptom of globus and the other could have had the symptom of GERD depending on the amount of impaired bolus retention (who had larger amount of impaired bolus retention could experience the GERD symptom as pyrosis, and who had smaller amount could feel globus). It was difficult to accept that assumption and hardly more difficult to clarify the relationship. We hope that ongoing, well designed prospective study using HRM and 24-hour pH impedence monitoring will reveal that relationship.
As Rakshit and de Caestecker4 pointed out, our study also had same shortcomings. It was retrospective comparative study, and enrolled subjects were small population, especially the normal controls. Globus patients in our study were not purely selected by Rome III criteria. Majority of globus patients and some of GERD patients did not take EGD or pH monitoring to check for gastroesophageal reflux. Furthermore, laryngopharyngeal reflux that was also one possible cause of globus was not completely ruled out in some of the globus patients enrolled via gastrointestinal OPD without laryngoscopic evaluation. Kwiatek et al6 suggested that hyperdynamic changes of UES pressure correlated with globus rather than hypertonicity of UES pressure itself. We have now regrets that we represented the UES pressure by just only maximum pressure of UES.
Despite of recent evaluation with HRM, globus has obscure etiology. Further prospective controlled study comparing HRM analysis data in globus group with larger normal controls is needed to confirm their correlation.
Footnotes
Financial support: None.
Conflicts of interest: None.
Author contributions: Won Seok Choi: conception and design of the study; collection, assembly, statistical analysis and interpretation of data; drafting and revision of the manuscript; and approval of the final version of the manuscript. Tae Wan Kim: generation, collection and assembly of data; and approval of the final version of the manuscript. Ja Hyun Kim: assembly, statistical analysis and interpretation of data; and approval of the final version of the manuscript. Sang Hyuk Lee: generation, collection and assembly of data; and approval of the final version of the manuscript. Woon Je Hur: generation, collection and assembly of data; and approval of the final version of the manuscript. Young Gil Choe: generation, collection and assembly of data; and approval of the final version of the manuscript. Sang Hyuk Lee: conception and design of the study; interpretation of data; and approval of the final version of the manuscript. Jung Ho Park: conception and design of the study; interpretation of data; revision of the manuscript; and approval of the final version of the manuscript. Chong Il Sohn: conception and design of the study; interpretation of data; revision of the manuscript; study supervision; and approval of the final version of the manuscript.
References
- 1.Galmiche JP, Clouse RE, Bálint A, et al. Functional esophageal disorders. Gastroenterology. 2006;130:1459–1465. doi: 10.1053/j.gastro.2005.08.060. [DOI] [PubMed] [Google Scholar]
- 2.Sun J, Xu B, Yuan YZ, Xu JY. Study on the function of pharynx upper esophageal sphincter in globus hystericus. World J Gastroenterol. 2002;8:952–955. doi: 10.3748/wjg.v8.i5.952. [DOI] [PMC free article] [PubMed] [Google Scholar]
- 3.Corso MJ, Pursnani KG, Mohiuddin MA, et al. Globus sensation is associated with hypertensive upper esophageal sphincter but not with gastroesophageal reflux. Dig Dis Sci. 1998;43:1513–1517. doi: 10.1023/a:1018862814873. [DOI] [PubMed] [Google Scholar]
- 4.Rakshit R, de Caestecker J. Globus: are we any nearer to understanding it? Am J Gastroenterol. 2009;104:299–301. doi: 10.1038/ajg.2008.152. [DOI] [PubMed] [Google Scholar]
- 5.Gale CR, Wilson JA, Deary IJ. Globus sensation and psychopathology in men: the Vietnam experience study. Psychosom Med. 2009;71:1026–1031. doi: 10.1097/PSY.0b013e3181bc7739. [DOI] [PubMed] [Google Scholar]
- 6.Kwiatek MA, Mirza F, Kahrilas PJ, Pandolfino JE. Hyperdynamic upper esophageal sphincter pressure: a manometric observation in patients reporting globus sensation. Am J Gastroenterol. 2009;104:289–298. doi: 10.1038/ajg.2008.150. [DOI] [PMC free article] [PubMed] [Google Scholar]
- 7.Allescher HD. Globus sensation and hyperdynamic upper esophageal sphincter: another piece in the puzzle? Gastroenterology. 2009;137:1847–1849. doi: 10.1053/j.gastro.2009.09.034. [DOI] [PubMed] [Google Scholar]
- 8.Hill J, Stuart RC, Fung HK, et al. Gastroesophageal reflux, motility disorders, and psychological profiles in the etiology of globus pharyngis. Laryngoscope. 1997;107:1373–1377. doi: 10.1097/00005537-199710000-00015. [DOI] [PubMed] [Google Scholar]
- 9.Zeleník K, Matoušek P, Urban O, Schwarz P, Stárek I, Komínek P. Globus pharyngeus and extraesophageal reflux: simultaneous pH <40 and pH <50 analysis. Laryngoscope. 2010;120:2160–2164. doi: 10.1002/lary.21147. [DOI] [PubMed] [Google Scholar]
- 10.Chen CL, Szczesniak MM, Cook IJ. Evidence for oesophageal visceral hypersensitivity and aberrant symptom referral in patients with globus. Neurogastroenterol Motil. 2009;21:1142. doi: 10.1111/j.1365-2982.2009.01316.x. e96. [DOI] [PubMed] [Google Scholar]
- 11.Pandolfino JE, Fox MR, Bredenoord AJ, Kahrilas PJ. High-resolution manometry in clinical practice: utilizing pressure topography to classify oesophageal motility abnormalities. Neurogastroenterol Motil. 2009;21:796–806. doi: 10.1111/j.1365-2982.2009.01311.x. [DOI] [PMC free article] [PubMed] [Google Scholar]
- 12.Ghosh SK, Pandolfino JE, Zhang Q, Jarosz A, Shah N, Kahrilas PJ. Quantifying esophageal peristalsis with high-resolution manometry: a study of 75 asymptomatic volunteers. Am J Physiol Gastrointest Liver Physiol. 2006;290:G988–G997. doi: 10.1152/ajpgi.00510.2005. [DOI] [PubMed] [Google Scholar]
- 13.Park MI. Recent concept in interpreting high-resolution manometry. J Neurogastroenterol Motil. 2010;16:90–93. doi: 10.5056/jnm.2010.16.1.90. [DOI] [PMC free article] [PubMed] [Google Scholar]
- 14.Kahrilas PJ, Ghosh SK, Pandolfino JE. Esophageal motility disorders in terms of pressure topography: the Chicago Classification. J Clin Gastroenterol. 2008;42:627–635. doi: 10.1097/MCG.0b013e31815ea291. [DOI] [PMC free article] [PubMed] [Google Scholar]
- 15.Ghosh SK, Pandolfino JE, Kwiatek MA, Kahrilas PJ. Oesophageal peristaltic transition zone defects: real but few and far between. Neurogastroenterol Motil. 2008;20:1283–1290. doi: 10.1111/j.1365-2982.2008.01169.x. [DOI] [PMC free article] [PubMed] [Google Scholar]
- 16.Thompson WG, Heaton KW. Heartburn and globus in apparently healthy people. Can Med Assoc J. 1982;126:46–48. [PMC free article] [PubMed] [Google Scholar]
- 17.Moser G, Wenzel-Abatzi TA, Stelzeneder M, et al. Globus sensation: pharyngoesophageal function, psychometric and psychiatric findings, and follow-up in 88 patients. Arch Intern Med. 1998;158:1365–1373. doi: 10.1001/archinte.158.12.1365. [DOI] [PubMed] [Google Scholar]
- 18.Locke GR, 3rd, Talley NJ, Fett SL, Zinsmeister AR, Melton LJ., 3rd Prevalence and clinical spectrum of gastroesophageal reflux: a population-based study in Olmsted County, Minnesota. Gastroenterology. 1997;112:1448–1456. doi: 10.1016/s0016-5085(97)70025-8. [DOI] [PubMed] [Google Scholar]
- 19.Anandasabapathy S, Jaffin BW. Multichannel intraluminal impedance in the evaluation of patients with persistent globus on proton pump inhibitor therapy. Ann Otol Rhinol Laryngol. 2006;115:563–570. doi: 10.1177/000348940611500801. [DOI] [PubMed] [Google Scholar]
- 20.Cook IJ, Dent J, Collins SM. Upper esophageal sphincter tone and reactivity to stress in patients with a history of globus sensation. Dig Dis Sci. 1989;34:672–676. doi: 10.1007/BF01540336. [DOI] [PubMed] [Google Scholar]
- 21.Ghosh SK, Janiak P, Fox M, Schwizer W, Hebbard GS, Brasseur JG. Physiology of the oesophageal transition zone in the presence of chronic bolus retention: studies using concurrent high resolution manometry and digital fluoroscopy. Neurogastroenterol Motil. 2008;20:750–759. doi: 10.1111/j.1365-2982.2008.01129.x. [DOI] [PubMed] [Google Scholar]
- 22.Fox M, Hebbard G, Janiak P, et al. High-resolution manometry predicts the success of oesophageal bolus transport and identifies clinically important abnormalities not detected by conventional manometry. Neurogastroenterol Motil. 2004;16:533–542. doi: 10.1111/j.1365-2982.2004.00539.x. [DOI] [PubMed] [Google Scholar]