

Abstract
Context:
The possibility that differences in insulin sensitivity explain why women, especially younger women, have a lower cardiovascular disease (CVD) risk than men remains an unsettled issue.
Objective:
The objective of this study was to evaluate whether sex disparities in CVD risk are associated with differences in insulin resistance.
Design/Setting/Participants:
This was a cross-sectional study of women (n = 468) and men (n = 354) who had the measurement of CVD risk factors and steady-state plasma glucose (SSPG) concentration (insulin resistance) using the insulin suppression test. The population was also divided by median age (51 y) to evaluate the effect of age on sex differences.
Main Outcome Measures/Results:
In general, the SSPG concentration was similar between sexes. At higher BMI (≥30 kg/m2), women had significantly lower SSPG concentration than men (sex × BMI interaction, P = .001). However, sex differences in CVD risk factors were not due to differences in SSPG but accentuated by a higher degree of insulin resistance in younger (age < 51 y) but not older (≥ 51 y) individuals. In younger individuals, women had significantly (P ≤ .007) lower diastolic blood pressure and fasting glucose and triglyceride concentration compared with men in SSPG tertile 3 (most insulin resistant) but not in tertile 1 (least insulin resistant). Older women had lower diastolic blood pressure compared with men, regardless of SSPG. High-density lipoprotein cholesterol remained higher in women, regardless of age or SSPG.
Conclusions:
The female advantage is not due to a difference in insulin action but results from an attenuation of the relationship between insulin resistance and CVD risk, especially in younger individuals.
Cardiovascular disease (CVD) risk is lower in women than men, and this disparity is referred to as the female advantage (1). Women, especially younger women, also have more favorable CVD risk factors compared with same-aged men including a lower prevalence of dysglycemia, dyslipidemia, and hypertension (2–4). These CVD risk factors are well known to cluster with insulin resistance (5). Therefore, a simple conclusion from these data is that the female advantage occurs because women are more insulin sensitive than men, a point of view consistent with previous studies (3, 6–9), concluding that this was the case. However, other studies have not discerned a sex difference in a degree of insulin resistance (10, 11). In addition, Manco et al (12) concluded that insulin sensitivity was similar in men and women and that differences in insulin resistance predicted CVD risk only in men. These findings are consistent with the alternative notion that there are sex differences in the relationship between insulin resistance and CVD risk factors.
The purpose of this study was to evaluate these two alternative hypotheses to explain the observed CVD disparities between sexes. First, and most simply, women may be less insulin resistant compared with men. Alternatively, women may have better CVD risk profile, regardless of the degree of insulin resistance. To examine these two possibilities, we compared the degree of insulin resistance using the insulin suppression test and CVD risk factors in a large population of women and men. Given the known relationship between adiposity and insulin resistance (13), the effect of body mass index (BMI) on potential sex differences was also evaluated. Finally, because the CVD disparity is greater between younger women and men, we also assessed the effect of age on potential sex differences.
Materials and Methods
Subjects
The study population consisted of 468 women and 354 men who had all signed an informed consent to participate in studies of insulin resistance. All individuals had responded to newspaper advertisements describing our studies of glucose and insulin metabolism. Age ranged from 19 to 79 years, and the majority was non-Hispanic white (81%). Nondiabetic status was confirmed based on no known medical history of diabetes, no use of medications known to affect carbohydrate metabolism, and fasting glucose less than 126 mg/dL. All individuals were apparently healthy with no history of coronary artery, kidney, or liver disease. They all had measurement of insulin resistance using the insulin suppression test.
Measurements
All procedures were performed in the Stanford Clinical and Translational Research Unit after fasting for 12 hours. Weight and height were measured without shoes. Blood pressure was measured using a Dinamap automatic blood pressure (BP) recorder (GE Healthcare). Before the BP measurements, individuals were seated quietly in a chair for 5 minutes with feet on the floor and one arm supported at heart level. Using an appropriately sized cuff, three BP readings were taken at 1-minute intervals, and the mean of these readings was used for data analysis. Plasma triglyceride and high-density lipoprotein cholesterol (HDL-C) concentration were measured in the core laboratory at Stanford University Medical Center.
Insulin suppression test
Insulin-mediated glucose uptake was directly measured using the modified version of the insulin suppression test (14). The values for insulin resistance obtained with this approach are highly correlated (r ≥ −0.87) with the hyperinsulinemic euglycemic clamp technique (15, 16). Briefly, after an overnight fast, an iv catheter was placed in each of the subject's arms. One arm was used for the administration of a 180-minute infusion of octreotide (0.27 μg/m2·min), insulin (32 mU/m2·min), and glucose (267 mg/m2/min); the other arm was used for collecting blood samples. Blood was drawn at 10-minute intervals from 150 to 180 minutes of the infusion to determine the steady-state plasma glucose (SSPG) and insulin concentrations. The SSPG concentration provides a direct measure of the ability of insulin to mediate disposal of an infused glucose load; therefore, the higher the SSPG concentration, the more insulin resistant is the individual.
Statistical analysis
Statistical analysis was performed using SPSS (version 21 for Windows; SPSS Inc). Nonparametric variables were log transformed prior to analyses. Comparisons between groups were made using ANOVA.
To address the first question of whether women are less insulin resistant than men, we first compared SSPG concentration between sexes using a 1-way ANOVA. To test interactions, we used a 3-way ANOVA with sex, age, and BMI as factors. Age was dichotomized by the median age (51 y) as younger (<51 y) or older (≥51 y). BMI was divided as normal (BMI < 25 kg/m2), overweight (BMI 25–29.9 kg/m2), or obese (BMI ≥ 30 kg/m2). Ethnicity was included as a covariate.
We also compared the relationship between SSPG and CVD risk factors between sexes. The five CVD risk factors included systolic and diastolic BP and fasting glucose, triglyceride, and HDL-C concentrations. To evaluate interactions, a 3-way ANOVA was used with sex, age, and SSPG tertiles (SSPG-1, SSPG-2, and SSPG-3) as factors. BMI and ethnicity were included as covariates.
Results
Table 1 presents demographic and metabolic characteristics of the total experimental population as well as for the younger and older subgroups. There were no differences in age, BMI, or ethnicity between men and women in either the younger or older subgroups. Furthermore, there were no sex differences in SSPG concentration in either age group.
Table 1.
Clinical Characteristics of Women and Men Stratified by Age
| Total |
Younger (Age < 51 y) |
Older (Age ≥ 51 y) |
||||
|---|---|---|---|---|---|---|
| Women | Men | Women | Men | Women | Men | |
| n | 468 | 354 | 244 | 147 | 224 | 207 |
| Age, y | 48.7 (19–75) | 51.5 (20–79)a | 39.7 (19–50) | 40.4 (20–50) | 58.5 (51–75) | 59.3 (51–79) |
| Non-Hispanic white, n, % | 376 (80%) | 291 (82%) | 194 (80%) | 119 (81%) | 181 (81%) | 172 (83%) |
| BMI, kg/m2 | 28.2 (18.5–41.3) | 28.1 (18.0–42.2) | 27.7 (18.5–41.3) | 27.4 (18–42.2) | 28.6 (18.9–38.2) | 28.5 (18.8–38) |
| SSPG, mg/dL | 164 (25–373) | 173 (26–352) | 152 (25–354) | 156 (26–352) | 177 (39–373) | 185 (44–341) |
Data are mean (range), unless otherwise specified. With SSPG, the higher the value, the more insulin resistant the individual.
P < .001 between genders.
Figure 1 compares SSPG concentrations in women vs men, stratified on the basis of BMI and age, and shows that SSPG concentrations increased with BMI, regardless of sex or age (P < .001 for main effect of BMI). Older women and men were generally more insulin resistant compared with their younger counterparts (P < .001 for age). Interestingly, there was no main effect of sex on SSPG concentration, but there was a significant interaction between sex and BMI (P = .001). As seen in Figure 1, this interaction was due to a significant difference in SSPG concentration in the obese group. Thus, as opposed to normal and overweight women, obese women were significantly less insulin resistant compared with equally obese men, and this difference was seen in both the younger and older groups.
Figure 1.

Comparison of insulin resistance (SSPG) in women and men by BMI and age. In a 3-way ANOVA, there was a significant main effect of age and BMI but not sex (P values are shown in the text box). There was a significant interaction between sex and BMI due to a significantly lower SSPG concentration in women in the obese group (BMI ≥ 30 kg/m2). White bars, women; black bars, men.
Figure 2 illustrates the relationships between SSPG tertiles and individual CVD risk factors by sex and age. All five CVD risk factors worsened with increasing insulin resistance, regardless of sex or age (P < .001 for main effect of SSPG tertiles). There was also a significant effect of sex (P ≤ .004). Thus, women, especially younger women, had more favorable CVD risk factors than men.
Figure 2.

Relationship between insulin resistance (SSPG) tertiles and CVD risk factors in women and men by age group. A 3-way ANOVA was conducted with factors for sex, age, and SSPG groups. BMI and ethnicity were included as covariates. The main effects (P values) of SSPG, sex, and age and the interaction between sex and age are shown. The estimated marginal means (±SEM) were plotted.
There was also a significant (P < .05) interaction between sex and age for three of the five risk factors (glucose, triglycerides, and HDL-C). Figure 3 highlights these interactions by illustrating the mean values of these three CVD risk factors by sex and age in individuals in SSPG-1 (least insulin resistant) and SSPG-3 (most insulin resistant) (for mean values, see also Supplemental Table 1, published on The Endocrine Society's Journals Online web site at http://jcem.endojournals.org). As seen in Figure 3A, sex difference in fasting glucose concentration was significant only in younger individuals in SSPG-3. Thus, only younger women had significantly lower fasting glucose concentration compared with younger men and only in SSPG-3. In addition, younger women had lower fasting glucose concentration compared with older women and older men (see Supplemental Table 1). Therefore, younger women had the lowest fasting glucose concentration in the most insulin-resistant tertile.
Figure 3.
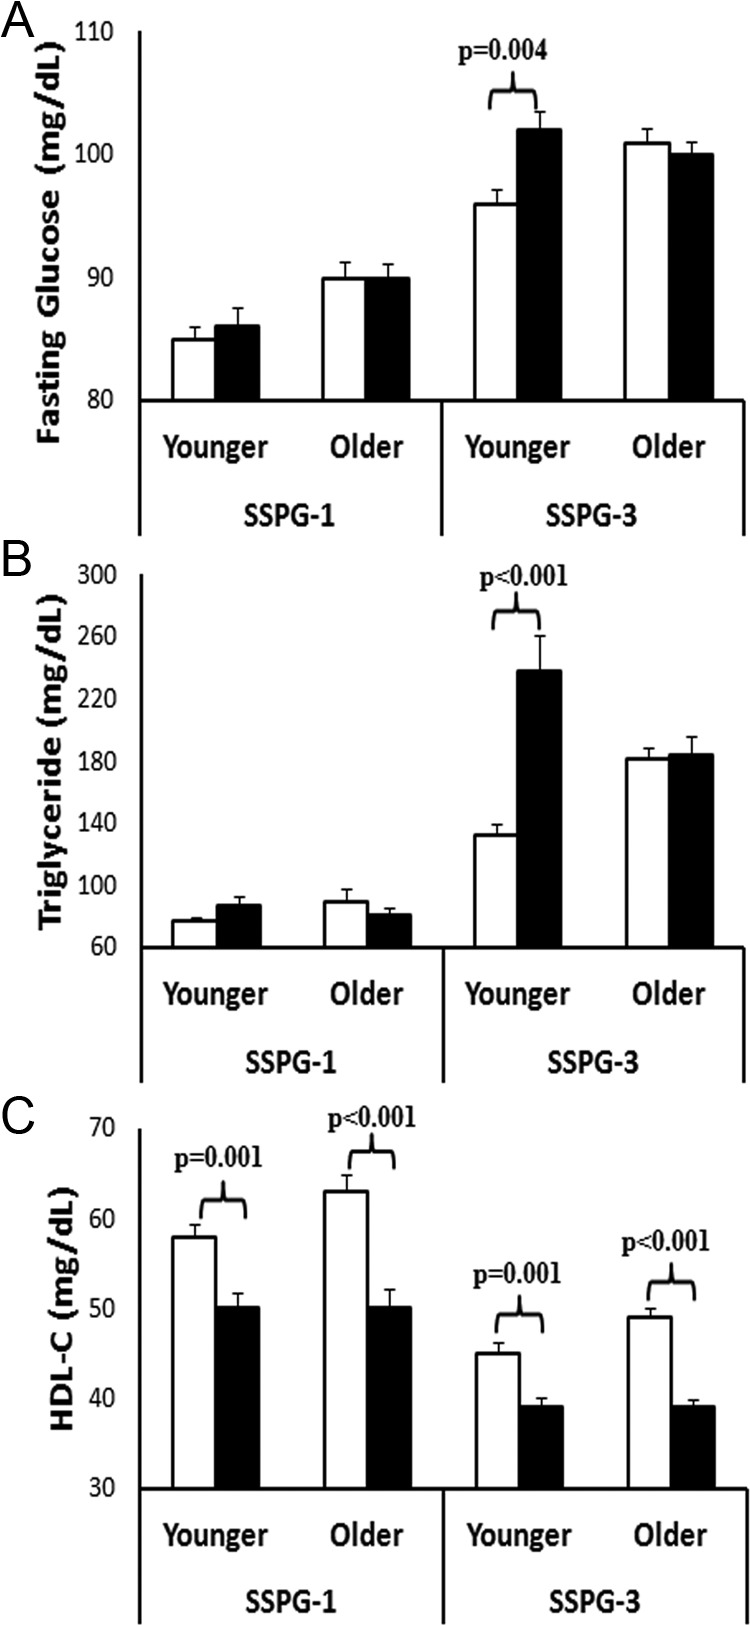
Interaction between sex and age in predicting CVD risk factors. Mean (±SEM) values are shown for individuals in SSPG-1 (least insulin resistant tertile) and SSPG-3 (most insulin resistant tertile). Only significant (P < .05) comparisons (P values) between sexes are shown. White bars, women; black bars, men.
Similar to fasting glucose, sex differences in triglyceride concentration was evident only in younger individuals in SSPG-3 (Figure 3B). Younger women again had a significantly lower triglyceride concentration compared with younger men in SSPG-3 but not in SSPG-1. Younger women also had significantly lower triglyceride concentration compared with older women and men in SSPG-3 (see Supplemental Table 1). Therefore, younger women had the lowest triglyceride concentration in the most insulin-resistant tertile. Interestingly, triglyceride concentration was similar among all groups in SSPG-1 (P ≥ .22) (see Supplemental Table 1). Because differences among groups became more pronounced with increasing SSPG tertiles, there was a significant three-way interaction among sex, age, and SSPG in predicting triglyceride concentration (P = .03) but no other CVD risk factors.
HDL-C concentration was significantly higher in women compared with men, regardless of age or SSPG tertile. However, HDL-C was the only CVD risk factor that was marginally higher in older women compared with younger women in SSPG-3 (P = .058). Because the HDL-C concentration was similar between younger men and older men, the difference between older women and men was greater than younger women and men explaining the sex × age interaction for HDL-C (Figure 3C).
There was no significant interaction between sex and age on BP. As reported in Supplemental Table 1, systolic BP was similar between sexes, regardless of age or SSPG. There was a significant sex difference in diastolic BP for older individuals in SSPG-1 and SSPG-3 and younger individuals in SSPG-3. Thus, four of five CVD risk factors were significantly better in younger women than men in SSPG-3, but only HDL-C concentration was higher in younger women in SSPG-1. Older women maintained better diastolic BP and HDL-C concentration compared with older men, regardless of SSPG tertile.
Given the modest differences in the SSPG concentration between sexes in the obese group, we also evaluated the sex differences in CVD risk factors in the subset of obese (BMI ≥ 30 kg/m2) individuals (see Supplemental Table 1). The SSPG concentrations were different between the sexes and age groups. However, a majority of the individuals who were obese (67%) were in SSPG-3; therefore, the differences between the sexes were similar to the results seen for SSPG-3.
Discussion
The female advantage in CVD risk is well established and refers to the approximately 10-year delay in CVD in women compared with men (17). However, the role of insulin resistance in mediating this observation has been unclear. The goal of our study was to examine two possible mechanisms by which differences in insulin resistance might contribute to the female advantage. The first possibility was that sex differences in the degree of insulin resistance exist, a formulation that is less supported by our data. Alternatively, the magnitude of the untoward changes in CVD risk related to insulin resistance could be attenuated in women. We believe our data support this latter possibility and, as such, contribute to the female advantage.
Previous studies that have evaluated sex differences in insulin action have been inconsistent. Some have suggested women are less insulin resistant (3, 6–9), whereas others have reported no difference between women and men (10, 11). Although studies have varied in the population characteristics and measures used to assess insulin resistance, differences among these studies may relate to sample size. Those that have reported significant sex differences in insulin resistance studied fewer individuals with three of five studies including less than 25 women and men (6–8). In contrast, the two largest published studies included 380 Danish (11) and 1146 European women and men [in the European Group for the Study of Insulin Resistance (EGIR)] (10). Neither of these larger studies found a difference in insulin resistance between sexes, consistent with our study of 822 individuals.
On the other hand, although SSPG concentrations did not differ in the men and women when the entire population was considered, SSPG concentrations were significantly lower in obese women of both age groups compared with the men. This finding is in contrast to the EGIR study, which did not find differences in insulin resistance between obese women and men (10). However, the investigators defined obesity as a BMI of 25 kg/m2 or greater. In the Danish study, most of their study population had a BMI of less than 30 kg/m2, and they did not report sex differences by BMI (11). Similar to these two previous studies, the SSPG concentration was similar between normal and overweight women and men; however, because we found that obese women, defined by having a BMI of 30 kg/m2 or greater, had modestly lower SSPG concentration compared with men; thus, obese women may be less insulin resistant compared with equally obese men.
Although the lower SSPG concentration at a higher BMI may confer advantage to women, sex differences in CVD risk factors were not explained by absolute differences in SSPG concentration. As seen in Figure 2, even when matched for the SSPG tertile, younger women tended to have the most favorable CVD risk factors compared with the other three subject groups. This advantage was not explained by differences in insulin resistance but accentuated by the degree of insulin resistance. The benefit of being a younger woman was most striking for fasting glucose and triglyceride concentration. As seen in Figure 3, A and B, younger women who were in the most insulin-resistant tertile had significantly lower fasting glucose and triglyceride concentration compared with equally insulin-resistant younger men. These differences were made more prominent, given that older women and men had similar values. In fact, younger women in SSPG-3 were the only group to have mean fasting glucose below the prediabetes cut point (100 mg/dL) and triglyceride concentration below the cut point to define hypertriglyceridemia (150 mg/dL) (18). Lastly, it is worth highlighting that four of five CVD risk factors were more favorable in younger women than men in SSPG-3, but only HDL-C concentration was higher in younger women in SSPG-1. Thus, although the higher degree of insulin resistance can accentuate the female advantage, improving insulin resistance can equalize the CVD disparity between sexes.
Because past studies have mainly focused on select age groups, the differences in the relationship between insulin resistance and CVD risk factors in younger and older age groups have not been well studied. Manco et al (12) evaluated a subset of individuals in the EGIR population and compared premenopausal and postmenopausal women and age-matched men. They found that insulin resistance as measured by the hyperinsulinemic euglycemic clamp was poorly associated with a composite CVD risk score in both premenopausal and postmenopausal women compared with men. In the current study, although the relationship between SSPG concentration and CVD risk was attenuated in younger women, we found that the SSPG concentration was a significant predictor of all CVD risk factors in all groups. The difference between the two studies may relate to the study populations. The inclusion criteria for the EGIR study were highly restrictive; their population had a mean BMI generally in the normal-weight category and likely had less metabolic abnormalities compared with our study population. In fact, in the EGIR cohort, insulin resistance was not associated with BP or HDL-C, even in men. Therefore, their study findings may be less generalizable.
There are some limitations to our study. First, we did not have menopausal status; therefore, we cannot discuss differential impact of menopause status vs aging per se. However, the age used to separate younger and older groups was 51 years, which is the median age for menopause (19). Therefore, the better CVD risk factors in younger women may relate to menopause status. Second, we used BMI as a gauge of adiposity as opposed to other surrogates, which have been suggested to be more closely associated with insulin resistance, especially visceral adiposity (20). Although BMI is significantly correlated with both visceral and sc adipose tissue in both sexes, women are well known to have less visceral fat and more sc fat compared with men (20, 21). This difference may explain why our obese women were less insulin resistant than obese men. Whether changes in fat distribution with aging explains the CVD disparity between younger and older women are not currently clear (22). Lastly, we were able to evaluate only CVD risk factor and not macrovascular or microvascular coronary disease burden; the latter may preferential affect women and have an association with insulin resistance (23).
Many studies have shown the disparities in CVD risk factors between sexes (2–4). However, the role of insulin resistance in explaining this disparity has been unclear. In that context, our results demonstrate in a large population, using direct measurement of insulin resistance, that there were no general differences in insulin resistance between younger women and men. However, despite this similarity in insulin resistance, the CVD risk profile was significantly less adverse in the women. Thus, the clinical impact of insulin resistance was attenuated in younger women compared with men, and this disparity may help explain why the female advantage exists.
Acknowledgments
The Stanford Clinical and Translational Research Unit is supported by the National Institutes of Health's Clinical and Translational Science Award.
Disclosure Summary: The authors have nothing to disclose.
Footnotes
- BMI
- body mass index
- BP
- blood pressure
- CVD
- cardiovascular disease
- EGIR
- European Group for the Study of Insulin Resistance
- HDL-C
- high-density lipoprotein cholesterol
- SSPG
- steady-state plasma glucose.
References
- 1. Barrett-Connor EL, Cohn BA, Wingard DL, Edelstein SL. Why is diabetes mellitus a stronger risk factor for fatal ischemic heart disease in women than in men? The Rancho Bernardo Study. JAMA. 1991;265:627–631 [PubMed] [Google Scholar]
- 2. Ervin RB. Prevalence of metabolic syndrome among adults 20 years of age and over, by sex, age, race and ethnicity, and body mass index: United States, 2003–2006. Natl Health Stat Rep. 2009:1–7 [PubMed] [Google Scholar]
- 3. Moran A, Jacobs DR, Jr, Steinberger J, et al. Changes in insulin resistance and cardiovascular risk during adolescence: establishment of differential risk in males and females. Circulation. 2008;117:2361–2368 [DOI] [PubMed] [Google Scholar]
- 4. Willeit J, Kiechl S, Egger G, et al. The role of insulin in age-related sex differences of cardiovascular risk profile and morbidity. Atherosclerosis. 1997;130:183–189 [DOI] [PubMed] [Google Scholar]
- 5. Reaven GM. Banting lecture 1988. Role of insulin resistance in human disease. Diabetes. 1988;37:1595–1607 [DOI] [PubMed] [Google Scholar]
- 6. Yki-Jarvinen H. Sex and insulin sensitivity. Metabolism. 1984;33:1011–1015 [DOI] [PubMed] [Google Scholar]
- 7. Nuutila P, Knuuti MJ, Mäki M, et al. Gender and insulin sensitivity in the heart and in skeletal muscles. Studies using positron emission tomography. Diabetes. 1995;44:31–36 [DOI] [PubMed] [Google Scholar]
- 8. Ferrara CM, Goldberg AP, Nicklas BJ, Sorkin JD, Ryan AS. Sex differences in insulin action and body fat distribution in overweight and obese middle-aged and older men and women. Appl Physiol Nutr Metab. 2008;33:784–790 [DOI] [PMC free article] [PubMed] [Google Scholar]
- 9. Cnop M, Havel PJ, Utzschneider KM, et al. Relationship of adiponectin to body fat distribution, insulin sensitivity and plasma lipoproteins: evidence for independent roles of age and sex. Diabetologia. 2003;46:459–469 [DOI] [PubMed] [Google Scholar]
- 10. Ferrannini E, Natali A, Bell P, Cavallo-Perin P, Lalic N, Mingrone G. Insulin resistance and hypersecretion in obesity. European Group for the Study of Insulin Resistance (EGIR). J Clin Invest. 1997;100:1166–1173 [DOI] [PMC free article] [PubMed] [Google Scholar]
- 11. Clausen JO, Borch-Johnsen K, Ibsen H, et al. Insulin sensitivity index, acute insulin response, and glucose effectiveness in a population-based sample of 380 young healthy Caucasians. Analysis of the impact of gender, body fat, physical fitness, and life-style factors. J Clin Invest. 1996;98:1195–1209 [DOI] [PMC free article] [PubMed] [Google Scholar]
- 12. Manco M, Nolfe G, Calvani M, et al. Menopause, insulin resistance, and risk factors for cardiovascular disease. Menopause. 2006;13:809–817 [DOI] [PubMed] [Google Scholar]
- 13. Farin HM, Abbasi F, Reaven GM. Body mass index and waist circumference both contribute to differences in insulin-mediated glucose disposal in nondiabetic adults. Am J Clin Nutr. 2006;83:47–51 [DOI] [PubMed] [Google Scholar]
- 14. Pei D, Jones CN, Bhargava R, Chen YD, Reaven GM. Evaluation of octreotide to assess insulin-mediated glucose disposal by the insulin suppression test. Diabetologia. 1994;37:843–845 [DOI] [PubMed] [Google Scholar]
- 15. Greenfield MS, Doberne L, Kraemer F, Tobey T, Reaven G. Assessment of insulin resistance with the insulin suppression test and the euglycemic clamp. Diabetes. 1981;30:387–392 [DOI] [PubMed] [Google Scholar]
- 16. Knowles JW, Assimes TL, Tsao PS, et al. Measurement of insulin-mediated glucose uptake: direct comparison of the modified insulin suppression test and the euglycemic, hyperinsulinemic clamp. Metabolism. 2013;62(4):548–553 [DOI] [PMC free article] [PubMed] [Google Scholar]
- 17. Lerner DJ, Kannel WB. Patterns of coronary heart disease morbidity and mortality in the sexes: a 26-year follow-up of the Framingham population. Am Heart J. 1986;111:383–390 [DOI] [PubMed] [Google Scholar]
- 18. Berglund L, Brunzell JD, Goldberg AC, et al. Evaluation and treatment of hypertriglyceridemia: an Endocrine Society clinical practice guideline. J Clin Endocrinol Metab. 2012;97:2969–2989 [DOI] [PMC free article] [PubMed] [Google Scholar]
- 19. Kato I, Toniolo P, Akhmedkhanov A, Koenig KL, Shore R, Zeleniuch-Jacquotte A. Prospective study of factors influencing the onset of natural menopause. J Clin Epidemiol. 1998;51:1271–1276 [DOI] [PubMed] [Google Scholar]
- 20. McLaughlin T, Lamendola C, Liu A, Abbasi F. Preferential fat deposition in subcutaneous versus visceral depots is associated with insulin sensitivity. J Clin Endocrinol Metab. 2011;96:E1756–E1760 [DOI] [PMC free article] [PubMed] [Google Scholar]
- 21. Enzi G, Gasparo M, Biondetti PR, Fiore D, Semisa M, Zurlo F. Subcutaneous and visceral fat distribution according to sex, age, and overweight, evaluated by computed tomography. Am J Clin Nutr. 1986;44:739–746 [DOI] [PubMed] [Google Scholar]
- 22. Abdulnour J, Doucet E, Brochu M, et al. The effect of the menopausal transition on body composition and cardiometabolic risk factors: a Montreal-Ottawa New Emerging Team group study. Menopause. 2012;19:760–767 [DOI] [PubMed] [Google Scholar]
- 23. Banks K, Lo M, Khera A. Angina in women without obstructive coronary artery disease. Curr Cardiol Rev. 2010;6:71–81 [DOI] [PMC free article] [PubMed] [Google Scholar]