

Abstract
Relationships between some risk factors and breast cancer incidence are known to vary by tumor subtype. However, breast tumors can be classified according to a number of markers, which may be correlated, making it difficult to identify heterogeneity of risk factors with specific tumor markers when using standard competing-risk survival analysis. In this paper, we propose a constrained competing-risk survival model that allows for assessment of heterogeneity of risk factor associations according to specific tumor markers while controlling for other markers. These methods are applied to Nurses’ Health Study data from 1980–2006, during which 3,398 incident invasive breast cancers occurred over 1.4 million person-years of follow-up. Results suggested that when estrogen receptor (ER) and progesterone receptor (PR) status are mutually considered, some risk factors thought to be characteristic of “estrogen-positive tumors,” such as high body mass index during postmenopause and increased height, are actually significantly associated with PR-positive tumors but not ER-positive tumors, while other risk factors thought to be characteristic of “estrogen-negative tumors,” such as late age at first birth, are actually significantly associated with PR-negative rather than ER-negative breast cancer. This approach provides a strategy for evaluating heterogeneity of risk factor associations by tumor marker levels while controlling for additional tumor markers.
Keywords: breast cancer, competing risks, proportional hazards model
Risk factors for the development of breast cancer have been integrated into risk models for breast cancer incidence (1). However, previous studies have shown that risk profiles vary according to breast cancer tumor markers (2–4). For example, pregnancy is generally protective against estrogen receptor-positive (ER+) breast cancer, while it is either unrelated to or deleterious for estrogen receptor-negative (ER−) breast cancer (5).
However, the number of breast tumor markers has increased, and some are intercorrelated. Hence, it becomes more difficult to assess the effects of risk factors according to specific tumor markers without also considering other markers. One approach is to stratify the data according to several tumor markers simultaneously (e.g., luminal A breast cancer, luminal B breast cancer) (3, 6). However, stratification becomes impractical with many tumor markers because of small numbers of cases in individual strata, and it does not achieve the goal of assessing risk factors associated with specific markers. Thus, in this paper we propose a regression approach for assessing interaction effects of risk factors with specific tumor markers, controlling for levels of other tumor markers.
MATERIALS AND METHODS
Procedures and model
The Nurses’ Health Study cohort was established in 1976 when 121,701 female US registered nurses aged 30–55 years responded to a mailed questionnaire inquiring about risk factors for breast cancer, including reproductive factors, hormone use, anthropometric variables, benign breast disease, and family history of breast cancer. The risk factor data have been updated by means of repeat questionnaires sent every 2 years up to the present time (7). Alcohol consumption, both current and at age 18 years, was ascertained in 1980, with information updated in 1984 and then every 4 years from 1986 to 2006.
Identification of breast cancer cases
On each questionnaire, women were asked whether breast cancer had been diagnosed and, if so, the date of diagnosis. All women (or their next of kin, if deceased) were contacted for permission to review their medical records so as to confirm the diagnosis. Pathology reports were also reviewed to obtain information on estrogen receptor (ER), progesterone receptor (PR), and human epidermal growth factor receptor 2 (HER2) status and tumor size. Cases of invasive breast cancer from 1980 to 2006 for which we had a pathology report were included in these analyses. A total of 964 breast cancer cases with missing data on ER and/or PR status were censored at the time of diagnosis. In addition, we excluded women with types of menopause other than natural menopause or bilateral oophorectomy, prevalent cancer (other than nonmelanoma skin cancer) in 1980, or missing data for weight at age 18 years, age at first birth, parity, age at menarche, age at menopause, or hormone use. Thus, overall, 77,232 women were followed over 1,470,730 person-years from 1980 to 2006, during which 3,398 incident cases of invasive breast cancer occurred. Information on ER and PR status was obtained from pathology reports and medical records. For tumors diagnosed before 2000 with available tumor blocks, HER2 status was determined through immunohistochemical staining performed on paraffin sections of tumor tissue microarrays according to a standard protocol, because HER2 was not routinely assessed in clinical practice during these years. Detailed descriptions of tumor tissue microarray construction and ER, PR, and HER2 immunohistochemical staining have been published previously (3). After 2000, information on HER2 status was obtained from pathology and medical reports, where HER2 was generally determined by immunohistochemical staining with a subgroup also having fluorescence in situ hybridization (FISH). A total of 2,125 ER+/PR-positive (PR+) tumors, 627 ER−/PR-negative (PR−) tumors, 540 ER+/PR− tumors, and 106 ER−/PR+ tumors were identified among women with complete information on breast cancer risk factors. Women with ER−/PR+ breast cancer were considered to be missing data on ER/PR status, because in a subset of 71 women initially classified as ER−/PR+ with ER/PR status also determined by tumor tissue microarray, only 4 (6%) were confirmed as ER−/PR+. Thus, the analyses presented in this paper were based on 3,292 ER+/PR+, ER−/PR−, or ER+/PR− cases identified from 1980 to 2006. The proportion of ER–/PR+ tumors in this data set (3%) is comparable to that reported in previous studies (e.g., 4% in the study by Yang et al. (4)).
Statistical methods
The log-incidence model of breast cancer
We assume that the incidence of breast cancer at time t (It) is proportional to the number of cell divisions (Ct) accumulated throughout life up to age t (i.e., It = kCt). Ct is obtained from
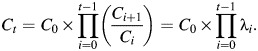 |
(1) |
Thus, λi = Ci+1/Ci = the rate of increase in Ct from age i to age i +1. Log(λi) is assumed to be a linear function of risk factors that are relevant at age i. The set of relevant risk factors and their magnitude and/or direction may vary according to the stage of reproductive life. Since the complete set of relevant risk factors at time t is unknown, we generalize equation 1 by substituting h0(t) for k, which allows for the existence of other risk factors which accumulate over time. The overall Cox regression model is given by
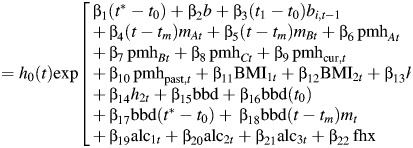 |
(2) |
where t = age,  t0 = age at menarche, t1 = age at first birth, tm = age at menopause, t* = min(age, age at menopause), and mt = 1 if postmenopausal at age t, 0 otherwise.
where bit = 1 if parity ≥ i at age t, 0 otherwise; ti = age at ith birth, i = 1, …, st; st = parity at age t; mAt = 1 if natural menopause at age t, 0 otherwise; mBt = 1 if bilateral oophorectomy at age t, 0 otherwise; pmhAt = duration of oral estrogen use (years) at age t; pmhBt = duration of oral estrogen and progesterone use (in years) at age t; pmhCt = duration of use of other types of postmenopausal hormones at age t; pmhcur,t = 1 if a current postmenopausal hormone user at age t, 0 otherwise; and pmhpast,t = 1 if a past postmenopausal hormone user at age t, 0 otherwise.
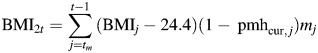
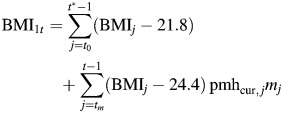 |
equals the effect of body mass index (BMI; weight (kg)/height (m)2) during either premenopause or postmenopause, while “on pmh” ≡ effect of BMI during estrogen-positive person-time.
 |
equals the effect of BMI during postmenopause, while “not on pmh” ≡ effect of BMI during estrogen-negative person-time.
Other terms are defined as follows.
 effect of height during estrogen-positive person-time.
 effect of height during estrogen-negative person-time.
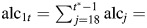 effect of alcohol consumption during premenopause.
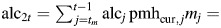 effect of alcohol consumption during postmenopause while on postmenopausal hormones.
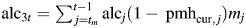 effect of alcohol consumption during postmenopause while not on postmenopausal hormones.
bbd = benign breast disease.
fhx = family history of breast cancer in a mother or sister.
Further details concerning the log-incidence model have been provided previously (1, 5).
Competing risks
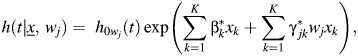
Some risk factor associations vary according to the type of breast cancer. A natural extension of equation 2 described by Lunn and McNeil (8) stratifies by event type, allows for estimates of the separate associations of each risk factor with each event type, and can be implemented with standard software (e.g., PROC PHREG in SAS (SAS Institute, Inc., Cary, North Carolina)) using data augmentation. If there are L event types, then one creates L records for each subject in each time period (defined by questionnaire cycle), and a subject is censored after a first diagnosis of breast cancer. The hazard for a woman with tumor type l relative to no breast cancer is given by
| (3) |
The Lunn and McNeil approach (8) allows some risk factors to have the same regression coefficient for different tumor types, while other risk factors can have different regression coefficients. A test of the hypothesis H0: β1k = … = βLk versus H1: at least some βlk are different is performed using a likelihood ratio test (9). In addition, tests can be performed to assess whether specific risk factors are associated with specific breast cancer tumor types, that is, H0: βlk = 0 versus H1: βlk ≠0.
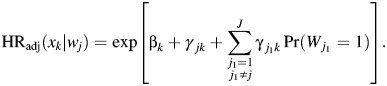
However, if L is large, then the number of cases with a specific tumor type may be small and statistical power will be limited. Alternatively, we can generalize equation 3 by specifying
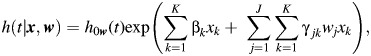 |
(4) |
where xk = kth risk factor and wj = score for the jth tumor marker.
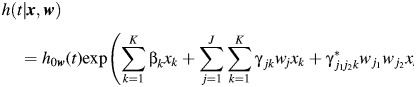
In equation 4, exp(βk) = hazard ratio for a 1-unit increase in the kth risk factor for tumor type w = 0; h0w(t) = baseline hazard for breast cancer with tumor type = w; and 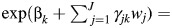 hazard ratio for a 1-unit increase in the kth risk factor for tumor type = w.
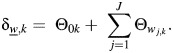
Thus, γjk is the ratio of hazard ratios for the kth risk factor when the jth tumor marker increases by 1 unit (e.g., from ER− to ER+), holding the levels of other risk factors and tumor markers constant. To assess whether the hazard ratio associated with the kth risk factor is modified by the score for the jth tumor marker, we perform the hypothesis test H0: γjk = 0 versus H1: γjk ≠ 0.
We can also consider interactions between the  th and
  th tumor markers by enhancing equation 4 as follows:
 |
(5) |
The coefficient  represents effect modification of the hazard associated with the kth risk factor by a combination of the
  th and
  th tumor markers.
To implement the approach shown in equation 4, we cross-classify the tumor markers according to the levels of the J tumor markers. For binary tumor markers, wj denotes the presence (1) or absence (0) of the jth tumor marker. For continuous tumor markers—for example, the percentage of cells staining positive (0%–100%)—we create categories (e.g., 0%–20%, 21%–40%, … , 81%–100%) and define wj as the median score within a category. If C equals the number of unique categories of tumor markers in the data set, then we can fit equation 4 or 5 by including C records for each subject. A subject with no breast cancer would be censored for each of the C event types. A subject with breast cancer of tumor type w would be coded as a failure for that event type and censored for all other event types. An example of the coding employed in the case of 2 binary tumor markers (ER/PR) and 2 covariates (age and parity) using SAS PROC PHREG is given in Web Appendix 1 (available at http://aje.oxfordjournals.org/).
Missing tumor markers
We also have available information on other tumor markers, but this information is not as complete as that on ER/PR status. For example, HER2 status is often used to identify tumor subtypes (e.g., triple-negative breast cancer = ER−/PR−/HER2−). It is important to assess the marginal effects of HER2 status, as well as 2-way interactions of HER2 status with each of ER and PR. However, HER2 information is currently available for only 1,395 (42%) of the 3,292 cases in the Nurses’ Health Study. We could perform a “complete case analysis” based on the 1,395 tumors using equations 4 and 5; however, we will lose power. Instead, we will use the missing indicator method (10) to assess tumor markers with missing values.
Adjusted hazard ratios
The parameter γjk in equation 4 is a measure of heterogeneity of the effect of the kth risk factor by the jth tumor marker. We can also use equation 4 to estimate the adjusted hazard ratio (HR) for a 1-unit increase in the kth risk factor (xk) at level wj of the jth tumor marker, defined by
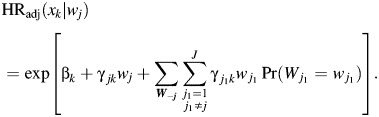 |
(6) |
If all tumor markers are binary and there are no missing data, equation 6 can be written as
 |
(7) |
If there are missing values for a particular tumor marker, then an extra binary variable is added to equation 6 or 7 to indicate missingness for that tumor marker.
The adjusted hazard ratio in equation 6 can be compared with the unadjusted hazard ratio obtained by considering each tumor marker separately, by specifying
 |
(8) |
whereby
| 9 |
If tumor markers are correlated, differences between adjusted and unadjusted hazard ratios may be large.
Estimation of hazard ratios for time-varying exposure variables
In the model presented in equations 1 and 2, specific exposures may change in magnitude over time. Furthermore, breast cancer may be associated with the cumulative effects of a risk factor, and the direction of association may change over time. Hence, to estimate hazard ratios associated with a risk factor, we compare individual risk profiles over time, rather than risk levels at a specific point in time. For example, high BMI is generally protective before menopause and deleterious after menopause.
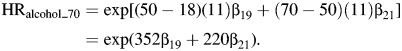
In this paper, to represent parameter estimates in terms of hazard ratios, we consider women with age at menarche of 13 years and age at natural menopause of 50 years. To depict the relationship of BMI to breast cancer, we consider 2 hypothetical women, A and B, in the risk set for breast cancer at time t with average BMIs of 22 and 30, respectively, from age at menarche up to age t. The relationship between BMI before menopause and breast cancer incidence is estimated by means of the hazard ratio for BMI at age 50 years, where risk is accumulated from age 13 to age 50 (a period of 37 years). Thus,
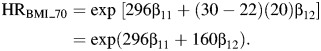
Similarly, the relationship between BMI after menopause and breast cancer incidence is estimated by means of the hazard ratio for BMI at age 70 years (assuming no use of hormone therapy from age 50 to age 70), which represents an inverse association between BMI before menopause (ages 13–50 years) and breast cancer incidence and a positive association between BMI after menopause (ages 50–70 years; i.e., a period of 20 years) and breast cancer incidence, whereby
 |
A similar approach is used for height (comparing women who differ in height by 6 inches (15 cm)). Hence,
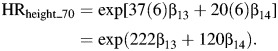 |
A similar approach is used for alcohol consumption, comparing women who differ by 1 drink (11 g of alcohol) per day, starting at age 18 years, whereby
 |
Furthermore, the associations between breast cancer incidence and benign breast disease (BBD) at ages 50 and 70 years, respectively, are given by
Finally, for hormone therapy (HT), we compare a 60-year-old woman with 10 years of use (ages 50–60 years) with a 60-year-old never user and derive separate estimates for current and past users (assuming that past users quit just prior to age 60 years). Thus,
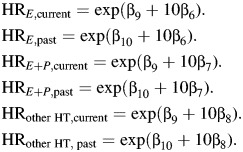 |
RESULTS
We first fit separate Cox proportional hazards models for each ER/PR case type (e.g., ER+/PR+), where women who experience another type of breast cancer are censored at diagnosis (see Table 1 and Web Table 1). We see that increases in incidence with age, characterized by the duration-of-premenopause and duration-of-menopause terms, are higher for ER+/PR+ breast cancer than for ER−/PR− breast cancer. Regarding pregnancy history, the protective effect of pregnancy, characterized by the birth index, is significant for ER+/PR+ breast cancer (HR = 0.69, P < 0.001) but not for ER−/PR− breast cancer (HR = 1.02, P = 0.88). Conversely, the time between age at menarche and age at first birth (denoted “gynecological age at first birth”) is borderline-significant for ER−/PR− breast cancer (HR = 1.48, P = 0.051) but not for ER+/PR+ breast cancer (HR = 0.93, P = 0.48). Hence, pregnancy is inversely associated with ER+/PR+ breast cancer but positively associated with ER−/PR− breast cancer. For use of hormone therapy, current long-term estrogen use is positively associated with incidence of ER+/PR+ breast cancer (HR = 1.68, P < 0.001) but not ER−/PR− breast cancer (HR = 1.17, P = 0.29); current long-term use of estrogen and progesterone is positively associated with both ER+/PR+ (HR = 2.50, P < 0.001) and ER−/PR− (HR = 1.48, P = 0.021) breast cancer, but the association is stronger for the former. Similarly, increased BMI postmenopause is positively associated with ER+/PR+ breast cancer (HR = 1.78, P < 0.001) but not with ER−/PR− breast cancer (HR = 0.81, P = 0.16). However, BMI before menopause is inversely associated with both ER+/PR+ (HR = 0.84, P = 0.006) and ER−/PR− (HR = 0.78, P = 0.042) breast cancer. Height is positively associated with ER+/PR+ breast cancer, but results are inconsistent for ER−/PR− breast cancer. Finally, benign breast disease, alcohol consumption, and family history of breast cancer are positively associated with both ER+/PR+ and ER−/PR− breast cancer. Covariate relationships for ER+/PR− breast cancer are usually intermediate between relationships for ER+/PR+ and ER−/PR− breast cancer.
Table 1.
Relationship Between Breast Cancer Risk Factors and Breast Cancer According to ER/PR Subtype, Nurses’ Health Study, 1980–2006
| Variable | Incrementa | ER+/PR+ (n = 2,125) |
ER+/PR− (n = 540) |
ER−/PR− (n = 627) |
P for Heterogeneityb | ||||||
|---|---|---|---|---|---|---|---|---|---|---|---|
| HR | 95% CI | P Value | HR | 95% CI | P Value | HR | 95% CI | P Value | |||
| Duration of premenopause, years | 1 | 1.10 | 1.08, 1.11 | <0.001 | 1.10 | 1.07, 1.13 | <0.001 | 1.04 | 1.02, 1.07 | <0.001 | 0.002 |
| Duration of menopause, years | |||||||||||
| Natural menopause | 1 | 1.04 | 1.03, 1.05 | <0.001 | 1.04 | 1.03, 1.06 | <0.001 | 1.02 | 1.01, 1.04 | 0.004 | 0.14 |
| Bilateral oophorectomy | 1 | 1.03 | 1.02, 1.04 | <0.001 | 1.03 | 1.01, 1.06 | 0.003 | 1.03 | 1.01, 1.05 | 0.007 | 0.90 |
| Pregnancy history | |||||||||||
| Gynecological age at first birth,c years | 22 | 0.93 | 0.77, 1.13 | 0.48 | 1.59 | 1.07, 2.35 | 0.020 | 1.48 | 1.00, 2.19 | 0.051 | 0.015 |
| Birth index | 102 | 0.69 | 0.61, 0.79 | <0.001 | 0.72 | 0.55, 0.94 | 0.017 | 1.02 | 0.79, 1.31 | 0.88 | 0.026 |
| Benign breast disease (present vs. absent) | |||||||||||
| Age 50 years | 1 | 1.91 | 1.78, 2.06 | <0.001 | 1.87 | 1.40, 2.50 | <0.001 | 1.54 | 1.21, 1.98 | <0.001 | 0.33 |
| Age 70 years | 1 | 1.20 | 1.13, 1.28 | 0.003 | 1.42 | 1.13, 1.79 | 0.003 | 1.47 | 1.17, 1.86 | 0.001 | 0.19 |
| Use of hormone therapy, years | |||||||||||
| Oral estrogen | |||||||||||
| Current user | 10 | 1.68 | 1.44, 1.95 | <0.001 | 1.58 | 1.17, 2.14 | 0.003 | 1.17 | 0.87, 1.56 | 0.29 | 0.095 |
| Past user | 10 | 1.04 | 0.87, 1.25 | 0.66 | 1.18 | 0.83, 1.68 | 0.35 | 0.83 | 0.58, 1.17 | 0.28 | 0.34 |
| Oral estrogen and progesterone | |||||||||||
| Current user | 10 | 2.50 | 2.13, 2.92 | <0.001 | 1.66 | 1.19, 2.32 | 0.003 | 1.48 | 1.06, 2.08 | 0.021 | 0.005 |
| Past user | 10 | 1.55 | 1.28, 1.87 | <0.001 | 1.24 | 0.84, 1.82 | 0.27 | 1.05 | 0.71, 1.55 | 0.82 | 0.16 |
| Other types of hormones | |||||||||||
| Current user | 10 | 1.73 | 1.46, 2.05 | <0.001 | 1.29 | 0.91, 1.83 | 0.16 | 1.27 | 0.92, 1.76 | 0.15 | 0.13 |
| Past user | 10 | 1.07 | 0.88, 1.31 | 0.48 | 0.96 | 0.65, 1.43 | 0.84 | 0.90 | 0.62, 1.31 | 0.57 | 0.67 |
| BMId | |||||||||||
| Age 50 years | 8 | 0.84 | 0.75, 0.95 | 0.006 | 0.61 | 0.46, 0.79 | <0.001 | 0.78 | 0.61, 0.99 | 0.042 | 0.092 |
| Age 70 years | 8 | 1.78 | 1.54, 2.06 | <0.001 | 0.77 | 0.57, 1.03 | 0.076 | 0.81 | 0.61, 1.09 | 0.16 | <0.001 |
| Height, inches | |||||||||||
| Age 50 years | 6 | 1.27 | 1.13, 1.43 | <0.001 | 1.02 | 0.80, 1.31 | 0.87 | 0.96 | 0.76, 1.20 | 0.70 | 0.050 |
| Age 70 years | 6 | 1.25 | 1.02, 1.53 | 0.029 | 0.91 | 0.62, 1.34 | 0.64 | 1.48 | 1.02, 2.14 | 0.040 | 0.19 |
| Alcohol, g | |||||||||||
| Age 50 years | 11 | 1.18 | 1.09, 1.28 | <0.001 | 1.22 | 1.04, 1.43 | 0.014 | 1.17 | 0.99, 1.37 | 0.064 | 0.91 |
| Age 70 years | 11 | 1.28 | 1.16, 1.41 | <0.001 | 1.26 | 1.05, 1.51 | 0.012 | 1.14 | 0.94, 1.39 | 0.17 | 0.60 |
| Family history of breast cancer in a first-degree relative (present vs. absent) | 1 | 1.51 | 1.35, 1.69 | <0.001 | 1.66 | 1.34, 2.05 | <0.001 | 1.47 | 1.19, 1.82 | <0.001 | 0.70 |
Abbreviations: BMI, body mass index; CI, confidence interval; ER, estrogen receptor; HR, hazard ratio; PR, progesterone receptor.
a Increments: for duration of premenopause and duration of menopause, 1 year; for gynecological age at first birth (age at first birth minus age at menarche), 22 years (age 35 – age 13) versus nulliparous; for birth index, 102 (4 births at ages 20, 23, 26, and 29 years) versus nulliparous; for benign breast disease and family history, present versus absent; for hormone therapy, 10 years of use versus no use; for BMI, 8 units (BMI of 30 vs. BMI of 22); for height, a difference of 6 inches (15 cm) (5′10″ (178 cm) vs. 5′4″ (163 cm)); and for alcohol consumption, 11 g (1 drink per day vs. none, starting at age 18 years). All comparisons assumed that age at menarche was 13 years and age at natural menopause was 50 years; the hazard ratios for BMI, height, and alcohol consumption assumed no use of hormone therapy. Increments used for BMI and height represent the range of values from the 10th percentile to the 90th percentile for these variables.
b P for heterogeneity over the 3 ER/PR subtypes (2 df), obtained using the Lunn and McNeil (8) approach (equation 3).
c Age at first birth minus age at menarche.
d Weight (kg)/height (m)2.
The marginal and joint distributions of tumor markers are given in Tables 2 and 3, respectively. A total of 2,665 (81%) of the tumors were ER+ and 2,125 (65%) were PR+, and 224 of the 1,395 (16%) tumors for which HER2 status was known were HER2+.
Table 2.
Marginal Distribution of ER, PR, and HER2 Status Among Participants (n = 3,292 Cases), Nurses’ Health Study, 1980–2006
| ER |
PR |
HER2 |
|||||||
|---|---|---|---|---|---|---|---|---|---|
| Status | No. | % | Status | No. | % | Statusa | HER2_missb | No. | %c |
| + | 2,665 | 81 | + | 2,125 | 65 | + | No | 224 | 16 |
| − | 627 | 19 | − | 1,167 | 35 | − | No | 1,171 | 84 |
Abbreviations: ER, estrogen receptor; HER2, human epidermal growth factor receptor 2; PR, progesterone receptor.
a HER2 status was coded as negative if HER2_miss status was positive.
b HER2_miss was coded as yes if information on HER2 status was missing, and no otherwise.
c Among cases where HER2 status was known.
Table 3.
Joint Distribution of ER, PR, and HER2 Status Among Participants (n = 3,292 Cases), Nurses’ Health Study, 1980–2006
| ER Status | PR Status | HER2 Statusa | HER2_missb | No. of Women | % |
|---|---|---|---|---|---|
| + | + | + | No | 99 | 3 |
| + | + | − | No | 785 | 24 |
| + | + | − | Yes | 1,241 | 38 |
| + | − | + | No | 45 | 1 |
| + | − | − | No | 181 | 5 |
| + | − | − | Yes | 314 | 10 |
| − | − | + | No | 80 | 2 |
| − | − | − | No | 205 | 6 |
| − | − | − | Yes | 342 | 10 |
Abbreviations: ER, estrogen receptor; HER2, human epidermal growth factor receptor 2; PR, progesterone receptor.
a HER2 status was coded as negative if HER2_miss status was positive.
b HER2_miss was coded as yes if information on HER2 status was missing, and no otherwise.
Identifying effects of covariate interactions with specific tumor characteristics
We now consider each tumor marker separately and estimate the unadjusted hazard ratio in equation 9 (see Table 4). For ER, there was significant heterogeneity for duration of premenopause (P < 0.001), the birth index (P = 0.007), current use of estrogen and of estrogen and progesterone (P = 0.033 and P = 0.018, respectively), and BMI after menopause (P = 0.002). For PR, there was significant heterogeneity for duration of premenopause (P = 0.035), gynecological age at first birth (P = 0.004), current use of estrogen and progesterone (P < 0.001), use of other types of hormone therapy (P = 0.036), BMI after menopause (P < 0.001), and premenopausal height (P = 0.015). For HER2 status, there was significant heterogeneity only for time since natural menopause (P = 0.048).
Table 4.
Hazard Ratios for Breast Cancer According to Breast Cancer Risk Factors and ER, PR, and HER2 Subtype, Considered Separately, in a Cox Proportional Hazards Model, Nurses’ Health Study 1980–2006
| Variable | Incrementa | Status | ER |
PR |
HER2 |
||||||
|---|---|---|---|---|---|---|---|---|---|---|---|
| HR | 95% CI | P Value | HR | 95% CI | P Value | HR | 95% CI | P Value | |||
| Duration of premenopause, years | 1 | + | 1.10 | 1.08, 1.11 | <0.001 | 1.10 | 1.08, 1.11 | <0.001 | 1.07 | 1.03, 1.13 | 0.002 |
| − | 1.04 | 1.02, 1.07 | <0.001 | 1.07 | 1.05, 1.09 | <0.001 | 1.09 | 1.07, 1.11 | <0.001 | ||
| Phetb | <0.001 | 0.035 | 0.67 | ||||||||
| Duration of menopause, years | |||||||||||
| Natural menopause | 1 | + | 1.04 | 1.03, 1.05 | <0.001 | 1.04 | 1.03, 1.05 | <0.001 | 1.05 | 1.02, 1.07 | <0.001 |
| − | 1.02 | 1.01, 1.04 | 0.005 | 1.03 | 1.02, 1.04 | <0.001 | 1.02 | 1.01, 1.03 | 0.001 | ||
| Phet | 0.053 | 0.43 | 0.048 | ||||||||
| Bilateral oophorectomy | 1 | + | 1.03 | 1.02, 1.04 | <0.001 | 1.03 | 1.02, 1.04 | <0.001 | 1.04 | 1.01, 1.08 | 0.017 |
| − | 1.03 | 1.01, 1.05 | 0.007 | 1.03 | 1.01, 1.05 | <0.001 | 1.02 | 1.01, 1.04 | 0.006 | ||
| Phet | 0.70 | 0.93 | 0.29 | ||||||||
| Pregnancy history | |||||||||||
| Gynecological age at first birth,c years | 22 | + | 1.04 | 0.87, 1.23 | 0.69 | 0.93 | 0.77, 1.13 | 0.48 | 1.41 | 0.75, 2.67 | 0.29 |
| − | 1.48 | 1.00, 2.19 | 0.051 | 1.53 | 1.16, 2.02 | 0.003 | 1.37 | 1.05, 1.81 | 0.023 | ||
| Phet | 0.10 | 0.004 | 0.94 | ||||||||
| Birth index | 102 | + | 0.70 | 0.62, 0.78 | <0.001 | 0.69 | 0.61, 0.79 | <0.001 | 0.96 | 0.64, 1.43 | 0.83 |
| − | 1.02 | 0.79, 1.31 | 0.87 | 0.87 | 0.72, 1.04 | 0.13 | 0.81 | 0.68, 0.97 | 0.024 | ||
| Phet | 0.007 | 0.053 | 0.46 | ||||||||
| Benign breast disease (present vs. absent) | |||||||||||
| Age 50 years | 1 | + | 1.90 | 1.67, 2.17 | <0.001 | 1.91 | 1.16, 2.21 | <0.001 | 2.24 | 1.41, 3.56 | <0.001 |
| − | 1.54 | 1.21, 1.98 | <0.001 | 1.66 | 1.38, 2.00 | <0.001 | 1.72 | 1.43, 2.06 | <0.001 | ||
| Phet | 0.14 | 0.24 | 0.29 | ||||||||
| Age 70 years | 1 | + | 1.24 | 1.12, 1.38 | <0.001 | 1.20 | 1.07, 1.35 | 0.003 | 1.62 | 1.15, 2.29 | 0.006 |
| − | 1.47 | 1.17, 1.86 | 0.001 | 1.45 | 1.23, 1.70 | <0.001 | 1.20 | 1.02, 1.42 | 0.029 | ||
| Phet | 0.20 | 0.074 | 0.13 | ||||||||
| Use of hormone therapy, years | |||||||||||
| Oral estrogen | |||||||||||
| Current user | 10 | + | 1.65 | 1.44, 1.90 | <0.001 | 1.68 | 1.44, 1.96 | <0.001 | 0.92 | 0.56, 1.50 | 0.73 |
| − | 1.17 | 0.87, 1.56 | 0.30 | 1.33 | 1.08, 1.64 | 0.007 | 1.18 | 0.96, 1.47 | 0.057 | ||
| Phet | 0.033 | 0.082 | 0.35 | ||||||||
| Past user | 10 | + | 1.07 | 0.91, 1.26 | 0.43 | 1.04 | 0.87, 1.25 | 0.66 | 0.89 | 0.51, 1.55 | 0.69 |
| − | 0.83 | 0.58, 1.17 | 0.28 | 0.97 | 0.76, 1.25 | 0.84 | 1.35 | 1.05, 1.72 | 0.017 | ||
| Phet | 0.19 | 0.67 | 0.18 | ||||||||
| Oral estrogen and progesterone | |||||||||||
| Current user | 10 | + | 2.30 | 1.99, 2.65 | <0.001 | 2.49 | 2.13, 2.92 | <0.001 | 1.91 | 1.20, 3.05 | 0.007 |
| − | 1.48 | 1.06, 2.07 | 0.022 | 1.54 | 1.22, 1.95 | <0.001 | 1.76 | 1.40, 2.21 | <0.001 | ||
| Phet | 0.018 | <0.001 | 0.76 | ||||||||
| Past user | 10 | + | 1.48 | 1.25, 1.76 | <0.001 | 1.55 | 1.28, 1.87 | <0.001 | 1.86 | 1.10, 3.13 | 0.020 |
| − | 1.05 | 0.71, 1.55 | 0.82 | 1.12 | 0.85, 1.48 | 0.40 | 2.00 | 1.55, 2.58 | <0.001 | ||
| Phet | 0.11 | 0.059 | 0.80 | ||||||||
| Other types of hormones | |||||||||||
| Current user | 10 | + | 1.63 | 1.40, 1.90 | <0.001 | 1.73 | 1.46, 2.05 | <0.001 | 1.25 | 0.75, 2.07 | 0.39 |
| − | 1.27 | 0.92, 1.76 | 0.15 | 1.27 | 1.00, 1.61 | 0.054 | 1.23 | 0.97, 1.56 | 0.089 | ||
| Phet | 0.17 | 0.036 | 0.96 | ||||||||
| Past user | 10 | + | 1.05 | 0.88, 1.25 | 0.58 | 1.07 | 0.88, 1.31 | 0.48 | 1.22 | 0.70, 2.13 | 0.49 |
| − | 0.90 | 0.62, 1.31 | 0.57 | 0.92 | 0.70, 1.21 | 0.57 | 1.40 | 1.07, 1.82 | 0.013 | ||
| Phet | 0.45 | 0.38 | 0.66 | ||||||||
| BMId | |||||||||||
| Age 50 years | 8 | + | 0.79 | 0.71, 0.89 | <0.001 | 0.84 | 0.75, 0.95 | 0.006 | 0.91 | 0.62, 1.33 | 0.62 |
| − | 0.78 | 0.61, 0.99 | 0.042 | 0.70 | 0.58, 0.83 | <0.001 | 0.78 | 0.66, 0.93 | 0.005 | ||
| Phet | 0.88 | 0.083 | 0.49 | ||||||||
| Age 70 years | 8 | + | 1.32 | 1.17, 1.49 | <0.001 | 1.50 | 1.32, 1.71 | <0.001 | 1.36 | 0.91, 2.02 | 0.13 |
| − | 0.81 | 0.61, 1.09 | 0.16 | 0.79 | 0.64, 0.98 | 0.029 | 1.20 | 0.99, 1.46 | 0.060 | ||
| Phet | 0.002 | <0.001 | 0.59 | ||||||||
| Height, inches | |||||||||||
| Age 50 years | 6 | + | 1.22 | 1.10, 1.36 | <0.001 | 1.27 | 1.13, 1.43 | <0.001 | 0.82 | 0.56, 1.20 | 0.31 |
| − | 0.96 | 0.76, 1.20 | 0.70 | 0.98 | 0.83, 1.17 | 0.86 | 1.19 | 1.01, 1.41 | 0.037 | ||
| Phet | 0.059 | 0.015 | 0.080 | ||||||||
| Age 70 years | 6 | + | 1.17 | 0.98, 1.39 | 0.091 | 1.25 | 1.02, 1.53 | 0.029 | 1.79 | 1.02, 3.12 | 0.041 |
| − | 1.48 | 1.02, 2.14 | 0.040 | 1.16 | 0.89, 1.52 | 0.27 | 1.11 | 0.85, 1.48 | 0.43 | ||
| Phet | 0.26 | 0.67 | 0.14 | ||||||||
| Alcohol consumption, g | |||||||||||
| Age 50 years | 11 | + | 1.19 | 1.10, 1.28 | <0.001 | 1.18 | 1.09, 1.28 | <0.001 | 1.24 | 0.98, 1.57 | 0.078 |
| − | 1.16 | 0.99, 1.37 | 0.065 | 1.19 | 1.06, 1.33 | 0.003 | 1.10 | 0.97, 1.23 | 0.13 | ||
| Phet | 0.83 | 0.90 | 0.36 | ||||||||
| Age 70 years | 11 | + | 1.27 | 1.17, 1.39 | <0.001 | 1.28 | 1.16, 1.41 | <0.001 | 1.26 | 0.95, 1.66 | 0.10 |
| − | 1.14 | 0.94, 1.39 | 0.18 | 1.20 | 1.05, 1.37 | 0.007 | 1.22 | 1.07, 1.39 | 0.003 | ||
| Phet | 0.32 | 0.44 | 0.85 | ||||||||
| Family history of breast cancer in a first-degree relative (present vs. absent) | 1 | + | 1.54 | 1.39, 1.70 | <0.001 | 1.51 | 1.35, 1.69 | <0.001 | 1.81 | 1.32, 2.50 | <0.001 |
| − | 1.47 | 1.19, 1.81 | <0.001 | 1.56 | 1.34, 1.81 | <0.001 | 1.50 | 1.29, 1.74 | <0.001 | ||
| Phet | 0.70 | 0.74 | 0.29 | ||||||||
Abbreviations: BMI, body mass index; CI, confidence interval; ER, estrogen receptor; HER2, Human Epidermal growth factor Receptor 2; HR, hazard ratio; HT, hormone therapy; PR, progesterone receptor.
a Increment: for duration of premenopause and duration of menopause, 1 year; for gynecological age at first birth (age at first birth minus age at menarche), 22 years (age 35 – age 13) versus nulliparous; for birth index, 102 (4 births at ages 20, 23, 26, and 29 years) versus nulliparous; for benign breast disease and family history, present versus absent; for hormone therapy, 10 years of use versus no use; for BMI, 8 units (BMI of 30 vs. BMI of 22); for height, a difference of 6 inches (15 cm) (5′10″ (178 cm) vs. 5′4″ (163 cm)); and for alcohol consumption, 11 g (1 drink per day vs. none, starting at age 18 years). All comparisons assumed that age at menarche was 13 years and age at natural menopause was 50 years; the hazard ratios for BMI, height, and alcohol consumption assumed no use of hormone therapy. Increments used for BMI and height represent the range of values from the 10th percentile to the 90th percentile for these variables.
b P value for heterogeneity comparing positive status with negative status.
c Age at first birth minus age at menarche.
d Weight (kg)/height (m)2.
We then consider the tumor markers simultaneously, using the model shown in equation 4, based on the adjusted hazard ratios in equation 7 (see Table 5). Unlike the unadjusted analyses in Table 4, the only significant heterogeneity observed for ER after controlling for PR and HER2 was for duration of premenopause (P = 0.006), with incidence increasing more rapidly with duration for ER+ breast cancer versus ER− breast cancer. There was also a borderline trend for the birth index, which was inversely associated with ER+ breast cancer (HR = 0.71, P < 0.001) but not ER− breast cancer (HR = 0.99, P = 0.95; P for heterogeneity (Phet) = 0.07). The apparent heterogeneity by ER status for current use of estrogen and use of estrogen and progesterone was no longer significant after adjustment for PR status (P = 0.19 and P = 0.64, respectively).
Table 5.
Hazard Ratios for Breast Cancer According to Breast Cancer Risk Factors and ER, PR, and HER2 Subtype, Adjusted for Other Tumor Markers, in a Cox Proportional Hazards Model, Nurses’ Health Study, 1980–2006
| Variable | Incrementa | Status | ER |
PR |
HER2 |
||||||
|---|---|---|---|---|---|---|---|---|---|---|---|
| HR | 95% CI | P Value | HR | 95% CI | P Value | HR | 95% CI | P Value | |||
| Duration of premenopause, years | 1 | + | 1.10 | 1.08, 1.11 | <0.001 | 1.08 | 1.07, 1.10 | <0.001 | 1.09 | 1.04, 1.14 | <0.001 |
| − | 1.04 | 1.01, 1.07 | 0.018 | 1.09 | 1.06, 1.12 | <0.001 | 1.09 | 1.07, 1.11 | <0.001 | ||
| Phetb | 0.006 | 0.72 | 0.95 | ||||||||
| Duration of menopause, years | |||||||||||
| Natural menopause | 1 | + | 1.04 | 1.03, 1.05 | <0.001 | 1.03 | 1.02, 1.04 | <0.001 | 1.05 | 1.02, 1.08 | <0.001 |
| − | 1.02 | 1.00, 1.04 | 0.073 | 1.04 | 1.02, 1.05 | <0.001 | 1.02 | 1.01, 1.03 | 0.002 | ||
| Phet | 0.057 | 0.60 | 0.030 | ||||||||
| Bilateral oophorectomy | 1 | + | 1.03 | 1.02, 1.04 | <0.001 | 1.03 | 1.02, 1.04 | <0.001 | 1.04 | 1.01, 1.08 | 0.015 |
| − | 1.02 | 1.00, 1.05 | 0.060 | 1.03 | 1.01, 1.05 | <0.001 | 1.02 | 1.01, 1.04 | 0.006 | ||
| Phet | 0.62 | 0.81 | 0.27 | ||||||||
| Pregnancy history | |||||||||||
| Gynecological age at first birth,c years | 22 | + | 1.14 | 0.94, 1.37 | 0.18 | 0.93 | 0.74, 1.16 | 0.50 | 1.30 | 0.69, 2.46 | 0.42 |
| − | 1.05 | 0.65, 1.70 | 0.85 | 1.58 | 1.14, 2.19 | 0.006 | 1.40 | 1.07, 1.85 | 0.015 | ||
| Phet | 0.77 | 0.017 | 0.83 | ||||||||
| Birth index | 102 | + | 0.71 | 0.62, 0.81 | <0.001 | 0.74 | 0.64, 0.87 | <0.001 | 0.91 | 0.61, 1.36 | 0.64 |
| − | 0.99 | 0.72, 1.36 | 0.95 | 0.77 | 0.62, 0.96 | 0.023 | 0.82 | 0.69, 0.99 | 0.038 | ||
| Phet | 0.074 | 0.82 | 0.67 | ||||||||
| Benign breast disease (present vs. absent) | |||||||||||
| Age 50 years | 1 | + | 1.91 | 1.66, 2.19 | <0.001 | 1.86 | 1.58, 2.18 | <0.001 | 2.37 | 1.49, 3.78 | <0.001 |
| − | 1.55 | 1.12, 2.14 | 0.008 | 1.79 | 1.41, 2.28 | <0.001 | 1.72 | 1.43, 2.07 | <0.001 | ||
| Phet | 0.29 | 0.84 | 0.21 | ||||||||
| Age 70 years | |||||||||||
| 1 | + | 1.27 | 1.14, 1.43 | <0.001 | 1.21 | 1.06, 1.38 | 0.005 | 1.57 | 1.11, 2.22 | 0.010 | |
| − | 1.30 | 0.98, 1.74 | 0.072 | 1.42 | 1.17, 1.72 | <0.001 | 1.21 | 1.03, 1.43 | 0.023 | ||
| Phet | 0.89 | 0.23 | 0.18 | ||||||||
| Use of hormone therapy, years | |||||||||||
| Oral estrogen | |||||||||||
| Current user | 10 | + | 1.62 | 1.40, 1.88 | <0.001 | 1.57 | 1.32, 1.86 | <0.001 | 0.99 | 0.60, 1.62 | 0.96 |
| − | 1.22 | 0.85, 1.76 | 0.28 | 1.48 | 1.16, 1.91 | 0.004 | 1.19 | 0.96, 1.47 | 0.12 | ||
| Phet | 0.19 | 0.76 | 0.51 | ||||||||
| Past user | 10 | + | 1.07 | 0.90, 1.27 | 0.46 | 0.95 | 0.77, 1.17 | 0.62 | 0.93 | 0.54, 1.63 | 0.81 |
| − | 0.74 | 0.48, 1.15 | 0.18 | 1.09 | 0.81, 1.46 | 0.56 | 1.35 | 1.06, 1.73 | 0.016 | ||
| Phet | 0.15 | 0.49 | 0.23 | ||||||||
| Oral estrogen and progesterone | |||||||||||
| Current user | 10 | + | 2.13 | 1.82, 2.49 | <0.001 | 2.42 | 2.01, 2.90 | <0.001 | 2.12 | 1.32, 3.39 | 0.002 |
| − | 1.90 | 1.25, 2.87 | 0.002 | 1.59 | 1.20, 2.10 | 0.001 | 1.73 | 1.37, 2.17 | <0.001 | ||
| Phet | 0.64 | 0.026 | 0.45 | ||||||||
| Past user | 10 | + | 1.40 | 1.17, 1.68 | <0.001 | 1.46 | 1.18, 1.82 | <0.001 | 2.01 | 1.19, 3.40 | 0.010 |
| − | 1.15 | 0.71, 1.87 | 0.56 | 1.17 | 0.85, 1.61 | 0.35 | 1.97 | 1.52, 2.54 | <0.001 | ||
| Phet | 0.49 | 0.30 | 0.95 | ||||||||
| Other types of hormones | |||||||||||
| Current user | 10 | + | 1.54 | 1.30, 1.81 | <0.001 | 1.71 | 1.41, 2.07 | <0.001 | 1.35 | 0.81, 2.25 | 0.25 |
| − | 1.53 | 1.01, 2.31 | 0.044 | 1.26 | 0.94, 1.69 | 0.12 | 1.23 | 0.97, 1.56 | 0.094 | ||
| Phet | 0.98 | 0.13 | 0.74 | ||||||||
| Past user | 10 | + | 1.01 | 0.84, 1.22 | 0.91 | 1.03 | 0.83, 1.29 | 0.77 | 1.28 | 0.73, 2.24 | 0.39 |
| − | 0.93 | 0.58, 1.50 | 0.76 | 0.93 | 0.67, 1.29 | 0.66 | 1.40 | 1.07, 1.82 | 0.013 | ||
| Phet | 0.77 | 0.64 | 0.78 | ||||||||
| BMId | |||||||||||
| Age 50 years | 8 | + | 0.75 | 0.66, 0.85 | <0.001 | 0.89 | 0.77, 1.02 | 0.089 | 0.93 | 0.63, 1.36 | 0.70 |
| − | 0.96 | 0.70, 1.30 | 0.78 | 0.63 | 0.50, 0.79 | <0.001 | 0.78 | 0.65, 0.92 | 0.004 | ||
| Phet | 0.19 | 0.026 | 0.41 | ||||||||
| Age 70 years | 8 | + | 1.18 | 1.03, 1.35 | 0.015 | 1.52 | 1.30, 1.77 | <0.001 | 1.50 | 1.01, 2.23 | 0.043 |
| − | 1.24 | 0.87, 1.77 | 0.24 | 0.77 | 0.60, 0.98 | 0.034 | 1.15 | 0.95, 1.40 | 0.14 | ||
| Phet | 0.82 | <0.001 | 0.24 | ||||||||
| Height, inches | |||||||||||
| Age 50 years | 6 | + | 1.17 | 1.04, 1.32 | 0.007 | 1.25 | 1.09, 1.43 | 0.001 | 0.86 | 0.59, 1.27 | 0.45 |
| − | 1.12 | 0.83, 1.49 | 0.46 | 1.02 | 0.83, 1.25 | 0.88 | 1.18 | 1.00, 1.39 | 0.050 | ||
| Phet | 0.77 | 0.14 | 0.14 | ||||||||
| Age 70 years | 6 | + | 1.12 | 0.92, 1.35 | 0.25 | 1.37 | 1.09, 1.71 | 0.006 | 1.77 | 1.02, 3.09 | 0.043 |
| − | 1.76 | 1.11, 2.81 | 0.017 | 0.98 | 0.71, 1.35 | 0.91 | 1.13 | 0.85, 1.49 | 0.40 | ||
| Phet | 0.093 | 0.13 | 0.15 | ||||||||
| Alcohol consumption, g | |||||||||||
| Age 50 years | 11 | + | 1.19 | 1.10, 1.29 | <0.001 | 1.17 | 1.07, 1.28 | <0.001 | 1.24 | 0.98, 1.58 | 0.076 |
| − | 1.14 | 0.93, 1.39 | 0.20 | 1.20 | 1.06, 1.37 | 0.006 | 1.09 | 0.97, 1.23 | 0.13 | ||
| Phet | 0.68 | 0.76 | 0.36 | ||||||||
| Age 70 years | 11 | + | 1.27 | 1.16, 1.39 | <0.001 | 1.26 | 1.13, 1.40 | <0.001 | 1.28 | 0.97, 1.69 | 0.077 |
| − | 1.15 | 0.91, 1.46 | 0.23 | 1.23 | 1.06, 1.44 | 0.007 | 1.22 | 1.07, 1.39 | 0.004 | ||
| Phet | 0.46 | 0.86 | 0.74 | ||||||||
| Family history of breast cancer in a first-degree relative (present vs. absent) | 1 | + | 1.56 | 1.41, 1.73 | <0.001 | 1.48 | 1.30, 1.67 | <0.001 | 1.82 | 1.32, 2.51 | <0.001 |
| − | 1.37 | 1.06, 1.78 | 0.018 | 1.61 | 1.35, 1.92 | <0.001 | 1.49 | 1.28, 1.74 | <0.001 | ||
| Phet | 0.40 | 0.49 | 0.28 | ||||||||
Abbreviations: BMI, body mass index; CI, confidence interval; ER, estrogen receptor; HER2, human epidermal growth factor receptor 2; HR, hazard ratio; PR, progesterone receptor.
a Increment: for duration of premenopause and duration of menopause, 1 year; for gynecological age at first birth (age at first birth minus age at menarche), 22 years (age 35 – age 13) versus nulliparous; for birth index, 102 (4 births at ages 20, 23, 26, and 29 years) versus nulliparous; for benign breast disease and family history, present versus absent; for hormone therapy, 10 years of use versus no use; for BMI, 8 units (BMI of 30 vs. BMI of 22); for height, a difference of 6 inches (15 cm) (5′10″ (178 cm) vs. 5′4″ (163 cm)); and for alcohol consumption, 11 g (1 drink per day vs. none, starting at age 18 years). All comparisons assumed that age at menarche was 13 years and age at natural menopause was 50 years; the hazard ratios for BMI, height, and alcohol consumption assumed no use of hormone therapy. Increments used for BMI and height represent the range of values from the 10th percentile to the 90th percentile for these variables.
b P value for heterogeneity comparing positive status with negative status.
c Age at first birth minus age at menarche.
d Weight (kg)/height (m)2.
For PR status, there was significant heterogeneity for increased gynecological age at first birth, which was positively associated with PR− breast cancer (HR = 1.58, P = 0.006) but not PR+ breast cancer (HR = 0.93, P = 0.50; Phet = 0.017). In addition, current long-term use of estrogen and progesterone was positively associated with both PR+ (HR = 2.42, P < 0.001) and PR− (HR =1.59, P = 0.001) breast cancer, but the relationship was stronger for PR+ tumors (Phet = 0.026). The most notable interaction was for increased BMI after menopause, which was positively associated with PR+ breast cancer (HR = 1.52, P < 0.001) but inversely associated with PR− breast cancer (HR = 0.77, P = 0.034; Phet < 0.001).
The results for postmenopausal BMI are notably different in Table 4 than in Table 5. In Table 4, there was significant heterogeneity for ER, with a positive association found for ER+ breast cancer but not ER− breast cancer, whereas in Table 5, after controlling for PR status, no significant heterogeneity remained. However, effects for PR remained unchanged.
Finally, the only significant interaction for HER2 status was for time since natural menopause; the association was stronger for HER2+ breast cancer (per year, HR = 1.05) than for HER2− breast cancer (per year, HR = 1.02; Phet = 0.030).
We also repeated the analyses in Table 5 after restricting the cases to women for whom ER, PR, and HER2 status were all assessed by tumor tissue microarray (n = 1,331 cases). The results were generally consistent with those in Table 5 (see Web Table 2).
We also conducted an analysis similar to that in Table 5, adjusting simultaneously for ER, PR, and HER2 status and tumor size (see Web Table 3). Results for ER, PR, and HER2 were similar to those in Table 5. However, there was significant heterogeneity by tumor size for time since natural menopause (large: HR = 1.02, small: HR = 1.04; Phet < 0.001), current estrogen use (large: HR = 1.17, small: HR = 1.77; Phet = 0.005), current estrogen and progesterone use (large: HR = 1.41, small: HR = 2.50; Phet < 0.001), past estrogen and progesterone use (large: HR = 0.96, small: HR = 1.55; Phet =0.012), postmenopausal BMI (large: HR = 1.33, small: HR = 0.94; Phet = 0.005), and family history of breast cancer (large: HR = 1.22, small: HR = 1.67; Phet = 0.004).
DISCUSSION
Another paper on this subject has been published by Chatterjee et al. (11). They proposed a 2-stage competing-risk proportional hazards model. If  is the regression coefficient for disease type w and covariate Xk from an ordinary competing-risk survival model, then
 |
The parameters Θ0k and Θwj,k correspond to βk and γjk in equation 4. This model is fitted by means of a custom Newton-Raphson program (11). Missing tumor markers are accounted for using an estimating equations approach. A key assumption is that the baseline hazard can be represented in the form
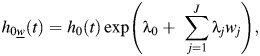 |
which implies independence of the effects of the individual tumor markers on the baseline hazard. However, this assumption is very unlikely to hold for breast tumor markers for which there is strong positive correlation between ER and PR, strong inverse correlation between HER2 and each of ER and PR (see Table 3), and possible correlation between ER, PR, and HER2 versus other tumor characteristics (e.g., grade, stage, size).
In this paper, we show how to fit the model in equations 4 and 5 using SAS competing-risk software. We introduce the concept of an adjusted hazard ratio to express association of risk factors with specific tumor markers adjusted for levels of other tumor markers. Missing tumor markers are accounted for using the missing indicator method. We assume that, conditional on ER and PR status, the probability of HER2+ status is independent of covariate values and is the same for all t, an assumption which had reasonable support in our data (data not shown).
The current article is an update of our previous paper (5) and represents an approximately 50% increase in the number of breast cancer cases within each ER/PR subtype. This generalizes the log-incidence model used in our previous papers (1, 5). The advantage is that the baseline hazard is unspecified, while with the log-incidence model, the baseline hazard is modeled parametrically. In addition, more standard software (e.g., SAS PROC PHREG) can be used.
Regarding pregnancy, there is heterogeneity by tumor subtype. The adverse effect of pregnancy characterized by gynecological age at first birth is apparent only for PR− tumors, while the beneficial effect of pregnancy characterized by the birth index is apparent only for ER+ tumors. Hence, pregnancy is inversely associated with ER+/PR+ breast cancer and positively associated with ER−/PR− tumors, while both a positive association of late age at first birth and an inverse association of having many births starting at an early age are apparent for ER+/PR− tumors. Other risk factors thought to be characteristic of “estrogen-positive tumors,” such as high BMI during postmenopause, are actually associated with ER+/PR+ tumors but not ER+/PR− tumors, consistent with our previous analysis using data collected through 2000 (5). Furthermore, although measuring tumor ER protein expression can be useful in evaluating estrogen responsiveness (as has been shown in multiple clinical and epidemiologic studies), it does not directly indicate the degree of downstream estrogen signaling. Because ER is generally needed for PR expression (12, 13), PR expression has occasionally been used as a crude marker for ER pathway activation. A new finding in the present study is significant heterogeneity regarding long-term use of estrogen and progesterone for PR+ tumors versus PR− tumors.
Yang et al. (4) have considered heterogeneity of breast cancer risk factors according to the ER, PR, and HER2 status of the tumor. Late age at first birth was more common among ER+ cases than among ER− cases and was also more common among ER+/PR− cases than among ER+/PR+ cases. In addition, low parity was more common among ER+/PR− cases than among ER+/PR+ cases, although the difference was not statistically significant. In our study, late gynecological age at first birth was a risk factor for PR− tumors but not PR+ tumors after adjustment for ER status. Conversely, the birth index, which incorporates information on both number of pregnancies and age at each birth, was protective for ER+ breast cancer but not ER− breast cancer. In general, it is important to mutually adjust for both age at first birth and parity (or age at first birth and the birth index) simultaneously; this was done in our study but not in the study by Yang et al. (4). Yang et al. (4) also found that postmenopausal obesity was more common in ER+/PR+ cases than in ER+/PR− cases (P = 3 × 10⁻⁸). This is consistent with our analysis, where high postmenopausal BMI was a risk factor for PR+ breast cancer (HR = 1.52) but not for PR− breast cancer (HR = 0.77).
In summary, the methods outlined in this paper provide an efficient approach for considering heterogeneity of risk factor associations by categories of specific tumor markers, while controlling for levels of other possibly correlated markers. Such an approach may yield additional insights into tumor etiology beyond those pertaining to marginal (e.g., ER+ vs. ER−) or joint (e.g., ER+/PR+, ER−/PR−) effects of tumor markers.
Supplementary Material
ACKNOWLEDGMENTS
Author affiliations: Channing Division of Network Medicine, Brigham and Women's Hospital and Harvard Medical School, Boston, Massachusetts (Bernard Rosner, Robert J. Glynn, Rulla M. Tamimi, Wendy Y. Chen, Walter C. Willett, Susan E. Hankinson); Alvin J. Siteman Cancer Center and Department of Surgery, Division of Public Health Sciences, School of Medicine, Washington University of St. Louis, St. Louis, Missouri (Graham A. Colditz); Department of Nutrition, Harvard School of Public Health, Boston, Massachusetts (Walter C. Willett); Department of Biostatistics, Harvard School of Public Health, Boston, Massachusetts (Bernard Rosner, Robert J. Glynn); Division of Preventive Medicine, Harvard Medical School, Boston, Massachusetts (Robert J. Glynn); Dana-Farber Cancer Institute, Boston, Massachusetts (Wendy Y. Chen); Division of Biostatistics and Epidemiology, School of Public Health Sciences, University of Massachusetts, Amherst, Massachusetts (Susan E. Hankinson); and Department of Epidemiology, Harvard School of Public Health, Boston, Massachusetts (Susan E. Hankinson).
This work was supported by the National Cancer Institute (grant PO1 CA87969). G.A.C. was also supported by an American Cancer Society Clinical Research Professorship.
We acknowledge Dr. Stuart Schnitt and Dr. Laura Collins for pathology work on the tumor markers, Marion McPhee and Rong Chen for programming support, and Virginia Piaseczny and Daad Abraham for administrative support. We thank the staff of the Nurses’ Health Study for their valuable contributions. We also thank the following state cancer registries for their help: Alabama, Arizona, Arkansas, California, Colorado, Connecticut, Delaware, Florida, Georgia, Idaho, Illinois, Indiana, Iowa, Kentucky, Louisiana, Maine, Maryland, Massachusetts, Michigan, Nebraska, New Hampshire, New Jersey, New York, North Carolina, North Dakota, Ohio, Oklahoma, Oregon, Pennsylvania, Rhode Island, South Carolina, Tennessee, Texas, Virginia, Washington, and Wyoming.
Conflict of interest: none declared.
REFERENCES
- 1.Colditz GA, Rosner B. Cumulative risk of breast cancer to age 70 years according to risk factor status: data from the Nurses’ Health Study. Am J Epidemiol. 2000;152(10):950–964. doi: 10.1093/aje/152.10.950. [DOI] [PubMed] [Google Scholar]
- 2.Ma H, Bernstein L, Pike MC, et al. Reproductive factors and breast cancer risk according to joint estrogen and progesterone receptor status: a meta-analysis of epidemiological studies. Breast Cancer Res. 2006;8(4):R43. doi: 10.1186/bcr1525. [DOI] [PMC free article] [PubMed] [Google Scholar]
- 3.Tamimi RM, Colditz GA, Hazra A, et al. Traditional breast cancer risk factors in relation to molecular subtypes of breast cancer. Breast Cancer Res Treat. 2012;131(1):159–167. doi: 10.1007/s10549-011-1702-0. [DOI] [PMC free article] [PubMed] [Google Scholar]
- 4.Yang XR, Chang-Claude J, Goode EL, et al. Associations of breast cancer risk factors with tumor subtypes: a pooled analysis from the Breast Cancer Association Consortium studies. J Natl Cancer Inst. 2011;103(3):250–263. doi: 10.1093/jnci/djq526. [DOI] [PMC free article] [PubMed] [Google Scholar]
- 5.Colditz GA, Rosner BA, Chen WY, et al. Risk factors for breast cancer according to estrogen and progesterone receptor status. J Natl Cancer Inst. 2004;96(3):218–228. doi: 10.1093/jnci/djh025. [DOI] [PubMed] [Google Scholar]
- 6.Millikan RC, Newman B, Tse CK, et al. Epidemiology of basal-like breast cancer. Breast Cancer Res Treat. 2008;109(1):123–139. doi: 10.1007/s10549-007-9632-6. [DOI] [PMC free article] [PubMed] [Google Scholar]
- 7.Colditz GA, Hankinson SE. The Nurses’ Health Study: lifestyle and health among women. Nat Rev Cancer. 2005;5(5):388–396. doi: 10.1038/nrc1608. [DOI] [PubMed] [Google Scholar]
- 8.Lunn M, McNeil D. Applying Cox regression to competing risks. Biometrics. 1995;51(2):524–532. [PubMed] [Google Scholar]
- 9.Glynn RJ, Rosner B. Comparison of risk factors for the competing risks of coronary heart disease, stroke, and venous thromboembolism. Am J Epidemiol. 2005;162(10):975–982. doi: 10.1093/aje/kwi309. [DOI] [PubMed] [Google Scholar]
- 10.Miettinen OS. Theoretical Epidemiology: Principles of Occurrence Research in Medicine. New York, NY: John Wiley & Sons, Inc;; 1985. [Google Scholar]
- 11.Chatterjee N, Sinha S, Diver WR, et al. Analysis of cohort studies with multivariate and partially observed disease classification data. Biometrika. 2010;97(3):683–698. doi: 10.1093/biomet/asq036. [DOI] [PMC free article] [PubMed] [Google Scholar]
- 12.Miyoshi Y, Akazawa K, Kamigaki S, et al. Prognostic significance of intra-tumoral estradiol level in breast cancer patients. Cancer Lett. 2004;216(1):115–121. doi: 10.1016/j.canlet.2004.06.017. [DOI] [PubMed] [Google Scholar]
- 13.Horwitz KB, McGuire WL. Estrogen control of progesterone receptor in human breast cancer. Correlation with nuclear processing of estrogen receptor. J Biol Chem. 1978;253(7):2223–2228. [PubMed] [Google Scholar]
Associated Data
This section collects any data citations, data availability statements, or supplementary materials included in this article.