

Abstract
The chorda tympani (CT) nerve innervates lingual taste buds and is susceptible to damage during dental and inner ear procedures. Interruption of the CT results in a disappearance of taste buds, which can be accompanied by taste disturbances. Because the CT usually regenerates to reinnervate taste buds successfully in a few weeks, a persistence of taste disturbances may indicate alterations in central nervous function. Peripheral injury to other sensory nerves leads to glial responses at central terminals, which actively contribute to abnormal sensations arising from nerve damage. Therefore, the current study examined microglial and astrocytic responses in the first central gustatory relay -the nucleus of the solitary tract (nTS)- after transection of the CT. Damage to the CT resulted in significant microglial responses in terms of morphological reactivity and an increased density of microglial cells from 2-20 days after injury. This increased microglial population primarily resulted from microglial proliferation from 1.5-3 days, which was supplemented by microglial migration within sub-divisions of the nTS between days 2-3. Unlike other nerve injuries, CT injury did not result in recruitment of bone marrow-derived precursors. Astrocytes also reacted in the nTS with increased levels of GFAP by 3 days, although none showed evidence of cell division. GFAP levels remained increased at 30 days by which time microglial responses had resolved. These results show that nerve damage to the CT results in central glial responses, which may participate in long lasting taste alterations following CT lesion.
Keywords: microglia, peripheral nerve injury, chorda tympani, nucleus of solitary tract (nTS), bone marrow chimera
INTRODUCTION
The chorda tympani (CT) nerve is the sensory branch of the facial nerve, which innervates taste buds on the anterior two-thirds of the tongue. In its course through the middle ear, the CT is susceptible to damage during ear surgeries, such as stapedectomy (Clark and O’Malley, 2007) and cochlear implantation (Lloyd et al., 2007). Following CT damage, taste buds disappear from the denervated side of the tongue (Cheal and Oakley, 1977; Guagliardo and Hill, 2007) and a loss or distortion of taste can occur. Although the peripherally injured CT usually regenerates to reinnervate taste buds successfully within several weeks (Cheal and Oakley, 1977; Yasumatsu et al., 2007), persistent dysguesias (i.e., taste alterations) can persist for months or years (Nin et al., 2006) and may indicate alterations in CNS function.
Peripheral injury to other sensory nerves leads to glial responses at primary nerve terminals in the central nervous system (CNS; Aldskogius and Kozlova, 1998). Usually, microglial cells respond first, which in turn cause astrocytic responses (DeLeo et al., 2004). As the resident immune cells of the CNS, microglia continually survey the environment with highly mobile processes and quickly detect and respond to disturbances (Davalos et al., 2005; Nimmerjahn et al., 2005; Wake et al., 2009). Normally, microglia are ramified with a small soma and numerous long, thin, branched processes that are covered in fine protrusions (Hanisch and Kettenmann, 2007; Kreutzberg, 1996). As microglia react to disturbances they begin to retract and thicken their process and eventually become amoeboid with an enlarged cell body and ‘bushy’ appearance (Streit et al., 1999). This morphological reactivity is also accompanied by up-regulation or de novo synthesis of immune surface antigens, release of various bioactive molecules such as cytokines and trophic factors, as well as proliferation (Coull et al., 2005; Ladeby et al., 2005; Perry et al., 1996). Subsequently, astrocytes transform to a hypertrophied form with an enlarged cell body and thickened processes, up-regulate glial fibrillary acidic protein (GFAP) and may also proliferate (Eng, 1985; Ridet et al., 1997).
Such glial responses, in particular those of microglia, are involved in the remodeling of the nervous system upon injury. For example, microglia phagocytose synaptic terminals of motor neurons following nerve injury in a process called synaptic stripping (Graeber et al., 1993; Trapp et al., 2007). Further, microglial activity also contributes to abnormal sensations arising after nerve damage. For example, increasing evidence from animal models suggests that microglia in particular are essential to initiate and maintain chronic pain (Milligan et al., 2008) as the blockade or deletion of microglial receptors causes a decrease of neuropathic pain behavior (Gao and Ji, 2010; Horvath et al., 2010; Hutchinson et al., 2008; Tsuda et al., 2005).
Following peripheral injury to gustatory nerves there is evidence of degeneration and reorganization in the central terminal field, namely the nucleus of the solitary tract (nTS), (Barry and Frank, 1992; Corson and Hill, 2011; Whitehead et al., 1995). However, the accompanying glial responses have not been examined and are the focus of the current study. In particular, experiments examined spatial and temporal features of microglial and astrocytic reactions with a particular focus on the nature of microglial responses.
MATERIALS & METHODS
Animals, anesthetics and analgesics
All experiments were conducted on male and female mice aged three to nine months. The C57Bl6/J line as well as different transgenic lines (see below) were originally obtained from The Jackson Laboratory (Bar Harbor, ME) and bred in-house. The animals were housed on a 14-hour light cycle with access to standard chow adlibitum. All protocols were approved by the Institutional Animal Care and Use Committees at the University of Colorado Anschutz Medical Campus (Aurora, CO) and National Jewish Health (Denver, CO).
Transgenic strains
B6.129P-Cx3cr1tm1Litt/J – All microglia are labeled by green fluorescent protein (GFP) by the replacement of the first 390 bp of Cx3cr1 gene with a cDNA that encodes enhanced GFP (Jung et al., 2000).
C57Bl/6-Tg (UBCGFP) 30Scha/J – GFP expression is under the direction of the human ubiquitin C promoter, which results in the presence of GFP by all cell types. These mice were used to mark cells arising from donor animals in the chimeric mice described below.
Generation of GFP+ bone marrow chimerae
These mice were generously provided by Drs. William J. Janssen and Peter M. Henson (National Jewish Health, Denver, CO). This method is detailed in a previous publication (Janssen et al., 2010). Briefly, C57Bl6/J mice received what would be a lethal dose of irradiation (900cGy, 137Cs source) to destroy the bone marrow. The animals then received bone marrow transplantation with bone marrow cells isolated from the hind limbs of UBCGFP animals (5×10⁷ GFP bone marrow cells via tail vein injection). Hence, in the BM-chimaeric mice GFP expression identifies cells that arise from the bone marrow. In order to assess whether cranial irradiation affected glial responses, some animals were irradiated with the head shielded while others had no head shield. In the “Head Shield” animals, radiation to the head was blocked by 1cm strips of lead placed above and below the cranium; “NO Head Shield” animals underwent full body and head irradiation. Both of these types of animals served as recipients of bone marrow transplantation from the UBCGFP animals. Within 4 weeks of transplantation, over 95% of circulating blood cells expressed GFP in the chimeric mice.
Survival surgeries
For survival procedures, animals were anesthetized with intramuscular injections (IM) of dexmedetomadine hydrochloride (0.4 mg/kg: Pfizer, Finland) followed by ketamine hydrochloride (40mg/kg: Bioniche Pharma; Lake Forest, IL). Once fully sedated, the animal was positioned in a non-tramatic head holder and placed on a heating pad and the surgical site was shaved and prepped with betadine and ethanol. Following the surgical procedure, 0.04mL marcaine (0.5%: Hospira; Lake Forest, Illinois) was applied to the incision prior to suturing with DexonII 6.0mm (Syneture; Norwalk, CT). Anesthesia was reversed with atipamezole (2mg/kg: Pfizer, Finland), the antidote to dexmedetomadine, and animals were monitored during recovery.
Chorda tympani transection (CTx)
The CT nerve winds around the ossicles while coursing through the ear canal (illustrated in Figure 1A). After removing the tympanic membrane in the right ear the CT was transected; the left side remained intact. Animals survived for 1, 2, 3, 5, 10, 15, 20 or 30 days; day 0 indicates uninjured/control. Sham surgeries involved removal of the tympanic membrane to expose the CT while the nerve remained untouched and intact. In total, 45 control mice (C57BL6), 6 CX3CR1-gfp mice and 27 BM-chimerae mice received CTx or sham operations (see Table 1).
Figure 1.

Staining for purinergic receptors P2X2 and P2X3 identifies afferent chorda tympani nerve (CT) projections in the nucleus of the solitary tract (nTS). A. CT cell bodies reside in the geniculate ganglion. The peripheral processes of the CT course through the ossicles before innervating fungiform taste buds on the anterior tongue; central processes terminate in the rostral medulla, primarily in the rostral central (RC) subnucleus of the nTS. The illustrations at levels R1, R2, R3 (adapted from Paxinos and Franklin, 2001) depict the CT terminal fields in magenta and correspond to photomicrographs in B1-3. Borders of the nTS were identified with fluorescent Nissl staining (green). The P2X2 staining in magenta mirrors the projections of afferent CT fibers, with strong label in the solitary tract (T; arrows in gray scale images) and RC and fainter label in the ventral subnucleus (V). Fluoresent Nissl and P2X2 each shown separately in adjacent gray scale images. Scale bars in B1 apply to B2-3. C,D. To test if both P2X2 and P2X3 purinergic receptors localized to CT terminal fields, a dextran tracer was applied to the peripheral CT nerve to delineate afferent CT fibers (i, dextran red). Both P2X2 and P2X3 staining (ii-iii, blue and green, respectively) stain the same regions of the dextran-labeled afferent CT fibers and were subsequently used to localize CT fibers in the nTS. 10μm z-stack. Abbreviations: DC, dorsal cuneate; ECu, external cuneate; icp, inferior peduncle; IV, fourth ventricle; mlf, medial lemniscus formation; nSp5V, spinal trigeminal nucleus; nVII, facial motor nucleus; nX, vagal motor nucleus; py, pyramids; RFp, reticular formation (parvicellular); sp5, spinal trigeminal tract; SpVe, spinal vestibular nucleus; T, tract.
Table 1.
Bone marrow chimera CTx cases
| Days post CTx | # cases, Shield | # cases, NO Shield |
|---|---|---|
| 0 | 5 | 5 |
| 3 | 4 | 2 |
| 5 | 3 | 2 |
| 20 | 2 | 2 |
| 30 | 2 | -- |
CT labeling with dextran
The CT was accessed through the tympanic bulla in order to apply a dextran tracer. A longitudinal incision on the ventral neck revealed the digastric and masseter muscles. The tympanic bulla sits roughly between the two muscles though much farther dorsal. A small hole was made through the bulla where the CT was visualized between the ossicles and cut. The nerve stump proximal to the brain was labeled generously with crystals of 3kD biotinylated rhodamine-labeled dextran amine (D-7162: Invitrogen; Carlsbad, CA). A small piece of parafilm was placed over the opening in bulla before closing the incision (adapted from Mangold and Hill, 2008).
However, this method brought limitations to the current studies primarily because the optimal time to observe anterograde dextran tracer (i.e., CT afferents in the nTS) is two to three days. As the dye slowly dissipates with longer survival times, it becomes impractical to localize the CT projections in longer-term survivals. Further, in studying glial reactivity it was not desirable to introduce another source of damage. Therefore, the antibodies to purinergic receptors P2X2 and P2X3 were tested and subsequently utilized to define the area of termination of primary CT afferents (see Figure 1).
Perfusion and fixation
Animals were deeply anesthetized with 50mg/kg sodium pentobarbital (Ovation Pharmaceuticals Inc; Deerfield, IL) by intraperitoneal injection (IP). The mouse was then perfused transcardially with 15mL of 0.9% sodium chloride followed by 25mL of 4% paraformaldehyde (PFA). The brainstem was removed and postfixed in buffered PFA for 3-4 hours at room temperature before overnight cryoprotection with 20% sucrose in 0.1M phosphate buffer (PB, pH 7.2) at 4°C. The next day, the tissue was mounted in OCT compound (Optimal Cutting Temperature; Fisher Scientific, Pittsburgh, PA) and cut on a cryostat. For Ki67 labeling, 30μm sections were collected directly onto Superfrost Slides (Fisher). For all other experiments, 40μm free-floating sections were collected in three reservoirs filled with PBS (0.1M phosphate buffer saline, pH 7.2). Accordingly, the brainstem was separated into three series with sections spaced 120μm apart. After antibody processing, sections were mounted onto slides and cover slips were applied with Fluormount G (Southern Biotechnology Associates, Inc., Birmingham, AL).
Immunohistochemistry
Antibodies were diluted in blocking solution (2% normal goat serum, 1% bovine serum albumin and 0.3% triton in PBS); overnight incubations were at 4°C and buffer washes were ten minutes each unless stated otherwise.
Iba1 double and triple label
for microglia cell counts – After three washes in PBS, 40μm free-floating sections were incubated in blocking solution for 1 hour at room temperature. Tissue was incubated overnight with rabbit anti-Iba1. Three PBS washes were followed by incubation with Alexa568 goat anti-rabbit for two hours at room temperature. The tissue was again washed three times in PBS before staining with green fluorescent Nissl (methods follow).
with P2X2 – When Iba1 and P2X2 -both rabbit antisera- were applied on the same sections, a sequential application and detection of the antibodies was necessary. Staining for Iba1 was carried out as mentioned above. The P2X2 antibody was then directly conjugated to an Alexa fluor 488 via the Zenon labeling kit (Molecular Probes; Eugene, OR) according to instructions (5μl P2X2/1mL) before applying to the tissue. By directly conjugating the P2X2 to the fluorophore, this technique prevents the tissue from exposure to a second, secondary antiserum and cross reactivity is essentially abolished. The drawback is that the Zenon antibody complex is much larger, which results in decreased staining intensity and penetration. The tissue was then stained with deep red fluorescent Nissl staining (see below).
with Ki67 – Sequential stain was also used with the Iba1 and Ki67 rabbit antibodies. Tissue was collected directly onto slides since it better withstood the necessary antigen retrieval process. After the initial buffer washes, slides were placed into plastic coplin jars with 10mM sodium citrate (pH 6). The containers were placed in water bath and the temperature then set to 95°C. After 15 minutes at 95°C, the jars cooled at room temperature for 45 minutes followed by three buffer washes. Because a biotinylated secondary antibody and Strepavidin were used to visualize the Ki67, the Avidin/Biotin blocking kit (Vector Laboratories; Burlingham, CA) was utilized according to kit instructions to reduce endogenous avidin and biotin labeling. The tissue then incubated overnight with the Ki67 antiserum. After three buffer washes, the tissue incubated with biotinylated F(ab) goat anti-rabbit secondary for 2 hours and was washed before applying Streptavidin Alexa-568 (1:1000) for 1 hour. To block any remaining open rabbit-binding sites, tissue was exposed to unconjugated anti-rabbit F(ab) fragments overnight. After washing, sections were labeled with Iba1 (detected with Alexa568, goat anti-rabbit) and deep red fluorescent Nissl.
with GFAP – The Iba1 and GFAP antisera (rabbit and mouse, respectively) incubated simultaneously. After washing and blocking, both antibodies were applied to sections overnight. The secondaries Alexa568 goat anti-rabbit and Alexa488 goat anti-mouse were also used in the same 2-hour incubation. Washes preceded staining with deep red fluorescent Nissl.
Fluorescent Nissl
The fluorescent Nissl stain (NeuroTrace; Molecular Probes; deep red and green) is used to identify brain regions (e.g., Varga et al., 2008) and was used here to delineate the nTS and surrounding brainstem nuclei. After antibody labeling, the tissue incubated with fluorescent Nissl (1:100 in blocking media) for 25 minutes at room temperature. Two washes in PBS were followed by one wash in PB before the sections were mounted onto slides.
Biotinylated-dextran labeling of CT fibers
After washing and blocking tissue, the sections incubated with the P2X2 and P2X3 antibodies overnight. To enhance fluorescence of the biotinylated dextran tracer, Streptavidin Alexa 568 (Molecular Probes) was applied to the tissue with AlexaCY5 goat anti-rabbit and Alexa488 goat anti-guinea pig secondaries.
Antibody characterization
Further antibody details, including species, clonality, manufacturer, catalog and working dilution are listed in Table 2.
Table 2.
Primary Antibodies
| Antiserum | Immunogen (sequence) |
Company (catalog #) |
Working dilution |
|---|---|---|---|
| Rabbit polyclonal anti-Ibal (ionized calcium binding protein) |
synthetic peptide to rabbit C’ terminus (PTGPPAKKAISELP) |
Wako: Richmond, VA (019-19741) |
1:500 |
| Rabbit polyclonal anti-P2X2 | synthetic peptide to rat C’ terminus (SQQDSTSTDPKGLAQL) |
Alomone: Jerusaleum (APR-003) |
1:500 |
| Guine pig polyclonal anti-P2X3 | synthetic peptide to rat C’ terminus (VEKQSTDSGAYSIGH) |
Neuromics: Edina, MN (GP10108) |
1:500 |
| Mouse monoclonal anti-GFAP | purified ovine glial fibrillary acidic protein |
Sigma: St. Louis, MO (G3893) |
1:200 |
| Rabbit monoclonal anti-Ki67 | synthetic protein to human C’ terminus (located within residues 1000-1700) |
Thermo Scientific: Rockford, IL (MA1-90584) |
1:200 |
| Chicken polyclonal anti-GFP | purified green fluorescent protein | Avēs Labs: Trigard, OR (GFP-1020) |
1:1000 |
Iba1 (ionized calcium binding protein 1)
Microglia cells were visualized with an antibody directed against the cytoplasmic ionized calcium binding protein 1 (Iba1). This antibody was made in rabbits against a synthetic peptide corresponding to the C terminal domain of the rabbit Iba1 sequence and was purified using antigen affinity chromatography. A single band at 17kD was detected in an immunoblot assay and staining in mouse brain tissues was specific to microglia and macrophages without reactivity in other cell types (per company data sheet and Ito et al. (1998).
Purinergic P2X2 receptor
Staining for the ionotropic ATP receptor P2X2 was used to localize primary gustatory fibers. This antibody was made in rabbits against a synthetic peptide to the C terminal domain of the rat P2X2 sequence. A single band at 80kD was detected on Western blots from PC12 lysates (manufacturer’s technical information). This antibody was verified by staining tissues from mice in which the P2X2 receptor was genetically deleted; no signal was detected (Finger et al., 2005).
Purinergic P2X3 receptor
Staining for the ionotropic ATP P2X3 receptor was also used to localize primary gustatory fibers. This antibody was made in guinea pigs against a synthetic peptide to the rat C terminal domain of the P2X3 sequence. Preadsorbing this antibody with the peptide immunogen (20mg/mL) prior to staining trigeminal ganglia of rat blocked all staining (Dellarole and Grilli, 2008; Ichikawa and Sugimoto, 2004). Also, the P2X3 staining in the current study is consistent with the staining pattern on afferent gustatory fibers previously described (Finger et al., 2005).
GFAP (glial fibrillary acidic protein)
Astrocytes were visualized with an antibody directed against glial fibrillary acidic protein (GFAP). According to the company data sheet, this antibody was isolated from mice that were injected with purified ovine GFAP. Staining with GFAP is consistent with the staining pattern previously described, staining cells with the classic morphology and distribution of fibrillary astrocytes in the mouse brain (Miya et al., 2008).
Ki67
Staining for Ki67 was used to identify proliferative cells. Ki67 is a nuclear cell cycle protein, which is present in G1, S, G2 and M active phases but is absent during the resting G0 phase. Hence, specific labeling of this antibody is restricted to the nucleus. This monoclonal antibody was made in rabbits against a synthetic peptide against the human C terminus of Ki67 and according to the company data sheet a single band at 359kD is detected on Western blots with tonsil tissue. Staining was verified with immunohistochemistry in mouse smooth muscle tissues where proliferation was inhibited or absent; no signal was detected (Schwaiberger et al., 2010). Application of this antiserum to lingual epithelium shows staining in the basal cell layer consistent with the location of proliferative cells (unpublished observation). Further, in current studies the baseline Ki67 staining was essentially absent in control brainstem tissue (see Figure 6C).
Figure 6.

Proliferative Ki67+ microglia appear in the vicinity of damaged CT fibers. All images at level R2 and were rotated to the same dorsal (top)-medial (left) orientation; panels A and B from same animal; scale bar in A applies through D; 8-10μm z-stacks. A,C. There are next to no Ki67+ nuclei in the vicinity of P2X3+ CT fibers (magenta) in the uninjured (uninj) and intact sides (int) of CTx cases. B,D. Between 1.5 and 3 days after CTx, Ki67+ nuclei appear throughout the CT fibers on the transected (tx) side. B’ Location of dashed square in B; Ki67+ nuclei are only seen in microglial cells positively stained with Iba1 (magenta). The squared region in the inset highlights microglial doublets or a pair of microglia in apposition that are also Ki67+ (scale bar 10μm). E. The time course of Ki67+ microglial cells on intact (int, magenta circles) and transected sides (tx, green squares) per 4.8×106 μm3 where each square or circle represents the mean from one case. The average number of Ki67+ microglia in the uninjured and intact sides is less than 1; the only time the number of Ki67+ microglia is greater than twice the standard deviation of the average (=1.43, dotted line) is on transected sides between days 1.5-3. By 5 days, dividing microglia return to normally low levels.
GFP (green fluorescent protein)
In tissue from GFP-bone marrow chimeric mice, an anti-GFP antibody was applied to enhance detection of GFP protein. The antibody was isolated from IgY fractions of egg yolks from GFP-immunized chickens. The antibody was verified by Western blot analysis and immunohistochemistry on tissue from transgenic GFP-expressing mice, where the antibody staining co-labeled with the endogenously expressed GFP (manufacturer’s technical information). This antibody was also tested in current experiments in non GFP-expressing mouse brain tissue; no label was detected (not shown).
Secondary antibodies
Further details about secondary antibodies, including manufacturer, catalog number, species and working dilution are listed in Table 3. In order to test the specificity of secondary antibodies, the secondary antibody was applied to the tissue without a primary antibody. Specific staining was not detected which confirmed that the secondary signal normally results from binding to the primary antibody (data not shown). In experiments with two antibodies, one primary was eliminated while still applying both secondaries to test for cross-reactivity of secondary antisera. No inappropriate staining was observed for the combinations employed.
Table 3.
Secondary antibodies
| Antibodies | Company (Catalog #) | Dilution |
|---|---|---|
| gt anti-rb, Alexa 568 | Invitrogen (A11036) | 1:400 |
| gt anti-rb, Alexa 488 | Invitrogen (A11008) | 1:400 |
| gt anti-gp, Alexa 488 | Invitrogen (A11075) | 1:400 |
| gt anti-ms, Alexa 568 | Invitrogen (A11029) | 1:400 |
| gt anti-ck, Alexa 488 | Invitrogen (A11039) | 1:400 |
| gt anti-rb, Biotin F(ab) | Jackson Immunoresearch (111-067-003) |
1:500 |
| gt anti-rb, F(ab) unconj | Jackson Immunoresearch (111-067-003) |
1:50 |
| gt anti-rb, Rho 568 | Jackson Immunoresearch (111-291-003) |
1:100 |
gt, goat; rb, rabbit; gp, guinea pig; ms, mouse; ck, chicken
nTS identification
In tissue stained with fluorescent Nissl, the rostral central (RC) and ventral (V) subdivisions of the nTS were delineated according to previous studies (Whitehead, 1990 and reviewed in King, 2007). The densest projections of CT fibers lie in rostral levels of the nTS, designated R1, R2 and R3 (Stratford and Finger, 2011) as shown in Figure 1B1-3 (illustrations modified from Paxinos and Franklin, 2001). The following features identified each level:
-
■
R1, most rostral (Figure 1B1) – the nTS is immediately ventral to the spinal vestibular nuclei (SpVe), the dorsal cochlear nucleus (DC) spans about half the height of the medulla, the seventh motor nucleus (nVII) is present
-
■
R2 (Figure 1B2) – the nTS is positioned more medially toward the fourth ventricle (IV), the DC spans only about a third of the height of the medulla, nVII is much smaller
-
■
R3, most caudal (Figure 1B3) – the nTS continues to shift toward the fourth ventricle, the spinal trigeminal nucleus (nSpV) nears the lateral edge of the nTS; the external cunneate (ECu) is in dorsolateral edge of the medulla, DC and nVII are not present.
Image acquisition & processing
Confocal images were obtained with an Olympus Fluoview Laser Scanning Confocal Microscope (LCSM; 10×, N.A. 0.40; 20×O (oil immersion), N.A. 0.80; 60×O, N.A. 1.4). Each channel was obtained sequentially and merged together to prevent side-band excitation of the different fluorophores. The confocal images that were used for cell counts were acquired with the same settings of laser intensity, pmt, offset, and gain. Cell counts were done on the original 12-bit images. Where confocal images are shown in figure panels, optical z-stacks were collapsed into a single plane and the brightness was adjusted in Adobe Photoshop CS4. The borders of nTS were outlined on grayscale fluorescent Nissl images in Adobe Illustrator 10 and superimposed onto the color images.
Epifluorescent images were acquired using an Olympus BX41 upright microscope and a 20× objective (N.A. 0.50). The exposure settings were set (with gamma=1) to avoid saturated pixels in the brightest objects and were held constant across all experiments. Hence, pixel values were directly related to image brightness and could be utilized for quantification. Where epifluorescent images are shown in figure panels, the brightness was adjusted in Adobe Photoshop.
Analysis of GFAP fluorescence
Measures of GFAP were made on the original epifluorescent 12-bit images without adjusting brightness or contrast settings. The fluorescent intensity of GFAP was measured within a defined circular region of interest (ROI=1,596.2μm2) using the ImageJ version 1.62 software (National Institutes of Health, Bethesda, MD). Four time points post CTx were analyzed (0, 3, 15, 30 days); n=3 each. For each animal, two ROI measurements were taken at levels R2 and R3 on intact and transected sides in the following regions: rostral central nTS (RC), ventral nTS (V), vagus motor nucleus (nX) and spinal vestibular (SpVe). Within each animal, the GFAP measurements did not differ at levels R2 and R3; hence, the two measures at R2 and the two measures at R3 were all averaged into a single value on intact and transected sides. [F(9, 24) = 3.72, p < 0.05].
Cell counts
Following the optical dissector method (reviewed by (Mayhew and Gundersen, 1996), a pair of parallel image planes was acquired with the LCSM to count the microglial nuclei. The soma of the microglia had to be identified in order to count the nucleus. If the nucleus touched the left or bottom sides of the counting frame, the cell was excluded; those touching the right and top sides were counted if half of the nucleus was contained within the region.
Microglia counts
To count microglia in tissue stained with Iba1 and fluorescent Nissl, the dissector was placed in the middle of the tissue (8μm guard zone) and consisted of two parallel frames spaced 5μm apart. Image frames were acquired with 60×O with an area of 55,225μm2.To consider a microglia cell in the ‘reference’ image both cytoplasmic Iba1 and nuclear Nissl staining were required. If the nucleus was not present in the partner ‘look up’ image, the cell was counted. Nine time points after CTx were analyzed (0, 1, 2, 3, 5, 10, 15, 20, 30 days); n = 4 each. From each animal, two microglial counts were taken from levels R1, R2, R3 on both intact and transected sides in the following regions: rostral central nTS (RC), ventral nTS (V), parvicellular reticular formation (RFp) and dorsal cuneate-spinal vestibular (DC-SpVe). The two counts from each animal at every rostral level did not differ within brain regions across time points so the six counts were averaged into a single value and on intact and transected sides [F(24, 162) = 10.7, p < 0.05].
To ensure that the act of surgery alone (independent of nerve transection) did not cause microglia responses in our regions of interest, the numbers of microglia were compared between animals that received no surgery (day 0; n = 4) and those that received a sham operation (2, 5, 15 or 30 days post CTx; n = 1 each). The density of microglia did not differ significantly between un-operated and sham animals [F (1, 6) = 5.24, p = 0.08], suggesting that the process of surgery alone had no significant effect on the number of microglia.
Proliferative microglia counts
A dissector, 10μm high, was situated in middle of the tissue section (8μm guard zone). The two counting frames were obtained at 20×O with an area of 600,000μ2. Proliferative microglia were reactive for both Iba1 and nuclear Ki67 and counted according to criteria detailed above. Times from 0 – 10 days were analyzed, where an average number of 0.4 ± 0.7 dividing microglia was in the uninjured and intact nTS.
Statistical analysis
The cell counts or intensity measurements from each experiment were analyzed using SPSS software (Chicago, IL) with appropriate 1-, 2-, 3- way ANOVAs and Tukey’s post-hoc analysis unless otherwise noted. Significant differences were defined as p<0.05.
RESULTS
CT fibers in nTS
Dense P2X2 staining in the rostral medulla delineated the area of afferent CT terminations within the nTS; namely, dense staining in the solitary tract (T) and the RC subnucleus with finer staining in the dorsal part of the ventral subnucleus (V; Figure B1-3, magenta). The precise CT terminal fibers could be seen upon labeling the peripheral CT with biotinylated dextran. These dextran labeled fibers appeared predominantly in RC and faintly in V (Figure 1C,D red); efferent axons of superior salivatory neurons, which were located at level R1 ventral to the nTS, were also dextran labeled (data not shown here but previously described Whitehead and Frank, 1983) but were not heavily labeled by P2X2 antisera. Notably, the region containing dextran labeled CT fibers (red) was entirely encompassed by heavy P2X2 and P2X3 staining (blue and green respectively, Figure 1C, D). Though the immunoreactivity for these purinergic receptors extends beyond the region of termination of CT fibers, these antibodies served to locate the area of primary CT afferent termination in the rostral nTS.
As reported by others (Yao et al., 2001), scattered neurons of the rostral medulla were reactive for P2X2 when the antibody was labeled sequentially with Alexa secondary antibodies (Figure 1C, D blue) albeit substantially fainter than the primary afferent label. In contrast, staining with the P2X2-Zenon conjugate produced staining essentially restricted to the incoming CT fibers in the solitary tract that terminate in RC and V (Figure B1-3, magenta). Nevertheless, P2X2 staining localized to CT fiber regions with the sequential labeling method as well as the Zenon method and both techniques were utilized to define the area of CT projections.
Microglia in the nTS
In control cases and on the unlesioned side, the Iba1+ microglial cells were evenly distributed in a grid-like pattern throughout the nTS (Figure 2A, green and corresponding grayscale in 2A’; P2X2 reactivity in magenta identifies CT fibers). Each microglial cell and its processes occupied a distinct territory that did not overlap with adjacent cells. The regularly spaced distribution of microglia was maintained in tissue on the intact side (int) of CTx cases (Figure 2B,B’) as well as both sides in the sham operations (Figure 2C,C’).
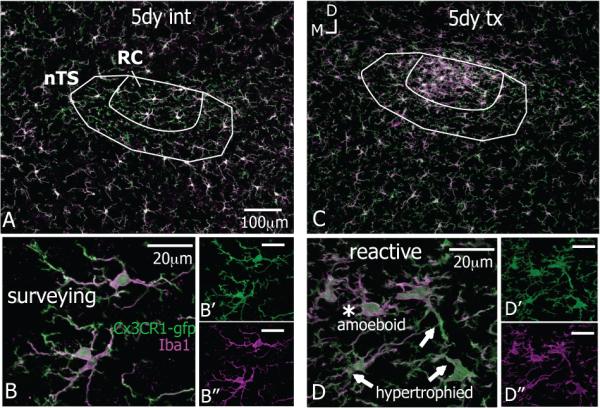
Figure 2.

Microglia react after CTx. All images at level R2 with gustatory fibers and terminal field stained with P2X2 in magenta; microglia stained with Iba1 shown in green (A-I) and individually in corresponding grey scale (A’-G’). All images rotated to the same dorsal (top)-medial (left) orientation the same as Figure 1; panels B, E are from the same animal; scale bars in A,A’ apply through G,G’; 8-10μm z-stacks. A,A’-C,C’. In the uninjured (uninj) brainstem, microglia occupy distinct spatial territories throughout the nTS and surrounding areas. The uniform distribution of microglia is maintained on intact sides (int) and both sides in sham-operation. D,D’. At 1 day after CTx the Iba1 staining is more intense in the nTS though the distribution of microglial cells appears similar to the intact side at 1 day after CTx. By 2 days, a dense cluster of Iba1 reactivity emerges with CT terminal fibers in RC, which remains for several weeks (F,F’-G,G’) and resolved by one month (G,G’). The microglial morphology was used as a general indication of activation and to classify cells as surveying or reactive. Microglia in the nTS in “Control” conditions display morphological features of a surveillance state, namely smooth somata with several long and highly ramified processes that projected in all directions. (H). Microglia on transected sides underwent substantial morphological transformations that are characteristic of reactivity. I. Microglial cells beginning to react have slightly retracted processes and jagged soma; these cells are hypertrophied (arrows). As microglial cells continue to react they appear ‘bushy’ from an enlarged somata with a few short, thick projecting processes; these cells are amoeboid (asterisk). Amoeboid microglia were in the nTS between 2-20 days after nerve injury (H,I from the same case at 2 days post CTx).
Following nerve damage distal to the geniculate ganglion, microglia reacted throughout the terminal field of the CT nerve. At one day after injury, the microglia on the transected side (tx) were more heavily stained with Iba1 though the distribution of the cells appeared similar to normal (Figure 2D,D’). However, by two days post CTx a cluster of microglial cells appeared in the CT terminal field. This microglial aggregate was mostly confined to the RC subnucleus and resulted in much denser and brighter Iba1 staining in this region. This clustering of cells and heavier Iba1 staining lasted until three weeks after injury (shown at 5 and 10 days post CTx in Figure 2E,E’ – F,F’) and resolved by one month after CT injury (Figure 2G,G’). The microglial cells and Iba1 staining were not altered in the second-order relay nucleus, the parabrachial nucleus; however, on occasion Iba1 staining was brighter in the seventh motor nucleus (data not shown).
Additionally, microglial morphology was used as a general indication of activation states and to classify cells as surveying or reactive. Microglial cells are normally in a surveillance state (previously referred to as ‘resting’, reviewed in (Hanisch and Kettenmann, 2007) and display a highly ramified morphology entailing a smooth cell body and long, thin processes with several fine branchlets. In the nTS, surveying microglia had an oval cell body with processes projecting from the somata, which extended upward of 40μm (Figure 2H, intact side at 2 days after injury). Microglia remained in surveillance mode on the intact side of the nTS as well on both sides in sham-operated cases.
Microglia in the nTS on the nerve-transected side underwent dramatic morphological transformations and were classified as reactive. By one day after CTx, microglial cells were hypertrophied with enlarged, jagged and more heavily stained cell bodies and several partly retracted and thickened cellular processes, which extended only about 20μm (arrows in Figure 2I, at 2 days post CTx). These hypertrophic alterations correspond to initial stages of microglial reactivity (Ladeby et al., 2005). By two days after injury, microglia acquired an amoeboid shape and overall ‘bushy’ appearance. An amoeboid microglia had an enlarged and densely stained soma with only a few short, thick projecting processes, which were devoid of any branchlet ramifications (Figure 2I, asterisk). These amoeboid microglia tended to occur from 2 – 20 days after CTx and are highly indicative of a phagocytic phenotype (Gehrmann et al., 1995).
A limitation of immunohistochemical analysis is the possibility that low-expressing microglia are undetected by the Iba1 antibody. Since reactive microglia up-regulate the expression of Iba1 (Ito et al., 1998; Kohsaka et al., 2003), the normally undetected cells could contribute to the increased Iba1-IR (immunoreactivity) that appeared in RC after nerve injury. To test if all microglia were identified at baseline levels (i.e., surveying microglial cells in uninjured tissue), the Iba1 antibody was used in tissue from mice in which all microglia express GFP under control of the Cx3cr1 gene (Cx3CR1-gfp). In these experiments, an Iba1 low-expressing microglial cell would be Iba1− and GFP+. In the uninjured and intact nTS, every endogenously GFP+ microglia was also labeled with the Iba1 antibody (Figure 3A, B). This suggests that in a surveillance state all microglia that express the Cx3CR1-driven GFP also express detectable levels of Iba1. Similarly, the Cx3CR1-GFP parallels the expression of Iba1 on the transected side following nerve injury with denser staining in RC where the reactive microglia, both hypertrophied and amoeboid, were positive for both GFP and Iba1 (Figure 3C, D). Thus, there was no evidence of non-Iba1 stained microglia in either the control or lesioned cases.
Figure 3.
The Iba1 antibody detects all CX3CR1-positive microglia in the nTS. Images are from the same animal and were rotated to the same dorsal (top)-medial (left) orientation. Scale bar in A applies to C; 10μm z-stacks. A-B“. The Iba1 antibody (magenta) was used in tissue where all microglia endogenously expressed GFP (Cx3CR1-gfp) to look for low-expressing microglia cells at baseline levels, i.e. in a surveillance state that were undetected by the antibody (GFP+/Iba1-). The Iba1 antibody staining completely overlaps with GFP, suggesting that the Iba1 labels all the microglial cells. C-D”. The Iba1 also co-localizes with GFP in activated microglia, both hypertrophied and amoeboid, on the transected after CT injury.
In addition to the increased expression of Iba1 by reactive microglia, more microglial cells could also contribute to the increased Iba1-IR after nerve injury. To test this, Iba1+ microglial cells were counted in RC (Figure 4a). The density of microglia on the intact sides remained the same as uninjured levels (day 0) regardless of injury. However, by 2 days post CTx the density of microglia on the transected side had doubled compared to the control or intact side. This increase peaked at 5 days with an approximately 3-fold increase in microglia. Afterwards, the microglial population slowly decreased, yet remained significantly higher than normal, for two weeks and returned to baseline by one month. Hence, these data show more microglial cells in RC on the transected side after CTx.
Figure 4.
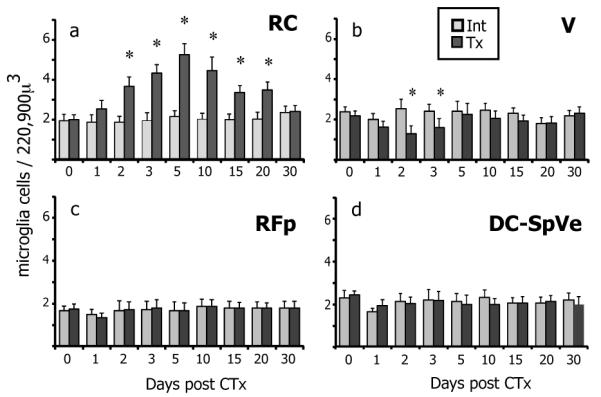
The density of microglia in the nTS varies after CTx a. The density of microglial cells in the intact (int, light grey) RC subnucleus is the same as normal uninjured levels at day 0 and remains constant over time despite contralateral nerve injury. On the transected side (tx, dark grey) however, the density of microglia doubles in RC by 2 days post CTx compared to the intact side. This increase in microglial numbers peaks to a 3-fold increase at 5 days post CTx. The numbers of microglia slowly diminish but still remained significantly higher until 20 days after injury, before returning to normal levels by 30 days (asterisks indicate significant increase). b. Unlike the dramatic increase in microglia in RC, the density of microglia in the ventral subnucleus of nTS (V) significantly decreases on the transected side compared to the intact side at 2 and 3 days CTx (asterisks indicate significant decrease). This decrease is consistent with the migration of microglia out of V into RC. c,d. Despite the changes in microglial density in the nTS, the density of microglia remains constant within the ventral-neighboring reticular formation (RF) and dorsal-neighboring dorsal cuneate and spinal vestibular nuclei (DC-SpVe). SEM error bars, n=4 each time point, *p≤0.05 compared to intact sides.
Source of microglial response in nTS
Though expansion of the population is a characteristic trait with microglial responses (Ladeby et al., 2005), the source of this response was of interest; in other words, where did the ‘new’ microglia come from? Three possibilities that could contribute to the increased number of microglial cells were addressed:
Migration from nearby brain regions
Recruitment of bone marrow-derived progenitors from circulation
Proliferation of local microglia
Migration
Given the propensity of microglia to mobilize upon injury (Gyoneva et al., 2009), the microglial density was determined in brain regions around the nTS. Accordingly, microglia were counted in the spinal vestibular and dorsal cuneate nuclei (SpVe, DC), which border the nTS dorsally, the ventral subnucleus of nTS (V), which ventrally abuts RC, and the parvicellular reticular formation (RFp), which is immediately ventral to the nTS (refer to Figure 1 for anatomical illustrations). While microglial numbers in the RFp, DC and SpVe nuclei remained constant on both sides over time, the number of microglia in the V region of nTS decreased significantly on the transected side at 2 and 3 days post transection in comparison to the intact side (Figure 4b-d). The reduction of microglia in the V subnucleus is consistent with the migration of cells from this region into RC despite the presence of primary afferent terminals within V.
Recruitment from circulation
Studies using the facial nerve axotomy model have shown that bone-marrow (BM)-derived cells are attracted to axotomized motoneurons in the CNS and differentiate into functional microglia (Flugel et al., 2001; Priller et al., 2001). To test whether any BM-derived cells infiltrated the nTS following CT nerve damage, BM-chimeric mice were utilized where GFP-IR identified cells that were recruited from circulation. In these experiments, BM-derived cells in the nTS that could contribute to increased numbers of microglia would be GFP+ and Iba1+.
In generating BM-chimerae, the head was shielded from radiation to prevent radiation damage that might cause microglial responses (‘Head Shield’). At three days after CT nerve injury to ‘Head Shield’ chimera, GFP+ cells were scarce throughout the tissue on both the intact and transected sides (shown in Figure 5A, B where the GFP fluorophore channel was converted to grayscale). The typical cluster of Iba1 labeled microglial cells appeared in the RC subnucleus on the transected side but not on the intact side (magenta in Figure 5a, b). While GFP+ cells that displayed a ramified morphology similar to microglia were present in the tissue, they were at a distance to the RC. In particular, the cells were always affiliated with blood vessels (bv, dotted lines) in a juxtavascular position. Blood vessels were visible in the grayscale images and were also identified with fluorescent Nissl staining (Figure 5b’). These GFP+ cells were ramified with an elongated oval cell body and processes extending from either end. In addition to being at a distance from RC, the juxtavascular cells were usually not stained with Iba1. Though non-ramified GFP+ cells were also scattered throughout the tissue, these were only occasionally near the nTS. Although GFP+ cells were always in areas free of the blood brain barrier, such as the area postrema, neither juxtavascular GFP+ cells nor the non-ramified GFP+ cells were in the RC by 30 days after CTx (Figure 5C-D).
Figure 5.

Bone marrow (BM)-derived cells are not in the nTS. Images at levels R1 and R2 and rotated to the same dorsal (top)-medial (left) orientation; each side for 3 day cases and 30 day case are from the same animal; panels A-G are inverted grayscale epifluorescent images, all other images are 8-10μm z-stacks. GFP identifies BM-derived cells in chimerae; the head was protected from radiation in ‘Head Shield’ chimerae but was not protected in ‘No Head Shield’ chimarae. A. In ‘Head Shield’ chimerae, BM-gfp cells are scarce in the medulla on intact side (int). a, a’. Ramified Iba1+ microglia (magenta) are throughout the tissue but ramified GFP+ cells are outside of RC and affiliate with blood vessels (bv, dashed lines) in a juxtavascular position. B. The GFP+ cells remain scarce on the transected side (tx) after nerve injury. b, b’. The characteristic cluster of Iba1+ microglia (magenta) is in RC and ramified GFP+ cells are outside of RC and associate with the vasculature. The blood vessels are evident in grayscale images and were also identified with fluorescent Nissl staining. C-c’. GFP+ cells are in the area postrema (AP), a region free of the blood brain barrier. D-d’. At 30 days after CT injury, the same pattern of GFP+ cells remains throughout the tissue on the transected side with juxtavascular cells at a distance from RC. E.F. In chimeric animals that received radiation to the head (‘NO Head Shield’) the distribution of GFP+ cells throughout the medulla remains the same on intact and transected sides. e, e’. Juxtavascular GFP+ cells are occasionally faintly stained with Iba1 (asterisk) but they were not in RC. f f’. Intermittently, smaller-sized GFP+ cells that are not ramified are near the nTS but these are never Iba1+ (arrows). IV, fourth ventricle; cc, central canal.
Since studies have suggested that irradiation of the brain tissue is actually necessary for infiltration BM-derived cells following facial nerve axotomy (Mildner et al., 2007), chimerae that had received radiation to the head (‘No Head Shield’) also received CTx. At 3 days after nerve injury the GFP+ cells were sparse throughout the tissue, similar to the ‘Head Shield’ chimerae (Figure 5E, F; GFP shown in grayscale). Again, Iba1+ microglia were normally distributed on the intact side and clustered in RC on the transected side (magenta in Figure 5e, f). In the vicinity of the RC, the GFP-IR was primarily restricted to the ramified juxtavascular cells, which were occasionally faintly positive for Iba1 (asterisk in Figure 5e,e’). The non-ramified GFP+ cells that were rarely near the nTS were not Iba+ (arrow in Figure 5f). GFP+ cells were also in the area postrema (not shown).
In summary, there were no GFP+ /Iba1+ double-labeled cells in the nTS from a total of 27 BM-chimeric mice from 0-30 days CTx (Table 1). These data suggest that BM-derived cells did not contribute to the increased numbers of microglia following CT injury.
Proliferation
In order to test whether microglia undergo proliferation in response to CT damage, the presence of a cell proliferation-associated nuclear protein, Ki67, was tested. In the control condition and the intact side of CTx cases, essentially no Iba1+ microglia expressed Ki67 in the vicinity of CT fibers (Figure 6A,C; Ki67 in green and P2X3+ CT fibers in magenta). In contrast, on the transected side extensive cell proliferation was evident. Specifically, Ki67+ nuclei appeared extensively throughout the area of terminal CT fibers between 1.5 and 3 days post CTx (Figure 6B,D). The Ki67-IR was consistently seen in cells also stained with Iba1, demonstrating that dividing cells were microglia (Figure 6B’, magenta Iba1). Additionally, microglial doublets or pairs of microglial cells in apposition were labeled with Ki67 and were likely the products of division (doublet in Figure 6B’ inset). Such microglial doublets never were observed in control cases, where microglia somata were relatively evenly spaced within the neuropil. By 5 days after injury, dividing microglia returned to normally low levels (Figure 6E).
Astrocytes in the nTS
Lastly, the response of astrocytes in the nTS after CT injury was examined. Since the previous experiment demonstrated that all dividing cells in the nTS were microglia, the level of GFAP staining was used to indicate astrocytic reactivity (Eng, 1985; Ridet et al., 1997). Normally, the medulla stained brightest for GFAP at the outer edges of the medulla with lighter staining throughout the tissue (Figure 7A, uninjured). Similar to previous reports (Pecchi et al., 2007), the GFAP-IR in the vagus motor nucleus (nX) was higher than surrounding structures that had little to no GFAP staining, such as the spinal vestibular nucleus (SpVe; Figure 7A’). The levels of GFAP fluorescence showed that staining in nX (uninjured at day 0) was three-fold higher compared to RC or SpVe. (Figure 7D). Over the course of 3-30 days after CTx, the pattern of GFAP staining on the intact sides remained similar to the uninjured condition with the highest GFAP-IR in the nX (Figure 7 B, C). On the transected sides, however, the GFAP-IR also appeared in the RC and V regions of the nTS. For the most part, the expanded GFAP staining after injury was confined to the nTS (Figure B’, C’). The measurements of GFAP fluorescence showed that the intensity in the RC subnucleus was significantly higher on the transected side (tx, light grey) compared to the intact side at 3 days after injury. This level remained elevated at 15 and 30 days post CTx, at which times the level of GFAP fluorescence was also significantly increased in the adjacent V subnucleus as well as the nX. The intensity of GFAP was not affected in the SpVe and remained constant on both sides at all time points (Figure 7D). In summary, GFAP staining increased in RC by 3 days after injury and remained elevated at 15 and 30 days at which times the staining also increased in V. Further, unlike the microglial responses which were restricted to the nTS, the GFAP fluorescence also increased at 15 and 30 days in the nX.
Figure 7.

The intensity of GFAP staining increases in the nTS and nX after injury to the CT. All images at level R3 and were rotated to the same orientation as panel A; each side at 3 days (B,B’) and 30 days (C,C’) from same animals; scale bar in A’ applies to B-C’; epifluorescent images and 10μm z-stack inserts A. In the uninjured condition (uninj), GFAP staining is brightest at the outer edges of the medulla and lighter throughout the tissue. A’. In relation to the nTS, GFAP-IR is brighter in the vagus motor nucleus (nX) compared to surrounding regions that had little to no staining. B,B’. At 3 days after CT damage GFAP-IR remains similar to normal on the intact side (int) but stretches into the nTS on the transected side (tx). Additionally, compared to the int side astrocytes on the tx side display an activated morphology with larger cell bodies and very thick processes (insets of astrocytes at white arrows). C,C’. By 30 days after injury, GFAP staining is still brighter on the tx side. D. The levels of GFAP fluorescence RC are substantially increased on the tx side compared to the int side by 3 days after injury and remain elevated at 15 and 30 days, at which point the levels in V and nX are also increased. The GFAP fluorescence does not change in the spinal vestibular nuclei (SpVe) on either side. SEM error bars, n=3 each time point, *p≤0.05 compared to intact sides; IV, fourth ventricle.
DISCUSSION
In the current study, peripheral transection of the CT nerve caused significant glial responses in the first central gustatory relay, the nucleus of the solitary tract (nTS). In particular, rapid and robust changes in microglial cells were followed by alterations in astrocytes. By one day after injury, microglia in the vicinity of afferent CT terminals changed their morphology from the characteristic ramified morphology to a hypertrophied reactive morphology, characterized by shorter, thicker processes and an amoeboid ‘bushy’ shape. Morphological transformations were accompanied by an increased number of microglial cells in the RC subnucleus. By 2 days after CTx the number of microglial cells increased significantly in RC, with a three-fold increase by 5 days, then microglial numbers slowly declined, although still elevated for the next two weeks until returning to baseline by 30 days. This increased microglial density resulted primarily from locally dividing microglia and to a lesser extent from microglia that migrated into RC from the subjacent V subnucleus between 2 and 3 days. Specifically, there was no evidence for in-migration of bone marrow (BM)-derived cells. Astrocytes also responded with increased GFAP expression by 3 days following CT damage. This cell population did not proliferate but levels of GFAP remained increased at 30 days by which time microglial responses had resolved.
Microglial cells quickly reacted after CT damage as evidenced by morphological transformations. Though the signals initiating these microglial responses after nerve damage are not entirely clear, the pattern of responsive microglia in regions containing the central nerve terminals of the affected peripheral nerve suggests that the nerve fibers themselves are a source of activating signals. For example, following sciatic nerve injuries (such as chronic constriction injury or peroneral nerve ligation) reactive microglia appeared in the dorsal horn laminas I – III, which receive nociceptive and mechanoreceptive sensory input, as well as the ventral horn lamina IX, where motor neurons reside (Echeverry et al., 2008; Zhang et al., 2008). The most prominent of these microglial response often occurs in regions corresponding to C-fiber input (Beggs and Salter, 2007). C-fiber activity is indeed a source of activating signals to microglia, even in the absence of nerve damage (Beggs et al., 2010; Hathway et al., 2009).
The chorda tympani nerve, however, is restricted to fine caliber Aδ and C-, orspecial visceral gustatory, fibers (Farbman and Hellekant, 1978) that have little to no expression of proteins associated with nociception, such as TRPV1 (Abe et al., 2005; Katsura et al., 2006), Substance P and CGRP (Abe, 2008; Montavon et al., 1996). Hence, injury to the CT nerve does not involve damage to nociceptive C-fibers, a known source of activating signals to microglia. Additionally, CT injury does not involve mechanoreceptive A-fibers or motor fibers, damage to either of which also results in central glial responses (Sheth et al., 2002; Suter et al., 2009; Xu et al., 2007). Nevertheless, microglia reacted in the nTS following CT injury despite the absence of these fiber types. Specifically, these microglial responses were limited to the RC and V subdivisions, which receive afferent terminal projections from the CT nerve. This high degree of spatial confinement strongly suggests that the signal(s) leading to microglial responses is localized to the CT afferent terminals.
Further, the general profile of microglial responses following CT injury, namely reactive morphology and increased density, is similar to nerve injuries that damage pain fibers. For example, the increased microglial density in RC from 2-20 days after CT injury with peak levels at 5 days is similar to the sciatic nerve ligation (SNL) model where the number of microglia in the dorsal horn was 3-4 fold higher than normal at 3 days after injury (Beggs and Salter, 2007). Hence, the current study demonstrates that nociceptive elements are not required for general microglial responses following peripheral nerve damage.
There are, however, unique features of glial responses in the nTS compared to other nerve injuries. For instance, bone marrow (BM)-derived cells, i.e., microglial precursors, were not recruited into the nTS parenchyma with CT injury. Normally, these BM-derived cells are confined to the vasculature or circumventricular regions that lack a blood-brain barrier (Streit et al., 1989). Following pathological insults, such as direct injury to the brain, the BM-cells can migrate through the basal membrane into the parenchyma (Vallieres and Sawchenko, 2003). Similarly, these BM-derived cells can also enter CNS tissue after peripheral nerve injury. For example, upon partial ligation of the sciatic nerve BM-progenitors differentiated into Iba1+ microglia, contributing up to 20% of microglial cells in the affected dorsal and ventral horns (Zhang et al., 2007). Conversely, although BM-derived cells were in the area postrema and affiliated with the vasculature throughout the medulla, these cells did not infiltrate the nTS after CT nerve injury. This difference may be related to fiber signaling. For example, injury to the sciatic nerve involves pain fibers, which leads to increased permeability of the blood brain and spinal cord barriers (Beggs et al., 2010). This increased permeability likely allows BM-derived cells easier access the CNS tissue. Yet this is not the only factor involved in BM-progenitor recruitment since BM- derived cells infiltrate the CNS after facial nerve axotomy, a model in which purely motor fibers are damaged and the blood brain barrier remains intact (Mildner et al., 2007).
Proliferative cells also appeared faster after CT injury than sciatic injuries. Unlike the sciatic nerve ligation model where dividing cells were in the dorsal horn from 3-14 days (Echeverry et al., 2008), dividing cells were in the nTS from 1.5-3 days after CT injury. Additionally, all dividing Ki67+ nuclei in the nTS belonged to Iba1 stained cells, showing that only microglia proliferated. While most dividing cells in the dorsal horn following sciatic nerve ligation were Iba1+ microglia, NG2+ oligodendrocyte precursors and GFAP+ astrocytes were also dividing (Echeverry et al., 2008; Xu et al., 2007). Similarly, a trigeminal nerve injury model also resulted in dividing astrocytes (Xu et al., 2008). The proliferation of only microglial cells and lack of other dividing cell types is another distinct feature of the glial response following CT injury.
Finally, the astrocytic response after CT injury was less prominent than with other nerve injuries. Astrocytes did not proliferate after CT injury as reported with sciatic and trigeminal nerve injuries (Echeverry et al., 2008; Xu et al., 2008). However, astrocytes responded to CT injury with increased levels of GFAP. The increased levels of GFAP in the nTS were still present at 30 days by which time microglial responses had resolved. Hence, despite the lack of newly generated astrocytes, the astrocytic response was more persistent than microglial responses.
The glial responses following CT damage may be involved in central reorganization following nerve injury. In particular, microglia can separate presynaptic axon terminals from postsynaptic neuronal perikarya or dendrites in a process termed synaptic stripping (Trapp et al., 2007). Indeed, the morphological transformations of microglia in the nTS reflect a phagocytic phenotype. The initial stages of microglial reactivity occur regardless of the type and extent of injury and can be recognized morphologically as a slight retraction and partial hypertrophy of microglial processes (Ladeby et al., 2005). However, later stages of reactivity in which microglia further retract their processes and transform into an amoeboid ‘bushy’ shape usually occur under conditions of neuronal and/or terminal degeneration (Davis et al., 1994; Gehrmann et al., 1995). These ‘bushy’ microglia are particularly suggestive of a phagocytic phenotype and are well described in models such as facial nerve axotomy, which results in cellular debris from dying and/or regenerating motoneurons (Streit and Graeber, 1993). As synaptic reorganization also occurs in the nTS after damage to other gustatory nerves (Corson and Hill, 2011), the appearance of ‘bushy’ microglia from 2-20 days after CTx is suggestive of CT fiber degeneration. Additional support of CT degeneration comes from a study using the Fink-Heimer method where transecting the CT resulted in argyrophillic fibers in the rostral nTS that were evident by 2 days and especially prominent between 11-14 days after injury (Whitehead et al., 1995). The presence of ‘bushy’ microglia coupled with argyrophillic fibers might suggest that microglia are phagocytosing degenerating CT terminals.
Reactive microglia can also contribute to neuronal depolarization by releasing substances that increase excitation. For example, in animal models of chronic pain following sciatic nerve damage, reactive microglia in the dorsal horn increase synthesis and secretion of various cytokines such as IL-1β, IL-6 and tumor necrosis factor-α (TNFα). These cytokines can then act on dorsal horn neurons to amplify neuronal excitation and pain signaling (Zhuo et al., 2011). In a similar fashion, the release of cytokines by reactive microglia in the nTS may lead to neuronal activity that underlies sensations such as persistent bitter taste following CT damage (Clark and O’Malley, 2007).
In summary, the current study shows that the general profile of glial responses in the nTS is comparable to that in other nerve injury models, including those that damage pain fibers. The specific differences, such as onset and duration of microglial proliferation, lack of astrocytic proliferation and absence of recruited BM-cells, may point towards different signal(s) that cause glial responses after CT injury. These results could extend the involvement of glial responses to include other sensory phenomena. As in the dorsal horn, where reactive glia release substances that amplify neuronal excitation and pain signaling, a similar neuronal hypersensitization in the nTS may underlie sensations such as persistent bitter taste following CT damage (Clark and O’Malley, 2007). This glial activity might also affect nearby trigeminal fibers, which may further explain the tingling or burning sensation that can arise after CT damage (Eliav et al., 2007). Ultimately, non-neuronal cells may be fruitful targets in the treatment of taste disturbances.
Acknowledgements
The author is especially grateful to Dr. Thomas E. Finger – without his mentorship, support and encouragement this study would not have been possible. A special thanks also goes to Drs. Peter M. Henson and William J. Janssen for the use of bone marrow chimerae animals and advice on related experiments. The author is also thankful to Drs. David Hill, Rebecca Reddaway (UVA) and Dr. Aurelie Vandenbeuch for guidance with chorda tympani surgical procedures, Dr. Mark C. Whitehead (UCSD) for assistance with nTS delineations, Dr. Jennifer M. Stratford for expertise with statistical analysis, Ms. Krista Eckhoff for technical assistance, and Dr. Linda R. Watkins (UC Boulder) for comments on the manuscript. Finally, thanks to reviewers for helpful comments and feedback. Portions of this work are published in the author’s Ph.D. dissertation. This work was supported by NIH grants DC 009762-01 F31 (D.L.B.), RO1 DC00147 and R56 DC00147 (T.E. Finger), P30 DC04657 (T.E. F. and D.R. Restrepo), HL68864 and HL81151 (P.M.Henson), and American Heart Association Grant 0675040N (W.J.Janssen).
REFERENCES
- Abe J, Hosokawa H, Okazawa M, Kandachi M, Sawada Y, Yamanaka K, Matsumura K, Kobayashi S. TRPM8 protein localization in trigeminal ganglion and taste papillae. Brain Res Mol Brain Res. 2005;136(1-2):91–98. doi: 10.1016/j.molbrainres.2005.01.013. [DOI] [PubMed] [Google Scholar]
- Abe K. Studies on taste: molecular biology and food science. Biosci Biotechnol Biochem. 2008;72(7):1647–1656. doi: 10.1271/bbb.70690. [DOI] [PubMed] [Google Scholar]
- Aldskogius H, Kozlova EN. Central neuron-glial and glial-glial interactions following axon injury. Progress in Neurobiology. 1998;55(1):1–26. doi: 10.1016/s0301-0082(97)00093-2. [DOI] [PubMed] [Google Scholar]
- Barry MA, Frank ME. Response of the gustatory system to peripheral-nerve injury. Experimental Neurology. 1992;115(1):60–64. doi: 10.1016/0014-4886(92)90222-c. [DOI] [PubMed] [Google Scholar]
- Beggs S, Liu XJ, Kwan C, Salter MW. Peripheral nerve injury and TRPV1-expressing primary afferent C-fibers cause opening of the blood-brain barrier. Mol Pain. 2010;6:74. doi: 10.1186/1744-8069-6-74. [DOI] [PMC free article] [PubMed] [Google Scholar]
- Beggs S, Salter MW. Stereological and somatotopic analysis of the spinal microglial response to peripheral nerve injury. Brain Behav Immun. 2007;21(5):624–633. doi: 10.1016/j.bbi.2006.10.017. [DOI] [PMC free article] [PubMed] [Google Scholar]
- Cheal M, Oakley B. Regeneration of fungiform taste buds: temporal and spatial characteristics. J Comp Neurol. 1977;172(4):609–626. doi: 10.1002/cne.901720405. [DOI] [PubMed] [Google Scholar]
- Clark MP, O’Malley S. Chorda tympani nerve function after middle ear surgery. Otol Neurotol. 2007;28(3):335–340. doi: 10.1097/01.mao.0000247820.16325.f0. [DOI] [PubMed] [Google Scholar]
- Corson SL, Hill DL. Chorda tympani nerve terminal field maturation and maintenance is severely altered following changes to gustatory nerve input to the nucleus of the solitary tract. J Neurosci. 2011;31(21):7591–7603. doi: 10.1523/JNEUROSCI.0151-11.2011. [DOI] [PMC free article] [PubMed] [Google Scholar]
- Coull JAM, Beggs S, Boudreau D, Boivin D, Tsuda M, Inoue K, Gravel C, Salter MW, De Koninck Y. BDNF from microglia causes the shift in neuronal anion gradient underlying neuropathic pain. Nature. 2005;438(7070):1017–1021. doi: 10.1038/nature04223. [DOI] [PubMed] [Google Scholar]
- Davalos D, Grutzendler J, Yang G, Kim JV, Zuo Y, Jung S, Littman DR, Dustin ML, Gan WB. ATP mediates rapid microglial response to local brain injury in vivo. Nature Neuroscience. 2005;8(6):752–758. doi: 10.1038/nn1472. [DOI] [PubMed] [Google Scholar]
- Davis EJ, Foster TD, Thomas WE. Cellular forms and functions of brain microglia. Brain Res Bull. 1994;34(1):73–78. doi: 10.1016/0361-9230(94)90189-9. [DOI] [PubMed] [Google Scholar]
- DeLeo JA, Tanga FY, Tawfik VL. Neuroimmune activation and neuroinflammation in chronic pain and opioid tolerance/hyperalgesia. Neuroscientist. 2004;10(1):40–52. doi: 10.1177/1073858403259950. [DOI] [PubMed] [Google Scholar]
- Dellarole A, Grilli M. Adult dorsal root ganglia sensory neurons express the early neuronal fate marker doublecortin. J Comp Neurol. 2008;511(3):318–328. doi: 10.1002/cne.21845. [DOI] [PubMed] [Google Scholar]
- Echeverry S, Shi XQ, Zhang J. Characterization of cell proliferation in rat spinal cord following peripheral nerve injury and the relationship with neuropathic pain. Pain. 2008;135(1-2):37–47. doi: 10.1016/j.pain.2007.05.002. [DOI] [PubMed] [Google Scholar]
- Eliav E, Kamran B, Schaham R, Czerninski R, Gracely RH, Benoliel R. Evidence of chorda tympani dysfunction in patients with burning mouth syndrome. J Am Dent Assoc. 2007;138(5):628–633. doi: 10.14219/jada.archive.2007.0234. [DOI] [PubMed] [Google Scholar]
- Eng LF. Glial fibrillary acidic protein (GFAP): the major protein of glial intermediate filaments in differentiated astrocytes. J Neuroimmunol. 1985;8(4-6):203–214. doi: 10.1016/s0165-5728(85)80063-1. [DOI] [PubMed] [Google Scholar]
- Farbman AI, Hellekant G. Quantitative analyses of the fiber population in rat chorda tympani nerves and fungiform papillae. Am J Anat. 1978;153(4):509–521. doi: 10.1002/aja.1001530403. [DOI] [PubMed] [Google Scholar]
- Finger TE, Danilova V, Barrows J, Bartel DL, Vigers AJ, Stone L, Hellekant G, Kinnamon SC. ATP signaling is crucial for communication from taste buds to gustatory nerves. Science. 2005;310(5753):1495–1499. doi: 10.1126/science.1118435. [DOI] [PubMed] [Google Scholar]
- Flugel A, Bradl M, Kreutzberg GW, Graeber MB. Transformation of donor-derived bone marrow precursors into host microglia during autoimmune CNS inflammation and during the retrograde response to axotomy. Journal of Neuroscience Research. 2001;66(1):74–82. doi: 10.1002/jnr.1198. [DOI] [PubMed] [Google Scholar]
- Gao YJ, Ji RR. Targeting astrocyte signaling for chronic pain. Neurotherapeutics. 2010;7(4):482–493. doi: 10.1016/j.nurt.2010.05.016. [DOI] [PMC free article] [PubMed] [Google Scholar]
- Gehrmann J, Matsumoto Y, Kreutzberg GW. Microglia: intrinsic immuneffector cell of the brain. Brain Res Brain Res Rev. 1995;20(3):269–287. doi: 10.1016/0165-0173(94)00015-h. [DOI] [PubMed] [Google Scholar]
- Graeber MB, Bise K, Mehraein P. Synaptic stripping in the human facial nucleus. Acta Neuropathologica. 1993;86(2):179–181. doi: 10.1007/BF00334886. [DOI] [PubMed] [Google Scholar]
- Guagliardo NA, Hill DL. Fungiform taste bud degeneration in C57BL/6J mice following chorda-lingual nerve transection. J Comp Neurol. 2007;504(2):206–216. doi: 10.1002/cne.21436. [DOI] [PMC free article] [PubMed] [Google Scholar]
- Gyoneva S, Orr AG, Traynelis SF. Differential regulation of microglial motility by ATP/ADP and adenosine. Parkinsonism Relat Disord. 2009;15(Suppl 3):S195–199. doi: 10.1016/S1353-8020(09)70813-2. [DOI] [PMC free article] [PubMed] [Google Scholar]
- Hanisch UK, Kettenmann H. Microglia: active sensor and versatile effector cells in the normal and pathologic brain. Nature Neuroscience. 2007;10(11):1387–1394. doi: 10.1038/nn1997. [DOI] [PubMed] [Google Scholar]
- Hathway GJ, Vega-Avelaira D, Moss A, Ingram R, Fitzgerald M. Brief, low frequency stimulation of rat peripheral C-fibres evokes prolonged microglial-induced central sensitization in adults but not in neonates. Pain. 2009;144(1-2):110–118. doi: 10.1016/j.pain.2009.03.022. [DOI] [PMC free article] [PubMed] [Google Scholar]
- Horvath RJ, Romero-Sandoval EA, De Leo JA. Inhibition of microglial P2X4 receptors attenuates morphine tolerance, Iba1, GFAP and mu opioid receptor protein expression while enhancing perivascular microglial ED2. Pain. 2010;150(3):401–413. doi: 10.1016/j.pain.2010.02.042. [DOI] [PMC free article] [PubMed] [Google Scholar]
- Hutchinson MR, Zhang Y, Brown K, Coats BD, Shridhar M, Sholar PW, Patel SJ, Crysdale NY, Harrison JA, Maier SF, Rice KC, Watkins LR. Non-stereoselective reversal of neuropathic pain by naloxone and naltrexone: involvement of toll-like receptor 4 (TLR4) Eur J Neurosci. 2008;28(1):20–29. doi: 10.1111/j.1460-9568.2008.06321.x. [DOI] [PMC free article] [PubMed] [Google Scholar]
- Ichikawa H, Sugimoto T. The co-expression of P2X3 receptor with VR1 and VRL-1 in the rat trigeminal ganglion. Brain Res. 2004;998(1):130–135. doi: 10.1016/j.brainres.2003.11.019. [DOI] [PubMed] [Google Scholar]
- Ito D, Imai Y, Ohsawa K, Nakajima K, Fukuuchi Y, Kohsaka S. Microglia-specific localisation of a novel calcium binding protein, Iba1. Brain Res Mol Brain Res. 1998;57(1):1–9. doi: 10.1016/s0169-328x(98)00040-0. [DOI] [PubMed] [Google Scholar]
- Janssen WJ, Muldrow A, Kearns MT, Barthel L, Henson PM. Development and characterization of a lung-protective method of bone marrow transplantation in the mouse. Journal of Immunological Methods. 2010;357(1-2):1–9. doi: 10.1016/j.jim.2010.03.013. [DOI] [PubMed] [Google Scholar]
- Jung S, Aliberti J, Graemmel P, Sunshine MJ, Kreutzberg GW, Sher A, Littman DR. Analysis of fractalkine receptor CX(3)CR1 function by targeted deletion and green fluorescent protein reporter gene insertion. Molecular and Cellular Biology. 2000;20(11):4106–4114. doi: 10.1128/mcb.20.11.4106-4114.2000. [DOI] [PMC free article] [PubMed] [Google Scholar]
- Katsura H, Tsuzuki K, Noguchi K, Sakagami M. Differential expression of capsaicin-, menthol-, and mustard oil-sensitive receptors in naive rat geniculate ganglion neurons. Chem Senses. 2006;31(7):681–688. doi: 10.1093/chemse/bjl009. [DOI] [PubMed] [Google Scholar]
- King MS. Anatomy of the rostral nucleus of the solitary tract. In: Bradley RM, editor. The role of the nucleus of the solitary tract in gustatory processing. Boca Raton: Taylor & Francis Group, LLC.; 2007. pp. 17–38. [Google Scholar]
- Kohsaka S, Ohsawa K, Sasaki Y, Imai Y. The function of Iba1 underlying the activation of microglia. Journal of Neurochemistry. 2003;87:15–15. [Google Scholar]
- Kreutzberg GW. Microglia: A sensor for pathological events in the CNS. Trends in Neurosciences. 1996;19(8):312–318. doi: 10.1016/0166-2236(96)10049-7. [DOI] [PubMed] [Google Scholar]
- Ladeby R, Wirenfeldt M, Garcia-Ovejero D, Fenger C, Dissing-Olesen L, Dalmau I, Finsen B. Microglial cell population dynamics in the injured adult central nervous system. Brain Res Brain Res Rev. 2005;48(2):196–206. doi: 10.1016/j.brainresrev.2004.12.009. [DOI] [PubMed] [Google Scholar]
- Lloyd S, Meerton L, Di Cuffa R, Lavy J, Graham J. Taste change following cochlear implantation. Cochlear Implants Int. 2007;8(4):203–210. doi: 10.1179/cim.2007.8.4.203. [DOI] [PubMed] [Google Scholar]
- Mangold JE, Hill DL. Postnatal reorganization of primary afferent terminal fields in the rat gustatory brainstem is determined by prenatal dietary history. Journal of Comparative Neurology. 2008;509(6):594–607. doi: 10.1002/cne.21760. [DOI] [PMC free article] [PubMed] [Google Scholar]
- Mayhew TM, Gundersen HJG. ‘If you assume, you can make an ass out of u and me’: A decade of the disector for stereological counting of particles in 3D space. Journal of Anatomy. 1996;188:1–15. [PMC free article] [PubMed] [Google Scholar]
- Mildner A, Schmidt H, Nitsche M, Merkler D, Hanisch UK, Mack M, Heikenwalder M, Bruck W, Priller J, Prinz M. Microglia in the adult brain arise from Ly-6ChiCCR2+ monocytes only under defined host conditions. Nat Neurosci. 2007;10(12):1544–1553. doi: 10.1038/nn2015. [DOI] [PubMed] [Google Scholar]
- Milligan ED, Sloane EM, Watkins LR. Glia in pathological pain: a role for fractalkine. J Neuroimmunol. 2008;198(1-2):113–120. doi: 10.1016/j.jneuroim.2008.04.011. [DOI] [PMC free article] [PubMed] [Google Scholar]
- Miya K, Inoue R, Takata Y, Abe M, Natsume R, Sakimura K, Hongou K, Miyawaki T, Mori H. Serine racemase is predominantly localized in neurons in mouse brain. The Journal of Comparative Neurology. 2008;510(6):641–654. doi: 10.1002/cne.21822. [DOI] [PubMed] [Google Scholar]
- Montavon P, Hellekant G, Farbman A. Immunohistochemical, electrophysiological, and electron microscopical study of rat fungiform taste buds after regeneration of chorda tympani through the non-gustatory lingual nerve. J Comp Neurol. 1996;367(4):491–502. doi: 10.1002/(SICI)1096-9861(19960415)367:4<491::AID-CNE2>3.0.CO;2-#. [DOI] [PubMed] [Google Scholar]
- Nimmerjahn A, Kirchhoff F, Helmchen F. Resting microglial cells are highly dynamic surveillants of brain parenchyma in vivo. Science. 2005;308(5726):1314–1318. doi: 10.1126/science.1110647. [DOI] [PubMed] [Google Scholar]
- Nin T, Sakagami M, Sone-Okunaka M, Muto T, Mishiro Y, Fukazawa K. Taste function after section of chorda tympani nerve in middle ear surgery. Auris Nasus Larynx. 2006;33(1):13–17. doi: 10.1016/j.anl.2005.07.015. [DOI] [PubMed] [Google Scholar]
- Paxinos G, Franklin KBJ. The mouse brain in stereotaxic coordinates. Second edition Academic Press; 2001. [Google Scholar]
- Pecchi E, Dallaporta M, Charrier C, Pio J, Jean A, Moyse E, Troadec JD. Glial fibrillary acidic protein (GFAP)-positive radial-like cells are present in the vicinity of proliferative progenitors in the nucleus tractus solitarius of adult rat. J Comp Neurol. 2007;501(3):353–368. doi: 10.1002/cne.21259. [DOI] [PubMed] [Google Scholar]
- Perry VH, Anthony DC, Bell MD, Lawson LJ, Reid DM, Gordon S. Microglia activation and inflammation in the CNS. Journal of Neurochemistry. 1996;66:S70–S70. [Google Scholar]
- Priller J, Flugel A, Wehner T, Boentert M, Haas CA, Prinz M, Fernandez-Klett F, Prass K, Bechmann I, de Boer BA, Frotscher M, Kreutzberg GW, Persons DA, Dirnagl U. Targeting gene-modified hematopoietic cells to the central nervous system: Use of green fluorescent protein uncovers microglial engraftment. Nature Medicine. 2001;7(12):1356–1361. doi: 10.1038/nm1201-1356. [DOI] [PubMed] [Google Scholar]
- Ridet JL, Malhotra SK, Privat A, Gage FH. Reactive astrocytes: cellular and molecular cues to biological function. Trends Neurosci. 1997;20(12):570–577. doi: 10.1016/s0166-2236(97)01139-9. [DOI] [PubMed] [Google Scholar]
- Schwaiberger AV, Heiss EH, Cabaravdic M, Oberan T, Zaujec J, Schachner D, Uhrin P, Atanasov AG, Breuss JM, Binder BR, Dirsch VM. Indirubin-3′-monoxime blocks vascular smooth muscle cell proliferation by Inhibition of signal transducer and activator of transcription 3 signaling and reduces neointima formation in vivo. Arteriosclerosis, Thrombosis, and Vascular Biology. 2010;30:2475–2481. doi: 10.1161/ATVBAHA.110.212654. [DOI] [PubMed] [Google Scholar]
- Sheth RN, Dorsi MJ, Li Y, Murinson BB, Belzberg AJ, Griffin JW, Meyer RA. Mechanical hyperalgesia after an L5 ventral rhizotomy or an L5 ganglionectomy in the rat. Pain. 2002;96(1-2):63–72. doi: 10.1016/s0304-3959(01)00429-8. [DOI] [PubMed] [Google Scholar]
- Stratford JM, Finger TE. Central representation of postingestive chemosensory cues in mice that lack the ability to taste. J Neurosci. 2011;31(25):9101–9110. doi: 10.1523/JNEUROSCI.0404-11.2011. [DOI] [PMC free article] [PubMed] [Google Scholar]
- Streit WJ, Graeber MB. Heterogeneity of microglial and perivascular cell populations: insights gained from the facial nucleus paradigm. Glia. 1993;7(1):68–74. doi: 10.1002/glia.440070112. [DOI] [PubMed] [Google Scholar]
- Streit WJ, Graeber MB, Kreutzberg GW. Expression of Ia antigen on perivascular and microglial cells after sublethal and lethal motor neuron injury. Exp Neurol. 1989;105(2):115–126. doi: 10.1016/0014-4886(89)90111-8. [DOI] [PMC free article] [PubMed] [Google Scholar]
- Streit WJ, Walter SA, Pennell NA. Reactive microgliosis. Prog Neurobiol. 1999;57(6):563–581. doi: 10.1016/s0301-0082(98)00069-0. [DOI] [PubMed] [Google Scholar]
- Suter MR, Berta T, Gao YJ, Decosterd I, Ji RR. Large A-fiber activity is required for microglial proliferation and p38 MAPK activation in the spinal cord: different effects of resiniferatoxin and bupivacaine on spinal microglial changes after spared nerve injury. Molecular Pain. 2009:5. doi: 10.1186/1744-8069-5-53. [DOI] [PMC free article] [PubMed] [Google Scholar]
- Trapp BD, Wujek JR, Criste GA, Jalabi W, Yin X, Kidd GJ, Stohlman S, Ransohoff R. Evidence for synaptic stripping by cortical microglia. Glia. 2007;55(4):360–368. doi: 10.1002/glia.20462. [DOI] [PubMed] [Google Scholar]
- Tsuda M, Inoue K, Salter MW. Neuropathic pain and spinal microglia: a big problem from molecules in ‘small’ glia. Trends in Neurosciences. 2005;28(2):101–107. doi: 10.1016/j.tins.2004.12.002. [DOI] [PubMed] [Google Scholar]
- Vallieres L, Sawchenko PE. Bone marrow-derived cells that populate the adult mouse brain preserve their hematopoietic identity. J Neurosci. 2003;23(12):5197–5207. doi: 10.1523/JNEUROSCI.23-12-05197.2003. [DOI] [PMC free article] [PubMed] [Google Scholar]
- Varga T, Palkovits M, Usdin TB, Dobolyi A. The medial paralemniscal nucleus and its afferent neuronal connections in rat. J Comp Neurol. 2008;511(2):221–237. doi: 10.1002/cne.21829. [DOI] [PMC free article] [PubMed] [Google Scholar]
- Wake H, Moorhouse AJ, Jinno S, Kohsaka S, Nabekura J. Resting Microglia Directly Monitor the Functional State of Synapses In Vivo and Determine the Fate of Ischemic Terminals. Journal of Neuroscience. 2009;29(13):3974–3980. doi: 10.1523/JNEUROSCI.4363-08.2009. [DOI] [PMC free article] [PubMed] [Google Scholar]
- Whitehead MC. Subdivisions and neuron types of the nucleus of the solitary tract that project to the parabrachial nucleus in the hamster. J Comp Neurol. 1990;301(4):554–574. doi: 10.1002/cne.903010406. [DOI] [PubMed] [Google Scholar]
- Whitehead MC, Frank ME. Anatomy of the Gustatory System in the Hamster - Central Projections of the Chorda Tympani and the Lingual Nerve. Journal of Comparative Neurology. 1983;220(4):378–395. doi: 10.1002/cne.902200403. [DOI] [PubMed] [Google Scholar]
- Whitehead MC, McGlathery ST, Manion BG. Transganglionic degeneration in the gustatory system consequent to chorda tympani damage. Experimental Neurology. 1995;132(2):239–250. doi: 10.1016/0014-4886(95)90029-2. [DOI] [PubMed] [Google Scholar]
- Xu M, Aita M, Chavkin C. Partial Infraorbital Nerve Ligation as a Model of Trigeminal Nerve Injury in the Mouse: Behavioral, Neural, and Glial Reactions. Journal of Pain. 2008;9(11):1036–1048. doi: 10.1016/j.jpain.2008.06.006. [DOI] [PMC free article] [PubMed] [Google Scholar]
- Xu M, Bruchas MR, Ippolito DL, Gendron L, Chavkin C. Sciatic nerve ligation-induced proliferation of spinal cord astrocytes is mediated by kappa opioid activation of p38 mitogen-activated protein kinase. J Neurosci. 2007;27(10):2570–2581. doi: 10.1523/JNEUROSCI.3728-06.2007. [DOI] [PMC free article] [PubMed] [Google Scholar]
- Yao ST, Barden JA, Lawrence AJ. On the immunohistochemical distribution of ionotropic P2X receptors in the nucleus tractus solitarius of the rat. Neuroscience. 2001;108(4):673–685. doi: 10.1016/s0306-4522(01)00438-9. [DOI] [PubMed] [Google Scholar]
- Yasumatsu K, Kusuhara Y, Shigemura N, Ninomiya Y. Recovery of two independent sweet taste systems during regeneration of the mouse chorda tympani nerve after nerve crush. Eur J Neurosci. 2007;26(6):1521–1529. doi: 10.1111/j.1460-9568.2007.05761.x. [DOI] [PubMed] [Google Scholar]
- Zhang FX, Vadakkan KI, Kim SS, Wu LJ, Shang Y, Zhuo M. Selective activation of microglia in spinal cord but not higher cortical regions following nerve injury in adult mouse. Molecular Pain. 2008:4. doi: 10.1186/1744-8069-4-15. [DOI] [PMC free article] [PubMed] [Google Scholar]
- Zhang J, Shi XQ, Echeverry S, Mogil JS, De Koninck Y, Rivest S. Expression of CCR2 in both resident and bone marrow-derived microglia plays a critical role in neuropathic pain. J Neurosci. 2007;27(45):12396–12406. doi: 10.1523/JNEUROSCI.3016-07.2007. [DOI] [PMC free article] [PubMed] [Google Scholar]
- Zhuo M, Wu G, Wu LJ. Neuronal and microglial mechanisms of neuropathic pain. Mol Brain. 2011;4:31. doi: 10.1186/1756-6606-4-31. [DOI] [PMC free article] [PubMed] [Google Scholar]