Abstract
Objective
To utilize ability of MRI to investigate age related changes in zonal prostatic volumes.
Materials and Methods
This IRB approved, HIPAA compliant study consists 503 patients who underwent 3Tesla prostate MRI prior to any treatment for prostate cancer. Whole prostate (WP), central gland (CG) volumes were manually contoured on T2W MRI using a semi-automated segmentation tool. WP, CG, peripheral zone (PZ) volumes were measured for each patient. WP, CG, PZ volumes were correlated with age, serum PSA, IPSS, SHIM scores.
Results
Linear regression analysis demonstrated positive correlation between WP, CG volumes and patient age (p<0.0001); there was no correlation between age and PZ volume (p=0.173). There was positive correlation between WP, CG volumes and serum PSA (p<0.0001), as well as between PZ volume and serum PSA (p=0.0021). At logistic regression analysis, IPSS positively correlated with WP, CG volumes (p<0.0001). SHIM positively correlated with WP (p<0.0149), CG (p<0.0234) volumes. As expected, IPSS of patients with prostate volumes (WP, CG) in 1st decile for age were significantly lower than those in 10th decile.
Conclusion
Prostate MRI is able to document age related changes in zonal prostate volumes. Changes in WP, CG volumes correlated inversely with changes in lower urinary tract symptoms. These findings suggest a role for MRI in measuring accurate zonal volumes, have interesting implications for study of age related changes in prostate.
Keywords: BPH, MRI, prostate zonal volumes
Introduction
Unlike many other organs which atrophy with age, as men age, the volume of their prostate usually increases mostly due to benign prostatic hyperplasia (BPH) (1-6). However, the rate at which BPH develops is highly variable. Methods of measuring prostate volume include estimates from the digital rectal examination (DRE) and Transrectal ultrasound (TRUS) measurements that assume that the prostate is a 3 dimensional ellipsoid. Both methods are acknowledged to be inaccurate and neither method can differentiate central gland (CG) volume, the site of most BPH, from peripheral zone (PZ) volume. Prostate MRI, utilizing high resolution T2 weighted MRI scans readily discriminates between the CG and the PZ and therefore, it is straightforward to determine both zonal and overall prostate volumes. However, few studies have attempted to correlate MRI related zonal prostate volumes with age, voiding symptoms or sexual health. A large cross sectional study of men at different ages could result in a better understanding of the natural history of BPH which could be used to design preventive and treatment strategies. In this study we examine changes of zonal prostate volume with age and its association with clinical symptoms by using volumes obtained by prostate MRI in a large cohort of men.
Materials and Methods
Study Design and Patient Population
This institutional review board (IRB) approved, Health Insurance Portability and Accountability Act (HIPAA)-compliant retrospective study was conducted in a single institution. It included a cross-sectional cohort of 503 patients who were referred for prostate MRI due to rising PSA without any prior cancer treatment between November 2005 and October 2010. Mean age of the participants was 60.5 years (median 60 years, range 38-83 years), and the mean serum prostate specific antigen (PSA) value was 8.2 ng/ml (median 5.5ng/dl, range 0.2-103 ng/ml).
MRI Data Acquisition
All MRI studies were performed using a combination of an endorectal coil (BPX-15 or BPX-30, Medrad, Pittsburgh, PA, USA) tuned to 127.8 MHz and a cardiac coil (6 or 16-channel) (SENSE, Philips Medical Systems, Best, The Netherlands) on a 3T magnet (Achieva, Philips Medical Systems, Best, the Netherlands) without prior bowel preparation. In order to use the 1.5T endorectal coil (BPX-15) at 3T, it was tuned to 128.78 MHz using a Pi matching network and interfaced to the scanner through a research coil interface box (Philips Healthcare, Cleveland, OH). The MR imaging protocol included triplanar (sagittal, axial, and coronal) T2W turbo spin-echo (TSE), DW MRI, multi-voxel 3D MR Spectroscopy Imaging (3D MRSI), axial pre-contrast T1W, axial 3D fast field echo dynamic contrast-enhanced (DCE) MRI sequences; however for determining prostate volumes only T2W MR images were used. The scanning parameters for T2W TSE images were as follows: scan resolution 0.461 × 0.598 × 3.0 mm3; field of view (FOV), 140 × 140 mm2; TR/TE, 8869/120 ms; flip angle (FA), 90°; slice thickness, 3 mm without gaps; image reconstruction, 512 × 512.
Prostate Volume Measurement
The whole prostate (WP) gland and central gland (CG) were manually contoured on axial T2W MR images using a semi-automated prostate segmentation tool. The semi-automatic segmentation software was developed using C++ programming language based on open source toolkits including Insight Toolkit 3.12 (7), Visualization Toolkit 5.4.2 (8), and Fast Light Toolkit 1.1.9 (9). The algorithm for automatic initialization and segmentation of the mid-gland slices shares the same framework as the method presented in (10). The method requires training of an incorporated shape model using a set of prostate contours manually delineated on MR prostate images obtained using the same imaging protocol as the images to be segmented. The segmented shape is stored as a mesh for output and visualization. The software allowed calculation of both WP and CG volumes and the volume of the peripheral zone (PZ) was calculated by subtracting the CG volume from WP volume (Figure 1).
Figure 1.
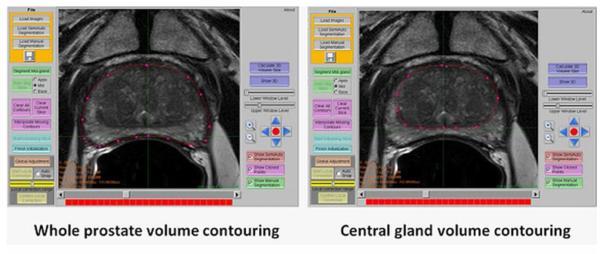
Screen capture of the software used to contour the whole prostate and central gland for volume calculation.
To validate accuracy of MRI derived volumes, whole prostate volumes of 47 patients (whom underwent radical prostatectomy) derived with MRI were compared with their specimen weights (supplementary data 1).
Symptom Scores
International prostate symptom score (IPSS) and sexual health inventory for men (SHIM) scores of the patients were obtained within one week of the MRI. Scores were correlated with WP, CG and PZ volumes.
Statistical Analysis
The relationship between WP, CG, PZ volumes, PZ /CG volume ratio (PZ:CG) and patient age, serum PSA levels were evaluated by linear regression analysis, whereas the correlation between zonal prostate volumes and IPSS, SHIM scores were assessed with logistic regression. Additionally, to evaluate the effects of tumors on prostatic contours, patients were divided into 2 groups, where group 1 included patients with tumor(s) that did not affect the prostate‘s outer or zonal contours while group 2 included patients with tumor(s) affecting either overall or zonal prostate contours. WP, CG, PZ volumes, PZ:CG volume ratio, age, serum PSA values, IPSS, SHIM scores of these 2 groups were compared using the t-test
To predict WP, CG, PZ volumes and PZ:CG volume ratio, a multivariate analysis was conducted using a standard least squares regression model including age, serum PSA, IPSS, SHIM scores. Additionally, to predict IPSS, SHIM scores, a multivariate analysis was performed using age, serum PSA, WP, CG volumes and PZ:CG volume ratio.
Finally, a separate analysis was conducted to compare mean IPSS, SHIM scores of patients in the 1st and 10th age specific decile for WP, CG, PZ volumes. The t-test was used for this analysis.
Results
Initial comparison of MRI derived whole prostate volumes with prostatectomy specimen weights revealed a strong positive correlation (r2=0.863) (supplement data 1).
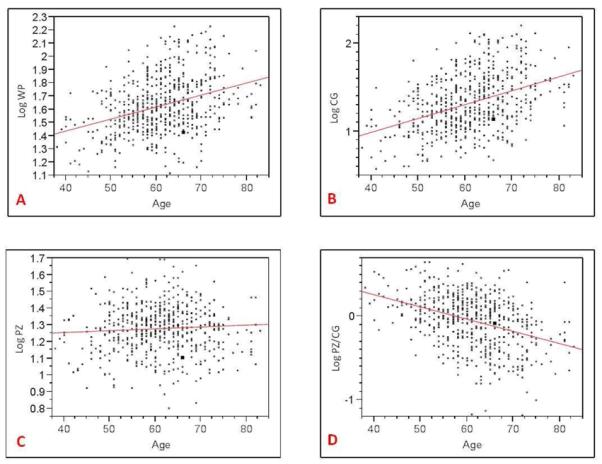
In our study population, the mean age was 60.5 years (median 60, range 38 to 83 years). Mean serum PSA was 8.2 ng/ml (median 5.5, range 0.2 ng/ml to 103 ng/ml). Mean WP, CG, PZ volumes calculated on MRI were 47.5cc (median 39.6cc, range 13-169.8cc), 27.6cc (median 19.4cc, range 3.7-159.3cc), 19.8cc (median 19.8cc, range 6.3-49.7cc), respectively, however results varied widely according to age (Table 1).
Table 1.
Relationship between age and whole prostate (A), central gland (B), peripheral zone (C), PZ/CG volume ratio (D).
|
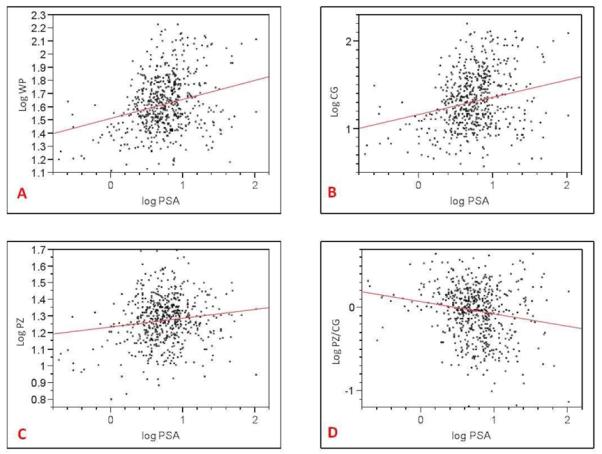
At linear regression analysis, there was a positive correlation between WP (r2=0.132) and CG (r2=0.161) volume and patient age (p<0.0001). There was a negative correlation between the PZ:CG ratio and patient age (r2=0.148) (p<0.0001) indicating that the PZ remains relatively static in volume with age. There was no correlation between age and PZ volume (p=0.173); whereas the CG increases with age (Table 1). There was a positive correlation between WP (r2=0.66), CG (r2=0.52) volume and serum PSA (p<0.0001), as well as between PZ volume and serum PSA (r2=0.19) (p=0.0021); whereas there was a negative correlation between PZ:CG ratio and serum PSA (r2=0.30) (p<0.0001) (Table 2). Additionally, there was a weak correlation between serum PSA and age (r2=0.08) (p=0.048).
Table 2.
Relationship between serum PSA and whole prostate (A), central gland (B), peripheral zone (C), PZ/CG volume ratio (D).
|
For logistic regression model analysis, IPSS scores of patients were divided into 3 (group 1 [mild]=0-7; group 2 [moderate]=8-19, group 3 [severe]=20+). IPSS score severity positively correlated with WP and CG volumes (p<0.0001); whereas it negatively correlated with PZ:CG ratio ((p=0.0002). Although no threshold WP or CG volume could be assessed to predict severity of micturition symptoms, severe symptoms were not encountered in patients with WP and CG volumes of <20cc and <8cc, respectively (supplement data 2).
SHIM scores of patients were divided into 5 groups (group 1=22-25, group 2=17-21, group 3=12-16, group 4=8-11, group 5=0-7). SHIM score severity positively correlated with WP (p<0.0149) and CG (p<0.0234) volumes; whereas it negatively correlated with PZ:CG ratio (p<0.0098). PZ volume demonstrated no correlation with IPSS and SHIM scores.
When comparing patients who had contour-deforming tumors with patients without contour-deforming tumors, the mean WP volume was, interestingly, significantly larger in the latter group (49.2cc vs. 35.3cc, p=0.0003). In other words, smaller prostate glands were associated with more pronounced growth of cancers, perhaps because such growth was more apparent. Consistent with this finding, the mean CG volume was also larger in the unaffected contour group (29.2cc vs. 16.1cc, p=0.0002) and the mean IPSS score was also higher (9.5 vs. 6.6, p=0.0217); on the other hand PZ volume, age, serum PSA, SHIM scores were not different.
Multivariate analysis to predict WP, CG, PZ volumes and PZ:CG volume ratio by using patient age, serum PSA, IPSS, SHIM scores revealed that patient age, serum PSA and IPSS scores were found to be significant predictors (Table 3). Multivariate analysis to predict IPSS, SHIM scores by using age, serum PSA, WP, CG, PZ volumes and PZ:CG volume ratio revealed that the most predictive factors were patient age, and CG volume (Table 4).
Table 3.
Result of multivariate analysis to predict WP, CG, PZ volumes and PZ:CG volume ratio by using patient age, serum PSA, IPSS, SHIM scores. Patient age, serum PSA and IPSS score were found as significant predictors of total prostate, central gland volumes and PZ:CG volume ratio.
| Predictors | Total Volume |
CG Volume | PZ volume | PZ:CG ratio |
|---|---|---|---|---|
| Age | P < 0.0001 | P < 0.0001 | P = 0.6304 | P < 0.0001 |
| PSA | P = 0.0010 | P = 0.0043 | P = 0.2573 | P = 0.0182 |
| IPSS | P = 0.0063 | P = 0.0014 | P = 0.5071 | P = 0.0034 |
| SHIM | P = 0.5964 | P = 0.7357 | P = 0.9625 | P = 0.7132 |
Table 4.
Result of multivariate analysis to predict IPSS, SHIM scores by using age, serum PSA, WP, CG, and PZ:CG volume ratio. Patient age was found to predict both IPSS and SHIM scores, whereas CG volume was found to predict IPSS score.
| Predictors | IPSS | SHIM |
|---|---|---|
| Age | P = 0.0342 | P = 0.0003 |
| PSA | P = 0.7524 | p = 0.3744 |
| Total volume | P = 0.5345 | P = 0.9907 |
| CG volume | P = 0.0131 | P = 0.3596 |
| Interaction (TV vs CZ) | P = 0.6485 | P = 0.5683 |
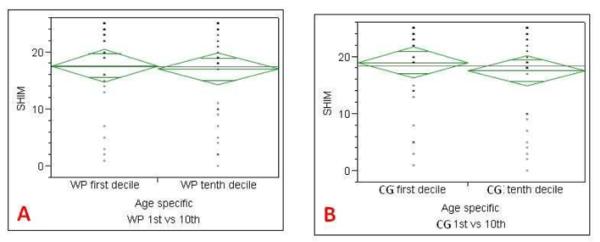
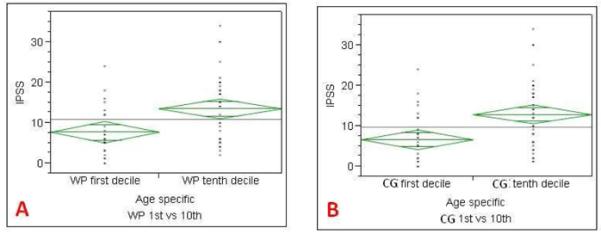
Comparison of the IPSS and SHIM scores with 1st and 10th decile age specific zonal volumes was performed for WP and CG volumes, but not for PZ volume since no correlation was present at the logistic regression analysis. The IPSS score of patients with WP and CG volumes in the age specific 1st decile (adjusted for age) were significantly lower than those of patients in the 10th decile (Tables 5-7).
Table 5.
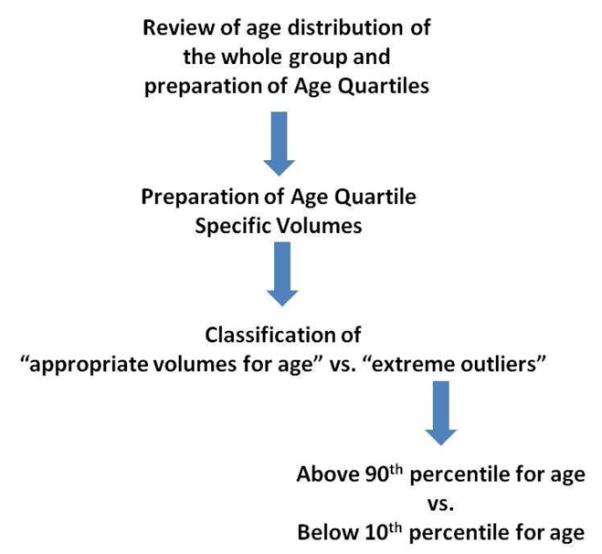
Flow chart used to classify the extreme outliers for age specific volumes.
|
Table 7.
Comparison of SHIM scores of 1st and 10th deciles of age specific whole prostate (A), central gland (B) volumes. SHIM score of age specific 1st peripheral zone decile was not significantly different for whole prostate and central gland volumes.
|
Discussion
Our results indicate that high resolution T2 weighted MRI can be used to determine whole gland and zonal anatomy, which in turn, can be used to study the effects of zonal prostate volumes on clinical symptom. Not surprisingly, CG and WP volumes increase with age and serum PSA, however, PZ volume had no correlation with age and only a weak correlation with PSA. These findings are consistent with the concept that the central gland is the major determinant factor in benign prostatic hyperplasia and elevated serum PSA (11, 12). Although few previous studies reported longitudinal changes of prostate volume with age in small to medium sized cohorts by using serial MRI measurements (e.g. Williams et al in 64 patients, Loeb et al in 278 patients) (13, 14), to the best of our knowledge, the current study is the largest aiming to correlate baseline MRI derived zonal volumes of the prostate with age, serum PSA and symptomatology. Our data suggests that the whole prostate volume peaks in the 6th and 7th decades of life and is mainly driven by changes in the CG volume, while PZ volumes remain stable or slightly decrease during aging. Rhodes et al. reported a similar increase in prostate volume with advancing age in a cohort of 631 men, who underwent prostate volume determinations on transrectal ultrasound (TRUS) (15), however, in that study the relative contribution of CG and PZ could not be discerned.
Serum PSA levels increase proportionately with the volume of BPH tissue, which is characterized by variable stromal and epithelial hyperplasia (16). In this study, a positive correlation was observed between serum PSA values and WP and CG volumes; whereas there was no correlation between PSA and PZ volume. Our results are similar to those in previous studies reporting a positive correlation between serum PSA and prostate volume (2, 17); however correlation in this trial could be skewed by the presence of variable amounts of cancer in some patients (18, 19).
An important consequence of BPH is its effect on lower urinary tract symptoms and sexual health. Logistic regression revealed a positive correlation between IPSS score and WP, CG volumes. Similarly, the SHIM score had a positive correlation with WP, CG volumes, but not with PZ volume. Using a multi-variable analysis model (which included patient age, serum PSA, WP, CG, PZ volumes, PZ:CG volume ratio) revealed that patient age and CG volume were significant predictors for IPSS score, whereas patient age was the only predictor for SHIM score. Kaplan et al. reported that CG volume may serve as a useful parameter for evaluating patients with worsening urinary outlet obstruction in a cohort of 61 men, who had their prostate volumes measured on ultrasound (20). Girman et al. observed a modest positive correlation between prostate volume and IPSS score in 2115 men, who had TRUS measured volumes (21). However, this was contradicted by Sauver et al. who reported only a weak correlation between CG volume and urinary symptoms in a cohort of 336 patients (22). Our overall findings are similar, showing a modest correlation between prostate volumes and IPSS. Interestingly, a more detailed analysis of patients in the 1st decile of volume for age compared to patients in the 10th decile of volume for age This revealed that IPSS scores from the 1st decile of WP and CG volumes were significantly lower than those of patients in the 10th decile (for WP: 7.7 (1st) vs. 13.5 (10th); for CG: 6.6 (1st) vs. 13 (10th)).
Our study has a number of limitations. First, many of the patients in this study had prostate cancer. Indeed, it is difficult to find a cohort of men in this age cohort in whom prostate cancer can reliably be excluded. As a result it is likely that the PSA measurements are somewhat higher than a population consisting only of patients with BPH. Another limitation is that we were unable to follow patients longitudinally and had to rely on a cross sectional design. Although we did not perform a longitudinal study, our findings are similar to those of Williams et al. who also reported a peak increase in volume between mid 5th and mid 6th decades (13). Longitudinal data may be a byproduct of the growing number of patients who have low risk prostate cancer, and who are undergoing active surveillance with annual MRI and semiannual biopsy. This longitudinal data will become available in the next few years. Finally, we did not include quantitative lab values such as urine flow studies (for IPSS) or serum testosterone (for SHIM score) which may have provided insight into the correlations we observed.
Conclusions
In conclusion, high resolution T2 weighted MRI scans can provide accurate measurements of zonal volumes and total volumes which correlate with prostate weight. Because of its ability to differentiate the central and peripheral zones of the prostate, MRI can be used to identify the main driver of prostate volume, BPH. Changes in whole prostate and central gland volumes correlates with lower urinary tract symptoms; whereas changes in the peripheral zone volumes correlate with changes in sexual health. Overall prostate and zonal volumes can be used to better understand the etiology of lower urinary tract symptoms of men. Longitudinal studies with MRI, which will be a byproduct of the increasing number of men followed during active surveillance will reveal the kinetics of prostate volume changes with age.
Supplementary Material
Supplement data 1: Linear regression analysis to validate accuracy of the MRI derived prostate volumes. MRI derived volumes of 47 patients (median age 60.6years, median serum PSA 5.15ng/dl), who underwent radical prostatectomy were compared with radical prostatectomy specimen weights. There was a strong positive correlation between MRI derived whole prostate volumes and specimen weights (R2= 0.863).
Supplement data 2: Whole prostate (A) and central gland (B) volumes vs. IPSS severity. Although no threshold WP or CG volume could be assessed to predict severity of micturition symptoms, high IPSS scores indicating severe micturition symptoms were not encountered in patients with WP and CG volumes of <20cc and <8cc, respectively.
Table 6.
Comparison of IPSS scores of 1st and 10th deciles of age specific whole prostate (A), central gland (B) volumes. IPSS score of age specific 1st whole prostate and central gland volume deciles were significantly lower than those of the 10th decile.
|
Contributor Information
Baris Turkbey, NCI, NIH, Molecular Imaging Program.
Marcelino Bernardo, NCI, NIH, Molecular Imaging Program.
Peter Pinto, National Cancer Institute - Urological Oncology Branch, Center for Cancer Research.
References
- 1.Berry SJ, Coffey DS, Walsh PC, Ewing LL. The development of human benign prostatic hyperplasia with age. J Urol. 1984;132:474–9. doi: 10.1016/s0022-5347(17)49698-4. [DOI] [PubMed] [Google Scholar]
- 2.Oesterling JE, Jacobsen SJ, Chute CG, Guess HA, Girman CJ, Panser LA, Lieber MM. Serum prostate-specific antigen in a community-based population of healthy men. Establishment of age-specific reference ranges. JAMA. 1993;270:860–4. [PubMed] [Google Scholar]
- 3.Roehrborn CG, Lee M, Meehan A, Waldstreicher J, PLESS Study Group Effects of finasteride on serum testosterone and body mass index in men with benign prostatic hyperplasia. Urology. 2003;62:894–9. doi: 10.1016/s0090-4295(03)00661-7. [DOI] [PubMed] [Google Scholar]
- 4.Jacobsen SJ, Jacobson DJ, Girman CJ, Roberts RO, Rhodes T, Guess HA, Lieber MM. Natural history of prostatism: risk factors for acute urinary retention. J Urol. 1997;158:481–7. doi: 10.1016/s0022-5347(01)64508-7. [DOI] [PubMed] [Google Scholar]
- 5.Roberts RO, Jacobsen SJ, Jacobson DJ, Rhodes T, Girman CJ, Lieber MM. Longitudinal changes in peak urinary flow rates in a community based cohort. J Urol. 2000;163:107–13. [PubMed] [Google Scholar]
- 6.Anderson JB, Roehrborn CG, Schalken JA, Emberton M. The progression of benign prostatic hyperplasia: examining the evidence and determining the risk. Eur Urol. 2001;39:390–9. doi: 10.1159/000052475. [DOI] [PubMed] [Google Scholar]
- 7. http://www.itk.org/
- 8. http://www.vtk.org/
- 9. http://www.fltk.org/
- 10.Yan P, Xu S, Turkbey B, Kruecker J. Discrete Deformable Model Guided by Partial Active Shape Model for TRUS Image Segmentation. IEEE Trans. Biomedical Engineering. 2010;57:1158–66. doi: 10.1109/TBME.2009.2037491. [DOI] [PMC free article] [PubMed] [Google Scholar]
- 11.Corica FA, Jacobsen SJ, King BF, Bostwick DG, Jacobson DJ, Girman CJ, Lieber MM. Prostatic central zone volume, lower urinary tract symptom severity and peak urinary flow rates in community dwelling men. J Urol. 1999;161:831–4. [PubMed] [Google Scholar]
- 12.Hochberg DA, Armenakas NA, Fracchia JA. Relationship of prostate-specific antigen and prostate volume in patients with biopsy proven benign prostatic hyperplasia. Prostate. 2000;45:315–9. doi: 10.1002/1097-0045(20001201)45:4<315::aid-pros5>3.0.co;2-2. [DOI] [PubMed] [Google Scholar]
- 13.Williams AM, Simon I, Landis PK, Moser C, Christens-Barry W, Carter HB, Metter EJ, Partin AW. Prostatic growth rate determined from MRI data: age-related longitudinal changes. J Androl. 1999;20:474–80. [PubMed] [Google Scholar]
- 14.Loeb S, Kettermann A, Carter HB, Ferrucci L, Metter EJ, Walsh PC. Prostate volume changes over time: results from the Baltimore Longitudinal Study of Aging. J Urol. 2009;182:1458–62. doi: 10.1016/j.juro.2009.06.047. [DOI] [PMC free article] [PubMed] [Google Scholar]
- 15.Rhodes T, Girman CJ, Jacobsen SJ, Roberts RO, Guess HA, Lieber MM. Longitudinal prostate growth rates during 5 years in randomly selected community men 40 to 79 years old. J Urol. 1999;161:1174–9. [PubMed] [Google Scholar]
- 16.Stamey TA, Yang N, Hay AR, McNeal JE, Freiha FS, Redwine E. Prostate-specific antigen as a serum marker for adenocarcinoma of the prostate. N Engl J Med. 1987;317:909–16. doi: 10.1056/NEJM198710083171501. [DOI] [PubMed] [Google Scholar]
- 17.Collins GN, Lee RJ, McKelvie GB, Rogers AC, Hehir M. Relationship between prostate specific antigen, prostate volume and age in the benign prostate. Br J Urol. 1993;71:445–50. doi: 10.1111/j.1464-410x.1993.tb15990.x. [DOI] [PubMed] [Google Scholar]
- 18.Berry SJ, Coffey DS, Walsh PC, Ewing LL. The development of human benign prostatic hyperplasia with age. J Urol. 1984;132:474–9. doi: 10.1016/s0022-5347(17)49698-4. [DOI] [PubMed] [Google Scholar]
- 19.Oesterling JE. Prostate specific antigen: a critical assessment of the most useful tumor marker for adenocarcinoma of the prostate. J Urol. 1991;145:907–23. doi: 10.1016/s0022-5347(17)38491-4. [DOI] [PubMed] [Google Scholar]
- 20.Kaplan SA, Te AE, Pressler LB, Olsson CA. Transition zone index as a method of assessing benign prostatic hyperplasia: correlation with symptoms, urine flow and detrusor pressure. J Urol. 1995;154:1764–9. [PubMed] [Google Scholar]
- 21.Girman CJ, Jacobsen SJ, Guess HA, Oesterling JE, Chute CG, Panser LA, Lieber MM. Natural history of prostatism: relationship among symptoms, prostate volume and peak urinary flow rate. J Urol. 1995;153:1510–5. doi: 10.1016/s0022-5347(01)67448-2. [DOI] [PubMed] [Google Scholar]
- 22.St Sauver JL, Jacobson DJ, Girman CJ, McGree ME, Lieber MM, Jacobsen SJ. Correlations between longitudinal changes in transitional zone volume and measures of benign prostatic hyperplasia in a population-based cohort. Eur Urol. 2006;50:105–11. doi: 10.1016/j.eururo.2006.01.013. [DOI] [PubMed] [Google Scholar]
Associated Data
This section collects any data citations, data availability statements, or supplementary materials included in this article.
Supplementary Materials
Supplement data 1: Linear regression analysis to validate accuracy of the MRI derived prostate volumes. MRI derived volumes of 47 patients (median age 60.6years, median serum PSA 5.15ng/dl), who underwent radical prostatectomy were compared with radical prostatectomy specimen weights. There was a strong positive correlation between MRI derived whole prostate volumes and specimen weights (R2= 0.863).
Supplement data 2: Whole prostate (A) and central gland (B) volumes vs. IPSS severity. Although no threshold WP or CG volume could be assessed to predict severity of micturition symptoms, high IPSS scores indicating severe micturition symptoms were not encountered in patients with WP and CG volumes of <20cc and <8cc, respectively.


