Abstract
We demonstrate ultrasensitive fluorescence imaging of proteins on Western blots using a bright, compact, and orange-emitting semiconducting polymer dot (CN-PPV). We achieved a detection limit at the single-picogram level in dot blots; with conventional Western blotting, we detected 50 pg of transferrin and trypsin inhibitor after SDS-PAGE and transfer onto a PVDF membrane. Our method does not require any additional equipment or time compared to the conventional procedure with traditional fluorescent probes.
Keywords: Semiconducting polymer dots, Western blot
Western blotting is one of the key laboratory techniques for protein analysis. In this technique, proteins are separated by sodium dodecyl sulfate-polyacrylamide gel electrophoresis (SDS-PAGE) and then transferred onto a hydrophobic membrane; the proteins are later visualized using various labelling procedures. The traditional imaging method of chemiluminescence is based on protein labelling with horseradish peroxidase. Fluorescence detection has recently gained popularity because of its increased sensitivity and multiplex capability.[1,2] However, fluorescent dyes for Western blotting tend to suffer from rapid photobleaching, which reduces the sensitivity of repetitive blot imaging. Quantum dots (Qdots) are an alternative source of fluorescence signals that overcomes these limitations, and several papers have shown their application to Western blot analysis.[3–7] The lower detection limit for the Qdot-based Western blot was shown to be as low as 0.2 pg with single-particle imaging.[4] However, that technique requires a somewhat complicated setup and analyses, which are not readily available in most biochemistry laboratories.
In this communication, we demonstrate the application of semiconducting polymer dots (Pdots) for ultrasensitive fluorescence imaging of proteins on Western blots. The simple procedure we used is the one typically used with fluorescent dyes. Our group has recently developed an efficient technique for Pdot bioconjugation[8–11] that easily generates Pdots functionalized with the appropriate biomolecule. One challenge in applying polymer nanoparticles for protein detection/labelling is the potential for non-specific binding between the nanoparticle and the protein.[12,13] Generally, non-specific adsorption is more serious when the particle is made up of a hydrophobic polymer.[12] However, for semiconducting polymer dots (Pdots) and their bioconjugate counterparts, we did not observe any obvious non-specific binding when we applied them to specific cellular and subcellular labelling, such as to cell-surface proteins and microtubules.[8,14] This lack of non-specific binding is likely due to the Pdot surface we engineered, which is both quite negatively charged (~ 50 mV) and contains polyethylene glycol (PEG).[8,14] Finally, our Pdots tend to be small (~ 10 nm), which also minimizes non-specific binding by reducing the surface area available for non-specific interactions between the nanoparticle and the protein. In general, to detect picogram amounts of protein, such as in Western blotting, the selected Pdot should be small and compact, and possesses high brightness and colloidal stability. It should also have a surface that is negatively charged and contains agents against non-specific binding.
In this paper, Pdot-streptavidin conjugates, made out of a new orange-emitting poly[2-methoxy-5-(2-ethylhexyloxy)-1,4-(1-cyanovinylene-1,4-phenylene)] (CN-PPV) polymer,[14] were used to visualize proteins labelled with biotin-conjugated antibodies. We achieved low picogram detection sensitivity. The fluorescence signal from Pdots bound to proteins remained the same in successive images, even two weeks after the blotting procedure.
To prepare CN-PPV Pdots, we dissolved CN-PPV (from ADS Dyes Inc.) and poly(styrene-co-maleic anhydride) (PSMA, from Sigma-Aldrich) each in tetrahydrofuran (THF) to make 1 mg/mL stock solutions (1000 ppm). We then diluted these stock solutions by putting 125 μL of the CN-PPV stock solution and 25 μL of the stock PSMA solution into a 5-mL aliquot of THF. This mixture was sonicated and quickly injected into 10 mL of water in a bath sonicator, after which the THF was removed under slow nitrogen flow with heating. This nanoprecipitation procedure resulted in the formation of Pdots; 10 mL of the Pdot solution was further concentrated under nitrogen flow with heating to give 5 mL of the final Pdot solution at a concentration of 50 ppm. Before further use, this Pdot solution was passed through 0.2-μm cellulose acetate filter to remove any large aggregates in the solution.
To conjugate Pdots with streptavidin, to this 5 mL of Pdot solution, we added 100 μL of PEG (5 % w/v in water, MW 3350), 100 μL of 1 M HEPES buffer (pH 7.4), 300 μL of streptavidin (1 mg/mL in 20 mM HEPES buffer), and 50 μL of 1-ethyl-3-(3-dimethylaminopropyl) carbodiimide (EDC, from Sigma-Aldrich) (10 mg/mL in water). We then mixed the solution on a vortex and further stirred it at room temperature for 4 hours before adding a 100-μL aliquot of 1 % w/v bovine serum albumin (BSA, from Sigma-Aldrich) in water. After another 20-min stirring step, we added sucrose (10 % w/v) and concentrated the solution to a 0.5-mL volume by centrifugal filtration (filter MWCO 100,000). Finally, we purified the Pdot-streptavidin conjugates by passing the concentrated solution through a Sephacryl HR-300 gel column, which was equilibrated with 0.1% PEG (w/v) and 20 mM HEPES at pH 7.4. The final solution of Pdot-streptavidin had a concentration of 400 ppm of polymer, which we determined from its UV-visible absorption spectrum.
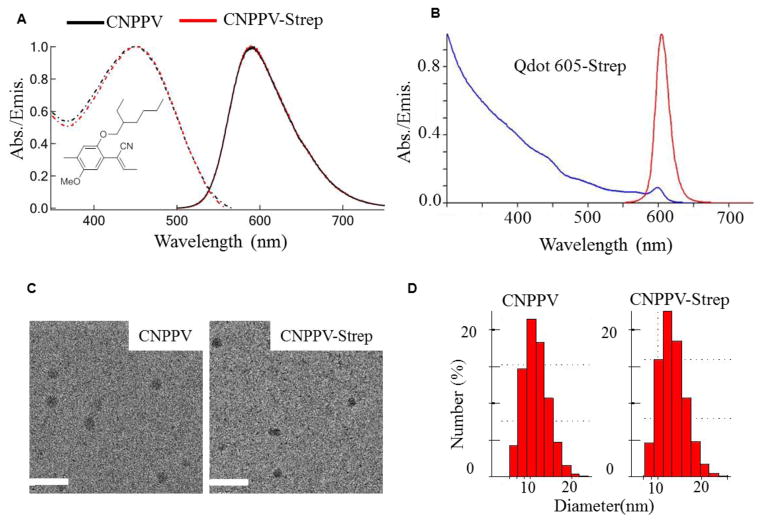
Figure 1A shows the structure of CN-PPV polymer and the optical properties of CN-PPV Pdot and CN-PPV-streptavidin Pdot bioconjugates. The CN-PPV Pdot possesses a quantum yield as high as 60% and an absorption cross-section of ~ 2.3×10⁻¹³ cm2 for a 10-nm-diameter Pdot. Its fluorescence lifetime is 1.5 ns. The peak emission is located at 595 nm, providing a lower autofluorescence background compared to its blue-emitting analogues.
Figure 1.
(A) Structure of CN-PPV polymer and the absorption (dashed) and emission (solid) spectra of CN-PPV Pdot (black) and CN-PPV Pdot-streptavidin conjugate (CNPPV-Strep, red) in a 0.1% PEG 20 mM HEPES buffer. (B) The absorption and emission spectra of Qdot 605-streptavidin conjugate from Invitrogen. (C) Representative TEM image of CN-PPV Pdot and CN-PPV-streptavidin Pdot; scale bars represent 50 nm. (D) Dynamic light scattering measurements of both CN-PPV and CN-PPV-streptavidin Pdots.
Figure 1C shows representative transmission electron microscopy (TEM) images of CN-PPV Pdot and CN-PPV-streptavidin Pdots. Figure 1D shows their size measured by dynamic light scattering (DLS), from which we see a ~2-nm increase in diameter after biocojugation to streptavidin. Based on the ratio of PSMA to streptavidin (1:20 in molarity) and the size of the Pdot, we estimate there are ~ 5–10 streptavidin molecules per 10-nm-diameter Pdot. As a comparison, we used Qdot 605-streptavidin (with a diameter of ~15 nm; QY = 30%,). Its emission is very close to that of CN-PPV Pdot and with its absorption cross-section of ~2.3×10⁻¹⁵ cm2, it can be efficiently excited at 473 nm, which is the excitation wavelength that the fluorescence scanner uses (Figure 1B).
Directly depositing proteins onto the polyvinylidene fluoride membrane (PVDF, from Fisher Scientific) in the form of dot blots permits a convenient quantitative protein detection test that bypasses the uncertainty associated with the transfer of proteins from a SDS-PAGE gel onto the membrane. The uncertainty in ensuring a near 100 % protein transfer efficiency in Western blotting lies in the optimization of the transfer conditions based on the proteins in question.[15] Because this paper is focused on the relative detection efficiency, and not on an optimization of Western blotting procedure, we first used dot blots to elucidate the lowest detection limits for the probed proteins.
To further minimize uncertainty associated with the antibody-to-protein binding constants, we first looked at the biotinylated goat anti-mouse (GAM) IgG (from BioLegend) dot blots visualized with either Qdot 605-streptavidin or CN-PPV Pdot-streptavidin conjugates. To carry out this comparison, we diluted biotinylated GAM IgG in TTBS buffer (20 mM Tris, 500 mM NaCl, pH 7.4, 0.05% Tween-20) to the desired concentrations and deposited a 2-μL droplet of this solution onto a dry PVDF membrane. We air-dried the blot for 1.5 hours, after which the membrane was activated by immersion in methanol for 1 min, rinsed off, and washed with constant rocking in water and then in TTBS buffer for 2 min each. We then blocked the membrane to prevent non-specific binding with 3% BSA TTBS (w/v) for 1 hour at room temperature with constant rocking, and washed the PVDF membrane for 2 min with TTBS before finally incubating with 1 nM CN-PPV Pdot-streptavidin solution in 3% BSA TTBS. After incubation, the blot was washed in TTBS six times (5 min each) before imaging. The dot blots were imaged in TTBS on a GE Typhoon FLA 9000 Gel Imaging Scanner (GE Healthcare, Piscataway, NJ), where a laser with 473-nm wavelength was used for excitation and a 575-nm long-pass filter was used for emission acquisition. Both Qdot and Pdot concentrations used for this experiments were 1 nM.
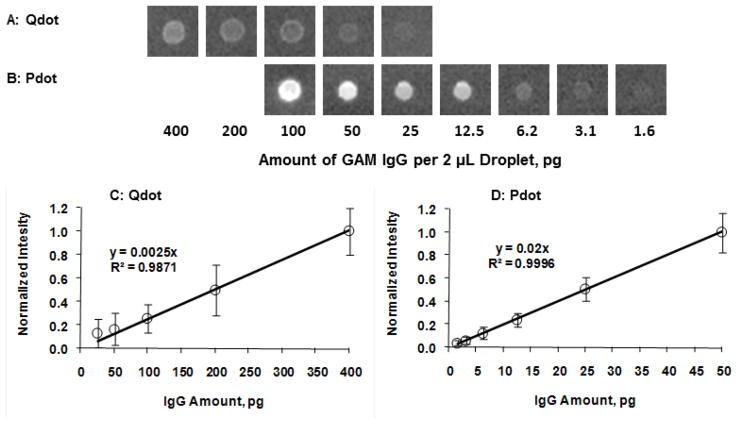
Figure 2A shows dot blot images of GAM IgG-biotin at different concentrations incubated with Qdot 605-streptavidin. Figure 2C shows their corresponding intensity as a function of the amount of GAM IgG. The intensity in y-axis in Figure 2C and 2D represents the normalized background-subtracted intensity. It can be seen that with Qdot 605-streptavidin as a fluorescent probe, a lower limit of 25 pg of GAM IgG per 2-μL droplet was detected. Figure 2B shows dot blot images of GAM IgG-biotin at different concentrations incubated with CN-PPV-streptavidin conjugates. Their corresponding intensity as a function of the amount of GAM IgG is shown in Figure 2D. It can be seen that with Pdot-streptavidin conjugates, the detection limit was significantly reduced to 1.6 pg per 2-μL droplet. Thus, the detection limit of Pdot-streptavidin conjugates is an order of magnitude higher than that of Qdot-streptavidin conjugates. It should be noted that the control experiments without added GAM IgG were performed to confirm that there was not any obvious non-specific binding between Qdot/Pdot and PVDF membrane.
Figure 2.
Images of anti-mouse IgG-biotin dot blots incubated with (A) Qdot 605-streptavidin and (B) CN-PPV Pdot-streptavidin conjugates. (C & D) Normalized integrated intensity of the corresponding dot blots shown in A & B.
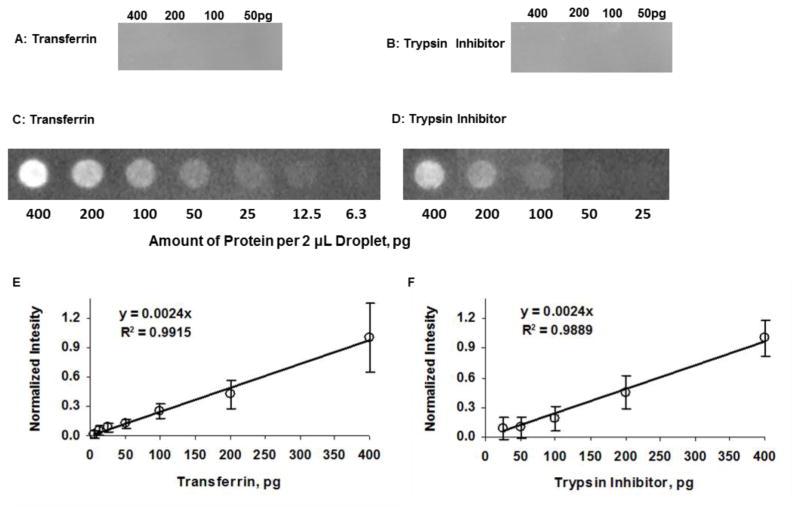
Next, we used Pdot-streptavidin conjugates to detect proteins in the presence of their primary antibody. Here, we selected transferrin and trypsin inhibitor (both from Invitrogen) and their corresponding biotinylated antibodies. We diluted the proteins to the desired concentrations in TTBS buffer and deposited a 2-μL droplet of each of the solutions onto the dry PVDF membranes. Blots were air-dried for 1.5 hours, and the rest of the procedure was identical to the dot blot experiments described above, where we activated the membrane then washed, blocked, and incubated the membrane with their respective biotinylated primary antibodies (at 1:1000 dilution in TTBS) for 1 hour at room temperature followed by washing with TTBS five times (5 min each). We then incubated the protein blots with the CN-PPV-streptavidin Pdot solution (1 nM in 3% BSA TTBS) and washed the membrane six times (5 min each) in TTBS before imaging. Different concentrations of transferrin and trypsin inhibitor were used. A control experiment without the primary antibody was performed for both proteins to determine whether there was non-specific binding between protein and Pdot-streptavidin (Figure 3A and 3B). The result shows that there was not any fluorescence detected from the dot blot with protein concentrations as high as 400 pg per 2-μl droplet.
Figure 3.
Images of (A) transferrin and (B) trypsin inhibitor dot blot without their corresponding primary antibodies. The concentration of CN-PPV Pdot-streptavidin conjugates was 1nM. No fluorescence was detected in these dot blots, thus indicating there was no obvious non-specific binding between Pdots and proteins. Images and corresponding normalized background-subtracted integrated intensities of (C & E) transferrin and (D & F) trypsin inhibitor. The dot blots were incubated with corresponding biotinylated antibodies and CN-PPV Pdot-streptavidin conjugates.
Figure 3C shows images of the transferrin dot blots with biotinylated primary antibody and Pdot streptavidin. Figure 3E shows the corresponding normalized background-subtracted intensity as a function of transferrin amount. A linear dependence between intensity and transferrin amount was found (R2=0.9915). A detection limit of 6.3 pg per 2-μL droplet was obtained for transferrin protein in the presence of its corresponding primary antibody.
Figure 3D shows images of trypsin inhibitor dot blots with its biotinylated primary antibody and Pdot streptavidin. Its corresponding normalized background-subtracted intensity as a function of trypsin inhibitor is shown in Figure 3F. A linear dependence between intensity and amount of trypsin inhibitor was also found (R2=0.9889). A detection limit of 25 pg per 2-μL droplet was obtained for trypsin inhibitor in the presence of its corresponding antibody. The detection limit differs in these two proteins most likely because of the different binding efficiencies between the protein and its corresponding antibody or between the corresponding antibody and the Pdot conjugates. The variability in the number of biotin molecules per antibody unit might also have caused the difference in detection limit.
To demonstrate the ability to repeatedly image a blot without a loss in sensitivity when using CN-PPV Pdot-streptavidin conjugates, biotinylated GAM IgG and transferrin dot blots were stored at 6 °C in TTBS buffer for up to 14 days following the labelling step. The detection limit for GAM IgG (1.6 pg) and the linearity (R2=0.9819) between intensity and amount of GAM IgG remained the same as that right after labelling, except for a slight increase in signal variation (Fig. 4A). The detection limit (6.3 pg) and linearity (R2=0.9946) between intensity and amount of protein for transferrin dot blot after 14 days storage at 6 °C were also found to be same as that right after labelling (Fig. 4B).
Figure 4.

Normalized background-subtracted integrated intensity of (A) goat anti-mouse IgG and (B) transferrin dot blots incubated with corresponding biotinylated antibodies and CN-PPV Pdot-streptavidin conjugates on day 14 after incubation (samples were stored in TTBS buffer at 6 °C).
Finally, we carried out a complete Western-blotting procedure and visualized the blots with CN-PPV Pdot-streptavidin conjugates. Here, we diluted the proteins to the appropriate desired concentrations in Laemmli buffer (20 % Glycerol, 2.1% SDS, 0.125 M Tris, pH 6.8, 0.73 M 2-mercaptoethanol, bromophenol blue), then heated the solution in 95–100 °C water bath for 5 min, cooled it to room temperature and loaded it onto SDS-PAGE gels (10% acrylamide for transferrin, 15% acrylamide for trypsin inhibitor, plus stacking 8% acrylamide with bromophenol blue). We also added Fermentas PageRuler Prestained Protein Ladder (10–170 kDa) as a reference. We carried out electrophoresis at 200 V for about 1 hour (until the dye front ran off the gel), and transferred the proteins from the gel to the PVDF membrane at 100 V for 1 hour at 6 °C. We washed the PVDF membrane twice with TTBS (5 min each), and then blocked and incubated the membrane in the same manner as described in the above sections. The concentration of Pdot-streptavidin conjugates was 1nM.
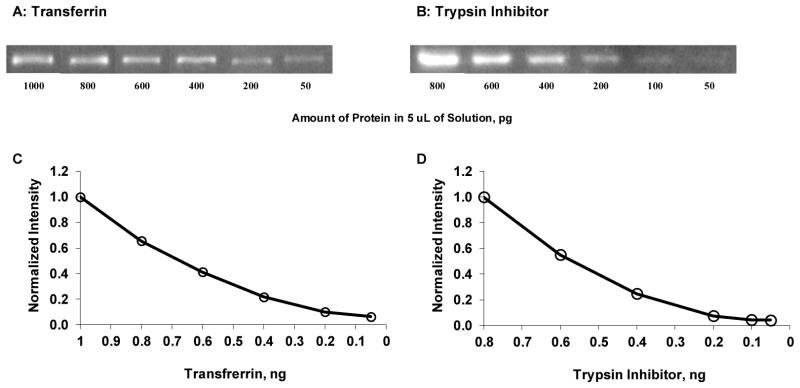
Figure 5A and 5B show images of transferrin and trypsin inhibitor following the entire Western blotting procedure of SDS-PAGE separation, transfer to PVDF membrane, blocking, and incubation with corresponding biotinylated antibodies and CN-PPV Pdot-streptavidin conjugates. Figure 5C and 5D show normalized background-subtracted intensity as a function of the amount of transferrin and trypsin inhibitor, respectively. The lowest detection limit was 50 pg for both transferrin and trypsin inhibitor. This increase in detection limit relative to the dot blots (Figure 3) reflects the loss of some protein during their transfer from the SDS-PAGE gel to the PVDF membrane. However, it shows that Pdots are compatible with an overall Western blotting procedure and could be used to analyze samples with high detection sensitivity.
Figure 5.

Images and corresponding normalized background-subtracted integrated intensity of (A & C) transferrin and (B & D) trypsin inhibitor following the entire Western blotting procedure of SDS-PAGE separation, transfer to PVDF membrane, blocking, and incubation with corresponding biotinylated antibodies and CN-PPV Pdot-streptavidin conjugates.
We demonstrated the first application of Pdot-conjugates for protein visualization in Western blotting applications. We detected low picogram quantities of proteins with a straightforward procedure that did not require any additional equipment or time compared to a procedure with traditional fluorescent probes. Given that Pdot emission properties could be easily fine-tuned,[16] we envision this method to be easily extended for multiplexed detection and be widely applied for protein analysis.
Acknowledgments
We gratefully acknowledge support of this work by the National Institutes of Health (GM085485) and the National Science Foundation (CHE-0924320). We note D.T.C. has financial interest in Lamprogen, which has licensed the described technology from the University of Washington.
Contributor Information
Fangmao Ye, Department of Chemistry, University of Washington, Seattle, Washington 98195, United States.
Polina B. Smith, Department of Chemistry, University of Washington, Seattle, Washington 98195, United States.
Changfeng Wu, State Key Laboratory on Integrated Optoelectronics, College of Electronic Science and Engineering, Jilin University, Changchun, Jilin 130012, China.
Daniel T. Chiu, Email: chiu@chem.washington.edu, Department of Chemistry, University of Washington, Seattle, Washington 98195, United States
References
- 1.Hawe A, Sutter M, Jiskoot W. Pharm Res. 2008;25:1487. doi: 10.1007/s11095-007-9516-9. [DOI] [PMC free article] [PubMed] [Google Scholar]
- 2.Kurien BT, Scofield RH. Methods. 2006;38:283. doi: 10.1016/j.ymeth.2005.11.007. [DOI] [PubMed] [Google Scholar]
- 3.Ornberg RL, Harper TF, Liu H. Nat Meth. 2005;2:79. [Google Scholar]
- 4.Bakalova R, Zhelev Z, Ohba H, Baba Y. J Am Chem Soc. 2005;127:9328. doi: 10.1021/ja0510055. [DOI] [PubMed] [Google Scholar]
- 5.Scholl B, Liu HY, Long BR, McCarthy OJT, O’Hare T, Druker BJ, Vu TQ. ASC Nano. 2009;3:1318. doi: 10.1021/nn9000353. [DOI] [PubMed] [Google Scholar]
- 6.Chen W, Xu DH, Liu LQ, Peng CF, Zhu YY, Ma W, Bian A, Li Z, Yuanyuan Jin ZY, Zhu SF, Xu C, Land Wang LB. Anal Chem. 2009;81:9194. doi: 10.1021/ac901429a. [DOI] [PubMed] [Google Scholar]
- 7.Gilroy KL, Cumming SA, Pitt AR. Anal Bioanal Chem. 2010;398:547. doi: 10.1007/s00216-010-3908-0. [DOI] [PubMed] [Google Scholar]
- 8.Wu CF, Schneider T, Zeigler M, Yu JB, Schiro PG, Burnham DR, McNeill JD, Chiu DT. J Am Chem Soc. 2010;132:15410. doi: 10.1021/ja107196s. [DOI] [PMC free article] [PubMed] [Google Scholar]
- 9.Wu C, Jin Y, Schneider T, Burnham DR, Smith PB, Chiu DT. Angew Chem Int Ed Engl. 2010;49:9436. doi: 10.1002/anie.201004260. [DOI] [PMC free article] [PubMed] [Google Scholar]
- 10.Zhang X, Yu J, Wu C, Jin Y, Rong Y, Ye F, Chiu DT. ACS Nano. 2012;6:5429. doi: 10.1021/nn301308w. [DOI] [PMC free article] [PubMed] [Google Scholar]
- 11.Yu J, Wu C, Zhang X, Ye F, Gallina M, Rong Y, Wu I, Sun W, Chan Y, Chiu DT. Adv Mater. 2012;24:3498. doi: 10.1002/adma.201201245. [DOI] [PMC free article] [PubMed] [Google Scholar]
- 12.Vonarbourg A, Passirani C, Saulnier P, Benoit JP. Biomaterials. 2006;27:4356. doi: 10.1016/j.biomaterials.2006.03.039. [DOI] [PubMed] [Google Scholar]
- 13.Kamaly N, Xiao Z, Valencia PM, Radovic-Moreno AF, Farokhzad OC. Chem Soc Rev. 2012;41:2971. doi: 10.1039/c2cs15344k. [DOI] [PMC free article] [PubMed] [Google Scholar]
- 14.Ye F, Wu C, Jin Y, Wang M, Chan Y, Yu J, Sun W, Hayden S, Chiu DT. Chem Comm. 2012;48:1778. doi: 10.1039/c2cc16486h. [DOI] [PMC free article] [PubMed] [Google Scholar]
- 15.Bolt MW, Mahoney PA. Anal Biochem. 1997;247:185. doi: 10.1006/abio.1997.2061. [DOI] [PubMed] [Google Scholar]
- 16.Wu CF, Hansen SJ, Hou Q, Yu J, Zeigler M, Jin Y, Burnham DR, McNeill JD, Olson JM, Chiu DT. Angew Chem Int Ed Engl. 2011;50:3430. doi: 10.1002/anie.201007461. [DOI] [PMC free article] [PubMed] [Google Scholar]


