

Abstract
Previous studies showed that aberrant HLA-G expression in trophoblast cells plays important roles in trophoblast invasion; however, the mechanisms remain to be explored. In this study, we found that suppressed HLA-G expression could dramatically decrease the mRNA and protein expression levels of matrix metalloproteinase 2 and matrix metalloproteinase 9, and in the proteome assay, there were 3 identified proteins namely, prefoldin 1, eukaryotic translation elongation factor 2 and malate dehydrogenase 2, which were verified by Western blot and known to be associated with invasion, cell cycle and cell metabolism, respectively. Collectively, our study indicated a potential involvement of HLA-G in autocrine networks that may regulate prefoldin, MMPs and trophoblast invasion at the maternal-fetal interface in human pregnancy.
Keywords: HLA-G, invasion, proteomics, trophoblast, MMPs
Introduction
Nonclassical major histocompatibility complex class I human leukocyte antigen G (HLA-G) gene, specifically expressed at the maternal-fetal interface [1], has been characterized as an immunosuppressor [2] and is associated with several common pregnancy complications, including inexplicable miscarriage and pre-eclampsia [3,4]. However, the non-immune function that HLA-G plays in trophoblast invasion has not been well addressed.
Aberrant HLA-G expression in situ was found in various malignancies, and its expression was highly associated with malignant invasive and metastatic status [5-7]. In this context, the matrix metalloproteinases (MMPs) in particular, is well established both in tumor invasion and in metastasis. Owing to its ability to degrade basement membrane and extracellular matrix components, MMPs is one of the central mediators of the biology of tumor invasion and metastasis [8]. Both tumor cells and extravillous trophoblasts (EVT) share similar characteristics in many regards, such as the capability of invasion. Therefore, similar tactics may be involved in invasion of trophoblast [9,10]. Previous studies revealed that invasive EVT express MMPs play a critical role in pregnancy, and only the HLA-G positive EVT has the invasive potential [11-13]. There were several studies demonstrating that the expression of HLA-G may play important roles in the invasion of trophoblast in vitro [14-16]. It seems that, expression of HLA-G and MMP in EVT which work in a concerted-manner, cause the highly invasive EVT invading the maternal wall and ultimately initiating the uterine spiral arteries. Recently, the relationship between HLA-G and trophoblast invasion has been strengthened. However, the mechanisms remain to be explored.
The JEG-3 cell with high expression of HLA-G serves as a widely used model for trophoblast [17,18]. The limited availability of trophoblast tissue often requires the use of such a model, especially in investigations about trophoblast invasion in vitro [19-22].
Our previous data provided the evidence that HLA-G expression was associated with the invasion of JEG-3 cells [23]. However, the mechanisms need further study. In the current study, we examined the effect of suppressed HLA-G on the expression of MMPs and on the proteome of JEG-3 cells using 2-dimensional electrophoresis and MALDI-TOF-TOF-MS techniques. Our results showed that HLA-G may get involved in autocrine networks that regulate prefoldin, MMPs and trophoblast invasion at the maternal-fetal interface in human pregnancy.
Materials and methods
Cell culture
The human trophoblast cell line JEG-3 purchased from American Type Culture Collection (Manassas, VA, USA), was grown in 6-well plates with 10% FCS antibiotic-free RPMI 1640 medium under standard culture conditions of 5% CO2 in air at 37 °C with medium renewal every 2-3 days.
Cell transfection
The JEG-3 cells were seeded into groups with 30% confluence in 12-well culture plates and were transfected with a target small-interfering RNA (siRNA, 100 nmol/L, Invitrogen, Carlsbad, CA, Si(HLA-G) group), a negative control siRNA (Invitrogen, Carlsbad, CA, Si(neg) group) and only Lipofectamine 2000 (Invitrogen, Carlsbad, CA, Si(non) group) respectively, according to the manufacturer’s instructions. After treatment for 6h with siRNA, the medium containing siRNA and transfection reagents was removed, and after washing, the cells were cultured for 72h with fresh culture medium. In preliminary testing, HLA-G was significantly down-regulated at 48h of transcript level and 72h of protein level. The cells were then harvested after various conditions, and transcript and protein levels of HLA-G were determined by RT-PCR and Western blot, respectively.
Transfection efficiency was evaluated by observation of stained cells using fluorescein conjugated siRNA (Invitrogen, Carlsbad, CA). At 24h after transfection, cells were fixed with 95% alcohol, observed with an OLYMPUS BX51 fluorescence microscope and photographed with NIKON NP2 digital microscopy. The transfection efficiency of JEG-3 cells was up to 80%-90%, according to the expression of cytoplasmic intensity of the fluorescence using Image-pro plus 6.0 software.
RNA extraction and semi-quantitative reverse transcription polymerase chain reaction (RT-PCR)
Total RNA was extracted from the cell culture dishes using Trizol (Invitrogen, Carlsbad, CA) according to the manufacturer’s instructions. The cDNA was synthesized from 5 μg total RNA by reverse transcription kit (Takara, Dalian, China) as described in manufacturer’s instructions. Relative transcript abundance of HLA-G, matrix metalloproteinase 2 (MMP2), matrix metalloproteinase 9 (MMP9) was analyzed by semi-quantitative RT-PCR using GAPDH as an internal standard. The primers, expected sizes of the PCR products and amplified conditions used in the subsequent RT-PCR were shown in Table 1 (Table 1). PCR products were separated on a 2% agarose gel. Gels were stained with ethidium bromide. A single band for each gene was observed at the expected size. The intensity of either the target or GAPDH band for each sample was quantified using a gel documentation and analysis system and the ratio of the two was used as a normalized value for expression of each target gene. All assays were conducted in triplicate.
Table 1.
Details of the primers employed in the study
| Name of gene | Primer sequence | Annealing temperature (°C) | Amplicon length (bp) | Cycle |
|---|---|---|---|---|
| HLA-G | F 5-CTGACCCTGACCGAGACCTGG-3 | 57 | 338 | 28 |
| R 5-GTCGCAGCCAATCATCCACTGGAG-3 | ||||
| GAPDH | F 5-GAAGGTGAAGGTCGG AGTC-3 | 57 | 228 | 28 |
| R 5-GAAGATGGTGATGGGATTTC-3 | ||||
| MMP9 | F 5-GGGACGCAGACATCGTCATC-3 | 60 | 755 | 40 |
| R 5-TCGTCATCGTCGAAATGGGC-3 | ||||
| MMP2 | F 5-CCGTCGCCCATCATCAAGTT-3 | 60 | 502 | 40 |
| R 5-CTGTCTGGGGCAGTCCAAAG-3 |
All the primers were synthesized by ShengGong, Shanghai, China.
Western blot analysis
HLA-G and five important proteins involved in invasion activity and signal transduction were chosen for Western blot analysis. The five proteins were MMP2, MMP9, prefoldin 1, malate dehydrogenase 2 (MDH2), and eukaryotic translation elongation factor 2 (eEF2). Cell lysates were prepared by radioimmunoprecipitation assay (RIPA) buffer. Equal amounts of protein (30 μg) were separated by 12/10% SDS-PAGE, and then transferred onto PVDF membranes. After blocking in PBS/Tween-20 with 5% dry milk for 2h at room temperature, membranes were incubated with specific primary antibodies overnight at 4 °C. The following antibodies were used in this study: the anti-HLA-G monoclonal mouse antibody (1:1000, Abcam, USA), anti-MMP2 monoclonal rabbit antibody (1:2000, Epitomics, USA), anti-MMP9 monoclonal rabbit antibody (1:2000, Epitomics, USA), anti-prefoldin 1 polyclone rabbit antibody (1:500, Abcam, USA), anti-MDH2 monoclonal mouse antibody (1:1000, Abcam, USA), anti-eEF2 monoclonal rabbit antibody (1:10000, Abcam, USA). The immunoreactive bands were detected by a chemiluminescence detection kit (Tiangen, Beijing, China) after incubation with horseradish peroxidase-labeled mouse/rabbit antibody (1:5000, Jackson, USA). The membrane was probed with anti-Tubulin (1:500, Invitrogen, Carlsbad, CA) as a loading control. All blotting experiments were repeated at least three times, and representative data are shown.
2-dimensional gel electrophoresis
Three hundred microgram of proteins were separated by 2-dimensional gel electrophoresis (2-DE) by isoelectric focusing at pH 3-10 (17 cm, Immobilone dry strip, Amersham-Pharmacia) followed by 12% polyacrylamide gel according to the manufacturer’s instructions. The total protein was extracted from the JEG-3 cells before and after siRNA knockdown. The silver stained proteins were scanned and analyzed by PDQUEST (BioRad). The protein spots of interest were destained, and digested with trypsin. The protein spots were arbitrarily numbered, and the intensity of the spot of interest was compared for further analysis. When the expression level of protein in one group was 1.5 times greater or lower than compared group, those spots can be regarded as differentially expressed spots. The selected four spots which were at least 3 fold up- or down-regulated ones and scattered over the 2-DE protein map of JEG-3 cells with decreased expression of HLA-G, were then determined by matrix-assisted laser desorption ionization-time-of-flight (MALDI-TOF) mass spectrometry analysis as previously described [24].
Statistical analyses
Data were presented as the mean ± SD of at least three independent experiments performed in triplicate. Data were analyzed for statistical significance using the Student’s t-test. A value of P < 0.05 was considered statistically significant.
Result
Transient expression of HLA-G in JEG-3 cell lines
After transfected with HLA-G siRNA, both protein and mRNA expressions of HLA-G in JEG-3 cells were confirmed by Western blotting analysis and RT-PCR, respectively. Western blotting analysis showed that in comparison with si(non) group, protein expression of HLA-G was obviously reduced 92.54% in si(HLA-G) group in JEG-3 cell lines (P < 0.001, Figure 1C). In RT-PCR, si(HLA-G) group showed mRNA expression of nearly 100% reduction compared with that of si(non) (P < 0.01), indicating that transcriptional expression of HLA-G was significantly decreased in si(HLA-G) group (P < 0.01, Figure 1B). There was no significant difference in protein and mRNA expressions between si(neg) and si(non) group of JEG-3 cells (P > 0.05, Figure 1B, 1C). This indicated that HLA-G siRNA transfection specifically down-regulated the protein and mRNA expression levels of HLA-G in JEG-3 cell lines.
Figure 1.
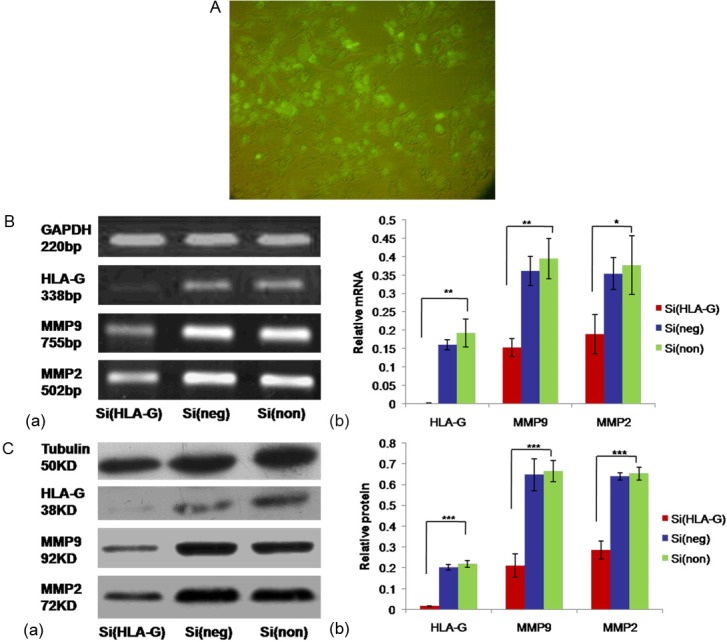
The reduction of HLA-G expression by siRNA and the downregulated expression of MMP2 and MMP9 after HLA-G knockdown. JEG-3 cells transfected with HLA-G siRNA, negative siRNA and only Lipofectamine 2000 as control for 6h and then cultured with fresh culture medium for 2 or 3 days. HLA-G siRNA had a maximal inhibition effect on both transcript and protein level at 48h and 72h after transfection, respectively. A: Image was obtained from JEG-3 cells at 24h after transfected with fluorescein conjugated siRNA using an OLYMPUS BX51 microscope with fluorescence light. The transfection efficiency of JEG-3 cells was up to 80%-90%. B: Total RNA was subjected to semi-quantitative RT-PCR to determine HLA-G, MMP2, MMP9 and GAPDH expression at 48h after transfection. GAPDH served as an internal control. C: Total protein was subjected to Western blot to determine HLA-G, MMP2, MMP9 and tubulin expression at 72h after transfection. Tubulin served as an internal control. Groups of Si(HLA-G), Si(neg) and Si(non) were the JEG-3 cells transfected with HLA-G siRNA, negative siRNA and only Lipofectamine 2000, respectively. Data were shown as means ± SD in each group. *P < 0.05, **P < 0.01, ***P < 0.001 when compared with si(non) group, respectively; SD, standard deviation.
HLA-G depletion affected MMP9 and MMP2 production in JEG-3 cells
HLA-G knockdown resulted in a significant decrease in mRNA expression of MMP9 and MMP2 (55.16%, 49.71%, respectively) in comparison with that of si(non) (P < 0.01, P < 0.05, respectively, Figure 1B). Meanwhile, si(HLA-G) group showed MMP9 and MMP2 protein expressions of 68.38% and 56.21% reduction compared with that of si(non) (P < 0.001, P < 0.001, respectively, Figure 1C).
Modulation of protein expression by HLA-G siRNA in JEG-3 cells
In order to examine the underlying mechanism of HLA-G on invasion of JEG-3 cells in vitro, proteomic analysis of JEG-3 cells transfected with HLA-G siRNA was performed using 2-DE followed by MALDI-TOF mass spectrometry analysis.
There were thirty-three protein spots significantly up- or down-regulated more than 1.5 fold (Figure 2). Among them, 18 were down-regulated and the other 15 were up-regulated after HLA-G knockdown. Figure 3 was the enlargement graph for differentially expressed point number 4102, 5016, 7903 and 9420 of 2-DE gels, which were at least 3 fold up- or down-regulated (Figure 3). After JEG-3 cells were transfected with HLA-G siRNA for 72h, expression levels of MDH2 and prefoldin 1 were decreased to 5%, 11%, respectively. On the other hand, expression level of eEF2 was up-regulated 326% (Table 2).
Figure 2.
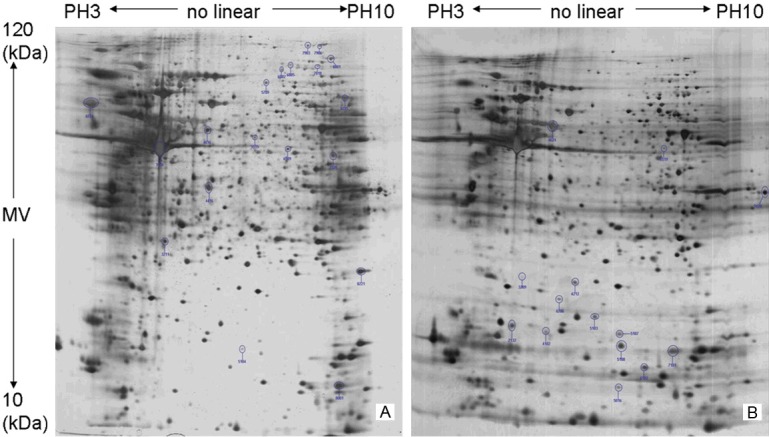
The two-dimensional gel electrophoresis graph of total protein was extracted from the cells before (B) and after (A) RNAi knockdown. All the protein spots whose expression levels changed more than 1.5-fold at 72h after HLA-G siRNA transfection was shown.
Figure 3.
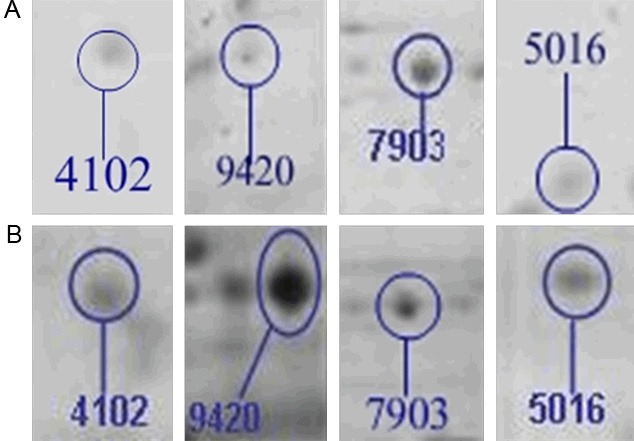
The enlargement graph for differentially expressed protein before (B) and after (A) RNAi knockdown. The selected four spots were at least 3 fold up- or down-regulated ones and scattered over the 2-DE protein map of JEG-3 cells with decreased expression of HLA-G.
Table 2.
Identification of the up- or down-regulated proteins of the four selected spots in JEG-3 cells before and after RNAi knockdown using MALDI-TOF-MS
| Spot No. | Protein identification | Up- or down-regulated | Accession No | Mr (Dalton) | pI | Functional association |
|---|---|---|---|---|---|---|
| 9420 | MDH2 | ↓ | gi│49168580 | 35536.8 | 8.92 | metabolism |
| 9420 | unknown | ↓ | gi│41472053 | 33207.5 | 8.54 | unknown |
| 5016 | prefoldin 1 variant | ↓ | gi│62898349 | 14187.5 | 6.32 | cell mobility |
| 5016 | prefoldin subunit 1 | ↓ | gi│3212110 | 14284.6 | 6.85 | cell mobility |
| 7903 | eukaryotic translation elongation factor 2 | ↑ | gi│4503483 | 95277 | 6.41 | cell cycle |
| 4102 | none |
MALDI-TOF-MS, matrix-assisted laser desorption ionization-time-of-flight mass spectrometry.
Western blot analysis of JEG-3 cells expression of prefoldin 1, MDH2 and eEF2
To confirm the protein expression changes after HLA-G knockdown in 2-DE gels, Western blot analysis was performed for the identified proteins involved in invasion activity and cell cycle. As seen in Figure 4, the protein levels of prefoldin 1 and MDH2 decreased (P < 0.01, P < 0.05, respectively, Figure 4), while the protein level of eEF2 increased in JEG-3 cells with HLA-G knock-down (P < 0.001, Figure 4). The results correlated with those obtained from 2-DE analysis.
Figure 4.
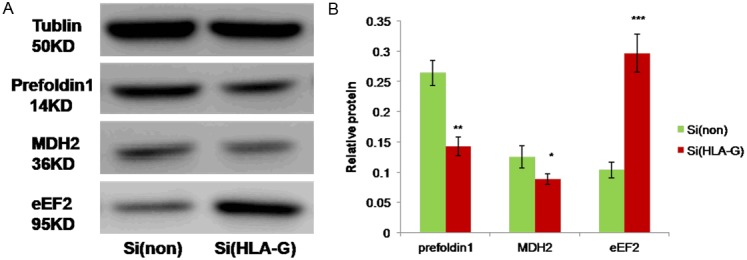
Western blot analyses of three proteins found to be up- or down-regulated after HLA-G knockdown. 30 μg of total cell lysates were separated on 12%/10% SDS-PAGE, and immunoblotting was performed with anti-prefoldin 1, anti-MDH2 and anti-eEF2. Tubulin served as an internal control. Groups of Si(non) and Si(HLA-G) were the JEG-3 cells transfected with only Lipofectamine 2000 and HLA-G siRNA, respectively. Data were shown as means ± SD in each group. *P < 0.05, **P < 0.01, ***P < 0.001 when compared with si(non) group, respectively; SD, standard deviation.
Discussion
In the present study, we used powerful proteomic tools to elucidate the impact of decreased HLA-G expression on the protein expression in JEG-3 cells. The study found suppressed expression of MMP9, MMP2, MDH2 and prefoldin 1 and up-regulating of eEF2 with knockdown of HLA-G expression in JEG-3 cells. To our knowledge, this is the first 2-DE protein map of JEG-3 cells with decreased expression of HLA-G. This map may provide a basis for identifying possible changes in protein expression in response to suppressed HLA-G in JEG-3 cells. The identified proteins may represent new and important targets associated with cellular responses to downregulated HLA-G in trophoblast.
Thirty-three protein spots were found to be differently expressed in JEG-3 cells after HLA-G siRNA transfection. In the selected four protein spots (#4102, #5016, #7903 and #9420), three proteins were identified, which were MDH2, component of citric acid cycle; eEF2, a G protein and prefoldin 1, a molecular chaperon, regulating folding and degradation of protein. None of them were reported to be related to decreased expression of HLA-G in trophoblast.
MDH2, also known as NAD (mitochondrial), is a protein which catalyzes the reversible oxidation of malate to oxaloacetate, utilizing the NAD/NADH cofactor system in the citric acid cycle. The protein encoded by this gene is localized on the mitochondria and may play important roles in the malate-aspartate shuttle that operates in the metabolic coordination between cytosol and mitochondria. As far as we known, there are no reports that suggest other HLA isoforms function in the citric acid cycle or regulate MDH2 in other cell types. However, our study may suggest that HLA-G may function at some key points in the citric acid cycle and regulate the expression of MDH2 in JEG-3 cells. However, the cell signal transduction pathways need further study.
eEF2 is a G-protein required for the translocation step of translation elongation. Its activity can be controlled through posttranslational modifications. Our results showed up-regulating of eEF2 in JEG-3 cells with decreased expression of HLA-G. Besides, JEG-3 cells were found to be arrested in the S phase of the cell cycle under the same condition in our previous study [23]. Coinciding with our results, it was reported that knockdown of eEF2 induced G2/M arrest in gastric cancer cell lines [25]. Therefore, whether HLA-G functions as a cell cycle modulation agent via eEF2 in trophoblast deserves further research and our result reminded that HLA-G probably has little influence on cell cycle of trophoblast.
Among the down-regulated proteins, prefoldin 1, which is known as a cofactor of the group II chaperonins, is a molecular chaperone that captures and stabilizes unfolded proteins and then delivers them to chaperonin for correct folding [26]. In particular, prefoldin plays an essential role in actin- and tubulin-mediated functions in cell division, motility, and cytoskeletal stability [27]. Our research suggested that expression of prefoldin 1 was suppressed in JEG-3 cells with knock-down of HLA-G in vitro while our previous study implicated reduced invasiveness of JEG-3 cells under the same condition [23]. Coinciding with our results, Lundin VF et al. demonstrated that reducing prefoldin function by RNAi caused defects in cell division and distal tip cell migration [28]. These findings provided new insights into the molecular mechanism in mediating cellular response to down-regulating of HLA-G in trophoblast invasion.
In addition, the temporal and spatial regulation of trophoblast invasion is controlled by many factors. The invasive nature of trophoblast is partly due to its ability to secrete MMPs. Among members of MMP family, MMP2 and MMP9 are highly expressed in trophoblast and critical for trophoblast invasion [29,30]. Several studies have found MMP9 to be the key-enzyme in trophoblast invasion in vitro [31-33]. Similarly, our previous and current observation demonstrated that HLA-G may suppress the invasion of JEG-3 cells [23] with down-regulated expression of MMP9 and MMP2. Meanwhile, Wang’s data suggested novel roles for HLA-G in regulating β-hCG production via the modulation of the Erk1/2 pathway [34]. Furthermore, McCor-mick’s research demonstrated that soluble HLA-G suppressed growth factor-stimulated motility and invasion of trophoblast cells [35].
It is interesting to speculate a potential involvement of HLA-G in the autocrine networks that regulates prefoldin, MMP production and the invasive function of trophoblast. There were several studies demonstrating that a decreased expression was found in HLA-G placental and maternal serum expression in pre-eclampsia compared with normal pregnancy [14,36,37]. Besides, it was reported that MMP2 and MMP9 levels were decreased in severe pre-eclamptic placentas when compared with normal placentas [29]. In particular, pre-eclampsia is probably caused by endothelial injury and abnormal invasion of trophoblast, which interfere placenta implantation. Nevertheless, to some extent, the effect of HLA-G on the invasion of JEG-3 cells directly via MMPs or prefoldin may offer a novel and potent pathway to explain the pathology of high-risk pregnancy and further exploration is needed.
Whether JEG-3 cells possess a receptor to HLA-G and the related intracellular mechanisms in trophoblast have yet to be determined. HLA-G is known to bind to and activate a number of cell surface receptors expressed by NK and endothelial cells including KIR2DL4, ILT-2 and CD160 [38-41]. The identity of the receptor and the signal transduction pathways getting involved in HLA-G’s regulation of trophoblast invasion need further research.
In conclusion, HLA-G may be an important regulator of trophoblast invasion in an autocrine way via regulation of prefoldin and MMP production. Further investigations are needed to explore the related molecular mechanisms and its detailed role in pregnancy maintenance and pathological pregnancy.
Acknowledgements
The authors are especially grateful to Shanghai Key Laboratory of Female Reproductive Endocrine Related Disease for the excellent technical assistant. This research was supported by the foundation of Shanghai Municipal Health Bureau (Grant No 2008-148 to Weirong Gu).
Disclosure of conflict of interest
None.
References
- 1.Kovats S, Main EK, Librach C, Stubblebine M, Fisher SJ, DeMars R. A class I antigen, HLA-G, expressed in human trophoblasts. Science. 1990;248:220–223. doi: 10.1126/science.2326636. [DOI] [PubMed] [Google Scholar]
- 2.Rizzo R, Vercammen M, van de Velde H, Horn PA, Rebmann V. The importance of HLA-G expression in embryos, trophoblast cells, and embryonic stem cells. Cell Mol Life Sci. 2011;68:341–352. doi: 10.1007/s00018-010-0578-1. [DOI] [PMC free article] [PubMed] [Google Scholar]
- 3.Hunt JS. Stranger in a strange land. Immunol Rev. 2006;213:36–47. doi: 10.1111/j.1600-065X.2006.00436.x. [DOI] [PMC free article] [PubMed] [Google Scholar]
- 4.Goldman-Wohl DS, Ariel I, Greenfield C, Hochner-Celnikier D, Cross J, Fisher S, Yagel S. Lack of human leukocyte antigen-G expression in extravillous trophoblasts is associated with pre-eclampsia. Mol Hum Reprod. 2000;6:88–95. doi: 10.1093/molehr/6.1.88. [DOI] [PubMed] [Google Scholar]
- 5.González A, Rebmann V, Lemaoult J, Horn PA, Carosella ED, Alegre E. The immunosuppressive molecule HLA-G and its clinical implications. Crit Rev Clin Lab Sci. 2012;49:63–84. doi: 10.3109/10408363.2012.677947. [DOI] [PubMed] [Google Scholar]
- 6.Lin AF, Xu HH, Xu DP, Zhang X, Wang Q, Yan WH. Multiple steps of HLA-G in ovarian carcinoma metastasis: Alter NK cytotoxicity and induce matrix metalloproteinase-15 (MMP-15) expression. Hun Immunol. 2013;74:439–446. doi: 10.1016/j.humimm.2012.11.021. [DOI] [PubMed] [Google Scholar]
- 7.Lin A, Zhang X, Xu HH, Xu DP, Ruan YY, Yan WH. HLA-G expression is associated with metastasis and poor survival in the Balb/c nu/nu murine tumor model with ovarian cancer. Int J Cancer. 2012;131:150–157. doi: 10.1002/ijc.26375. [DOI] [PubMed] [Google Scholar]
- 8.Rucci N, Sanità P, Angelucci A. Roles of metalloproteases in metastatic niche. Curr Mol Med. 2011;11:609–622. doi: 10.2174/156652411797536705. [DOI] [PubMed] [Google Scholar]
- 9.Lala PK, Lee BP, Xu G, Chakraborty C. Human placental trophoblast as an in vitro model for tumor progression. Can J Physiol Pharmacol. 2002;80:142–149. doi: 10.1139/y02-006. [DOI] [PubMed] [Google Scholar]
- 10.Holtan SG, Creedon DJ, Haluska P, Markovic SN. Cancer and pregnancy: parallels in growth, invasion, and immune modulation and implications for cancer therapeutic agents. Mayo Clin Proc. 2009;84:985–1000. doi: 10.1016/S0025-6196(11)60669-1. [DOI] [PMC free article] [PubMed] [Google Scholar]
- 11.Plaisier M, Koolwijk P, Willems F, Helmerhorst FM, van Hinsbergh VW. Pericellular-acting proteases in human first trimester decidua. Mol Hum Reprod. 2008;14:41–51. doi: 10.1093/molehr/gam085. [DOI] [PubMed] [Google Scholar]
- 12.Szabova L, Son MY, Shi J, Sramko M, Yamada SS, Swaim WD, Zerfas P, Kahan S, Holmbeck K. Membrane-type MMPs are indispensable for placental labyrinth formation and development. Blood. 2010;116:5752–5761. doi: 10.1182/blood-2009-10-249847. [DOI] [PMC free article] [PubMed] [Google Scholar]
- 13.Helige C, Ahammer H, Hammer A, Huppertz B, Frank HG, Dohr G. Trophoblastic invasion in vitro and in vivo: similarities and differences. Hum Reprod. 2008;23:2282–2291. doi: 10.1093/humrep/den198. [DOI] [PubMed] [Google Scholar]
- 14.Zhou X, Zhang G, Wang J, Lu S, Cao J, Sun L. A novel bridge between oxidative stress and immunity: the interaction between hydrogen peroxide and human leukocyte antigen G in placental trophoblasts during preeclampsia. Am J Obstet Gynecol. 2012;206:447, e7–16. doi: 10.1016/j.ajog.2012.03.013. [DOI] [PubMed] [Google Scholar]
- 15.Havemann D, Balakrishnan M, Borahay M, Theiler R, Jennings K, Endsley J, Phelps J, Hankins GD, Yallampalli C, Chauhan M. Intermedin/Adrenomedullin 2 Is Associated With Implantation and Placentation via Trophoblast Invasion in Human Pregnancy. J Clin Endocrinol Metab. 2013;98:695–703. doi: 10.1210/jc.2012-2172. [DOI] [PMC free article] [PubMed] [Google Scholar]
- 16.Chauhan M, Balakrishnan M, Yallampalli U, Endsley J, Hankins GD, Theiler R, Yallampalli C. Adrenomedullin 2/Intermedin Regulates HLA-G in Human Trophoblast. Biol Reprod. 2011;85:1232–1239. doi: 10.1095/biolreprod.110.086835. [DOI] [PMC free article] [PubMed] [Google Scholar]
- 17.Pollheimer J, Knöfler M. Signalling pathways regulating the invasive differentiation of human trophoblasts. Placenta. 2005;26(Suppl A):S21–S30. doi: 10.1016/j.placenta.2004.11.013. [DOI] [PubMed] [Google Scholar]
- 18.Hannan NJ, Paiva P, Dimitriadis E, Salamonsen LA. Models for study of human embryo implantation: choice of cell lines? Biol Reprod. 2010;82:235–245. doi: 10.1095/biolreprod.109.077800. [DOI] [PubMed] [Google Scholar]
- 19.Suman P, Poehlmann TG, Prakash GJ, Markert UR, Gupta SK. Interleukin-11 increases invasiveness of JEG-3 choriocarcinoma cells by modulating STAT3 expression. J Reprod Immunol. 2009;82:1–11. doi: 10.1016/j.jri.2009.07.002. [DOI] [PubMed] [Google Scholar]
- 20.Zhang X, Green KE, Yallampalli C, Dong YL. Adrenomedullin enhances invasion by trophoblast cell lines. Biol Reprod. 2005;73:619–626. doi: 10.1095/biolreprod.105.040436. [DOI] [PubMed] [Google Scholar]
- 21.Zhang Z, Xu Q, Shi CH, Li YH. Interleukin-12 inhibits cell invasion in choriocarcinoma. Int J Mol Med. 2012;30:57–62. doi: 10.3892/ijmm.2012.960. [DOI] [PubMed] [Google Scholar]
- 22.Tang CL, Zhao HB, Li MQ, Du MR, Meng YH, Li DJ. Focal adhesion kinase signaling is necessary for the cyclosporin A enhanced migration and invasion of human trophoblast cells. Placenta. 2012;33:704–711. doi: 10.1016/j.placenta.2012.06.007. [DOI] [PubMed] [Google Scholar]
- 23.Liu HY, Gu WR, Li XT. Effects on human leukocyte antigen-G on proliferation and invasion of JEG-3 cell line. Zhonghua Fu Chan Ke Za Zhi. 2008;43:445–450. [PubMed] [Google Scholar]
- 24.Hu R, Jin H, Zhou S, Yang P, Li XT. Proteomic analysis of hypoxia-induced responses in the syncytialization of human placental cell line BeWo. Placenta. 2007;28:399–407. doi: 10.1016/j.placenta.2006.07.005. [DOI] [PubMed] [Google Scholar]
- 25.Nakamura J, Aoyagi S, Nanchi I, Nakatsuka SI, Hirata E, Shibata S, Fukuda M, Yamamoto Y. Overexpression of eukaryotic elongation factor eEF2 in gastrointestinal cancers and its involvement in G2/M progression in the cell cycle. Int J Oncol. 2009;34:1181–1189. [PubMed] [Google Scholar]
- 26.Martin-Benito J, Boskovic J, Gomez-Puertas P, Carrascosa JL, Torrey-Simons C, Lewis SA, Bartolini F, Cowan NJ, Valpuesta JM. Structure of eukaryotic prefoldin and of its complexes with unfolded actin and the cytosolic chaperonin CCT. EMBO J. 2002;21:6377–6386. doi: 10.1093/emboj/cdf640. [DOI] [PMC free article] [PubMed] [Google Scholar]
- 27.Lee Y, Smith RS, Jordan W, King BL, Won J, Valpuesta JM, Naggert JK, Nishina PM. Prefoldin 5 is required for normal sensory and neuronal development in a murine model. J Biol Chem. 2011;286:726–736. doi: 10.1074/jbc.M110.177352. [DOI] [PMC free article] [PubMed] [Google Scholar]
- 28.Lundin VF, Srayko M, Hyman A, Leroux MR. Efficient chaperone-mediated tubulin biogenesis is essential for cell division and cell migration in C. elegans. Dev Bio. 2008;313:320–334. doi: 10.1016/j.ydbio.2007.10.022. [DOI] [PubMed] [Google Scholar]
- 29.Zhang Z, Zhang L, Jia L, Cui S, Shi Y, Chang A, Zeng X, Wang P. AP-2α suppresses invasion in BeWo cells by repression of matrix metalloproteinase- 2 and -9 and up-regulation of E-cadherin. Mol Cell Biochem. 2013;381:31–39. doi: 10.1007/s11010-013-1685-8. [DOI] [PubMed] [Google Scholar]
- 30.Lee CL, Chiu PC, Hautala L, Salo T, Yeung WS, Stenman UH, Koistinen H. Human chorionic gonadotropin and its free beta-subunit stimulate trophoblast invasion independent of LH/hCG receptor. Mol Cell Endocrinol. 2013;375:43–52. doi: 10.1016/j.mce.2013.05.009. [DOI] [PubMed] [Google Scholar]
- 31.Bischop P, Campana A. A Putative role for oncogenes in trophoblast invasion? Hum Reprod. 2000;15:51–58. [PubMed] [Google Scholar]
- 32.Bischof P, Martelli M, Campana A, Itoh Y, Ogata Y, Nagase H. Importance of matrix metalloproteinases (MMP) in human trophoblast invasion. Early Pregnancy. 1995;1:263–269. [PubMed] [Google Scholar]
- 33.Liu W, Chen Y, Chang L. CIL-102 induces matrix metalloproteinase-2 (MMP-2)/MMP-9 down-regulation via simultaneous suppression of genetic transcription and mRNA stability. Int J Biochem Cell Biol. 2012;44:2212–2222. doi: 10.1016/j.biocel.2012.08.021. [DOI] [PubMed] [Google Scholar]
- 34.Wang JM, Zhao HX, Wang L, Gao ZY, Yao YQ. The human leukocyte antigen G promotes trophoblast fusion and β-hCG production through the Erk1/2 pathway in human choriocarcinoma cell lines. Biochem Biophys Res Commun. 2013;434:460–465. doi: 10.1016/j.bbrc.2013.04.004. [DOI] [PubMed] [Google Scholar]
- 35.McCormick J. Soluble HLA-G regulates motility and invasion of the trophoblast-derived cell line SGHPL-4. Hum Reprod. 2009;24:1339–1345. doi: 10.1093/humrep/dep026. [DOI] [PubMed] [Google Scholar]
- 36.Yie SM, Li LH, Li YM, Librach C. HLA-G protein concentrations in maternalserum and placental tissue are decreased in preeclampsia. Am J Obstet Gynecol. 2004;191:525–529. doi: 10.1016/j.ajog.2004.01.033. [DOI] [PubMed] [Google Scholar]
- 37.Darmochwal-Kolarz D, Kolarz B, Rolinski J, Leszczynska-Gorzelak B, Oleszczuk J. The concentrations of soluble HLA-G protein in serum were elevated during mid-gestation and decreased in pre-eclampsia. Folia Histochem Cytobiol. 2012;50:286–291. doi: 10.5603/fhc.2012.0023. [DOI] [PubMed] [Google Scholar]
- 38.Apps R, Gardner L, Sharkey AM, Holmes N, Moffett A. A homodimeric complex of HLA-G on normal trophoblast cells modulates antigen-presenting cells via LILRB1. Eur J Immunol. 2007;37:1924–1937. doi: 10.1002/eji.200737089. [DOI] [PMC free article] [PubMed] [Google Scholar]
- 39.LeMaoult J, Zafaranloo K, Le DC, Carosella ED. HLA-G up-regulates ILT2, ILT3, ILT4, and KIR2DL4 in antigen presenting cells, NK cells, and T cells. FASEB J. 2005;19:662–664. doi: 10.1096/fj.04-1617fje. [DOI] [PubMed] [Google Scholar]
- 40.Shiroishi M, Tsumoto K, Amano K, Shirakihara Y, Colonna M, Braud VM, Allan DS, Makadzange A, Rowland-Jones S, Willcox B, Jones EY, van der Merwe PA, Kumagai I, Maenaka K. Human inhibitory receptors Ig-like transcript 2 (ILT2) and ILT4 compete with CD8 for MHC class I binding and bind preferentially to HLA-G. Proc Natl Acad Sci U S A. 2003;100:8856–8861. doi: 10.1073/pnas.1431057100. [DOI] [PMC free article] [PubMed] [Google Scholar]
- 41.Fons P. Soluble HLA-G1 inhibits angiogenesis through an apoptotic pathway and by direct binding to CD160 receptor expressed by endothelial cells. Blood. 2006;108:2608–2615. doi: 10.1182/blood-2005-12-019919. [DOI] [PubMed] [Google Scholar]