

Abstract
OBJECTIVE
To determine the prevalence of residual β-cell function (RBF) in children after 3–6 years of type 1 diabetes, and to examine the association between RBF and incidence of severe hypoglycemia, glycemic control, and insulin requirements.
RESEARCH DESIGN AND METHODS
A total of 342 children (173 boys) 4.8–18.9 years of age with type 1 diabetes for 3–6 years were included. RBF was assessed by testing meal-stimulated C-peptide concentrations. Information regarding severe hypoglycemia within the past year, current HbA1c, and daily insulin requirements was retrieved from the medical records and through patient interviews.
RESULTS
Ninety-two children (27%) had RBF >0.04 nmol/L. Patients with RBF <0.04 nmol/L were significantly more likely to have severe hypoglycemia than patients with RBF >0.04 nmol/L (odds ratio, 2.59; 95% CI, 1.10–7.08; P < 0.03). HbA1c was significantly higher in patients with RBF <0.04 nmol/L compared with patients with RBF >0.04 nmol/L (mean, 8.49 ± 0.08% [69.3 ± 0.9 mmol/mol] vs. 7.92 ± 0.13% [63.1 ± 1.4 mmol/mol]; P < 0.01), and insulin requirements were significantly lower in patients with RBF >0.2 nmol/L (mean ± SE: 1.07 ± 0.02 vs. 0.93 ± 0.07 units/kg/day; P < 0.04).
CONCLUSIONS
We demonstrated considerable phenotypic diversity in RBF among children after 3–6 years of type 1 diabetes. Children with RBF are at lower risk for severe hypoglycemia, have better diabetes regulation, and have lower insulin requirements compared with children without RBF. There appears to be a lower limit for stimulated RBF of ∼0.04 nmol/L that confers a beneficial effect on hypoglycemia and metabolic control.
Type 1 diabetes is the result of a selective immune-mediated destruction of the insulin-producing β-cells in the islets of Langerhans in the pancreas (1). Partial remission of type 1 diabetes often is seen in children and adolescents soon after initiating insulin treatment, and it is characterized by continuous and effective endogenous insulin secretion. After this period of remission of variable duration, the autoimmune cellular-mediated destruction of the β-cells continues and the endogenous insulin production declines gradually (2–4).
The Diabetes Control and Complication Trial (DCCT) showed that a significant proportion of adults had sustained β-cell function several years after the onset of type 1 diabetes (5), and some type 1 diabetic patients even have detectable C-peptide after 50 years of diabetes (6). In adults, residual β-cell function (RBF) may have positive effects on diabetes regulation and complications. RBF may reduce the risk of hypoglycemia, improve metabolic control estimated by HbA1c, lower exogenous insulin requirements, and lower the risk of long-term complications (5,7–13). Based on data from the DCCT adult population, it was reported that the incidence of severe hypoglycemia varied with differences in RBF (7). In the group with the highest RBF, the lowest incidence of hypoglycemia occurred (7). Yet, even those with “minimal” RBF, defined as stimulated C-peptide level of 0.04–0.2 nmol/L, showed lower incidence of severe hypoglycemia compared with the group with undetectable RBF (7).
In children, the majority of studies of RBF have focused on the first year after clinical diagnosis (14–18). Data for RBF in children during later stages of type 1 diabetes and its effect on metabolic control and complications are scarce. In a population of 151 children with type 1 diabetes for 3 years, 23% had a stimulated C-peptide level of >0.06 nmol/L (19). Furthermore, in a case-control study, it was demonstrated that RBF was significantly higher in children without severe hypoglycemia compared with children with severe hypoglycemia (20).
The increasing incidence of diabetes in children with reduced contribution of high-risk HLA haplotypes (21,22) may have changed the type 1 diabetes phenotype toward an increased number of children with detectable C-peptide years after diagnosis, which may have favorable effects on the incidence of severe hypoglycemia and glycemic control. Therefore, the aims of this study were to investigate the phenotypical characteristics regarding RBF among Danish children with type 1 diabetes for a duration of 3–6 years; to examine possible benefits of RBF on the incidence of severe hypoglycemia, glycemic control, and insulin requirements; and, finally, to evaluate the data to determine whether there is a lower limit of RBF at which RBF exerts beneficial effect on the incidence of severe hypoglycemia and metabolic control.
RESEARCH DESIGN AND METHODS
Patients
Participants were identified from the registry of the Danish Study Group for Childhood Diabetes (DanDiabKids) and the associated biobank. The registry comprises all Danish children and adolescents with onset of type 1 diabetes before the age of 15 years. Information on children with diagnoses of type 1 diabetes for >3 years but <6 years was retrieved from the registry. Of 564 eligible children, 348 children and adolescents from 16 pediatric diabetes centers within Denmark agreed to participate in the study. Six children did not complete both blood samplings of the C-peptide stimulation test, leaving 342 children and adolescents with complete data for inclusion in the study.
Information regarding incidents of severe hypoglycemia within the past 12 months before participation was retrieved by interviewing patients and their guardians, as well as by reviewing their medical records. Similarly, current insulin administration form, dose, and the last HbA1c level were retrieved. From the registry, information regarding the annual centrally measured HbA1c level was obtained for patients (participants) as well as for the 222 eligible patients who declined participation or who did not complete the stimulation test (nonparticipants). To compare age and diabetes duration in participants versus nonparticipants, we used the age and duration of type 1 diabetes at the date of initiation of the project.
Mixed-meal stimulation test
The patients met at their usual outpatient clinic after an overnight fast, before using their morning insulin. If patients were treated with insulin by pen, then all morning insulin components were suspended before the mixed-meal stimulation test. Of 210 patients treated with multiple daily subcutaneous insulin injections, 124 were treated with basal insulin twice daily, whereas basal insulin was administered once daily during the evening to 59 patients (glargine for 5 patients) and once daily during the morning to 27 patients (glargine for 25 patients). If treated with continuous subcutaneous insulin, then the basal insulin was continued at a 25% reduced rate during fasting and during the mixed-meal test period. All patients underwent primary fasting blood sampling, followed by ingestion of a standardized liquid breakfast meal (6 mL/kg body weight; maximum, 360 mL; Boost drink/Sustacal, 237 mL containing 33 g carbohydrates, 15 g protein, 6 g fat, and 240 kcal). After 90 min, a blood sample was collected for analysis of meal-stimulated C-peptide concentration. All patients, except for one patient with high RBF, had meal-stimulated blood glucose >11.2 mmol/L. Subsequently, an appropriate insulin dose was administered.
C-peptide
Standard meal–stimulated C-peptide was used to assess the RBF as previously described (23–27). Serum samples during fasting and after stimulation were collected and stored at −80°C until analysis of C-peptide concentration using a fast-phase, fluoroimmunometric sandwich assay on a 1235 AutoDELPHIA (Perkin Elmer-Wallach, Turku, Finland). The detection limit was 0.01 nmol/L and the measuring range was 0.01–6.0 nmol/L. The intra-assay coefficients of variation were 4.3% (at 0.1 nmol/L), 4.7% (at 1.0 nmol/L), and 3.6% (at 2.5 nmol/L). The interassay coefficients of variation were 5.0% (at 0.1 nmol/L), 4.5% (at 1.0 nmol/L), and 2.7% (at 2.5 nmol/L). The C-peptide unit conversion (approximation) was performed as follows: C-peptide (ng/mL) = (3.0 × C-peptide [nmol/L]).
Meal-stimulated C-peptide concentrations were used for trichotomization by dividing participants into three RBF groups according to the stimulated C-peptide concentration levels reported by the DCCT study (7). Groups were defined as follows: high-RBF (with meal-stimulated C-peptide >0.2 nmol/L); low-RBF (with C-peptide between 0.04 and 0.2 nmol/L); and non-RBF (with C-peptide <0.04 nmol/L including undetectable C-peptide). The C-peptide concentration of 0.04 nmol/L was chosen as the cutoff for RBF when considering RBF as a dichotomous outcome (with or without RBF) because it was shown in the DCCT (7) to be the lower concentration limit of clinical relevance in adults.
Incidence of severe hypoglycemia
An incident of severe hypoglycemia was defined as an incident of confirmed hypoglycemia that led to loss of consciousness or seizure or both. The incidence is reported as incidence proportion, and it is given as the proportion of participants experiencing an incident within the past year per 100 participants.
HbA1c
HbA1c levels were measured at the participants’ local outpatient clinic (current HbA1c) as well as once during an annual centrally measured sample as part of the DanDiabKids registry and biobank (annual HbA1c). HbA1c was measured by high-performance liquid ion exchange or affinity chromatography standardized according to the American National Glycohemoglobin Standardization Program (NGSP), and is referred to as the NGSP standard (%) and as the International Federation of Clinical Chemistry and Laboratory Medicine (IFCC) standard (mmol/mol) (28). HbA1c unit conversion (approximation) was performed as follows: HbA1c (IFCC) = 10.93 × HbA1c (NGSP) % − 23.5.
HLA genotyping
HLA typing (DQB1) was performed as previously described (29). The HLA-DQB1 types were classified as follows: very high-risk genotypes (302/02); high-risk genotypes (302/302 and 302/X, where X is any allele except 02); moderate-risk genotypes (02/02 and 02/X, where X is any allele except 0302); and low-risk genotypes (604/x, 604/301, 603/304, 602/304, 602/301, 603/x, 602/x, 304/x, and 301/x).
Ethics
The Danish National Committee on Biomedical Research Ethics and the Danish Study Group for Childhood Diabetes approved the study. All participants and their parents or guardians provided written informed consent.
Statistical analysis
Student t tests (two-tailed), Wilcoxon rank-sum tests, or χ2 tests were used when appropriate. Spearman correlations were used for evaluation of the association between non-normally distributed data. Logistic regression was used when evaluating severe hypoglycemia as a dichotomous outcome, and when evaluating HbA1c levels <7.5% versus ≥7.5% as a dichotomous outcome. Multiple linear regression was used to evaluate the following: the association between current HbA1c [transformed by natural logarithm (logHbA1c)] as the dependent variable and RBF, with RBF divided into groups as the independent variable, and the association between insulin requirement {transformed by natural logarithm [log(insulin requirement)]} as the dependent variable and the RBF groups as the independent variable. The estimated differences in the ln scale were consequently exponentiated to obtain ratios of the medians, which are presented later. A variable with a possible independent effect on HbA1c levels is the center effect. This possible effect was investigated by the application of standardized z scores for HbA1c as ratios between each patient’s HbA1c value and the mean HbA1c level for that treatment center, thereby adjusting for the possible effects of differences in the absolute values of HbA1c between the different treatment centers.
Estimates are provided as mean ± SE for normally distributed data or as median (interquartile range) for skewed continuous data. P < 0.05 was considered statistically significant. Stata for Mac (Stata Statistical Software release 11; StataCorp, College Station, TX) statistical package was used for all analyses.
RESULTS
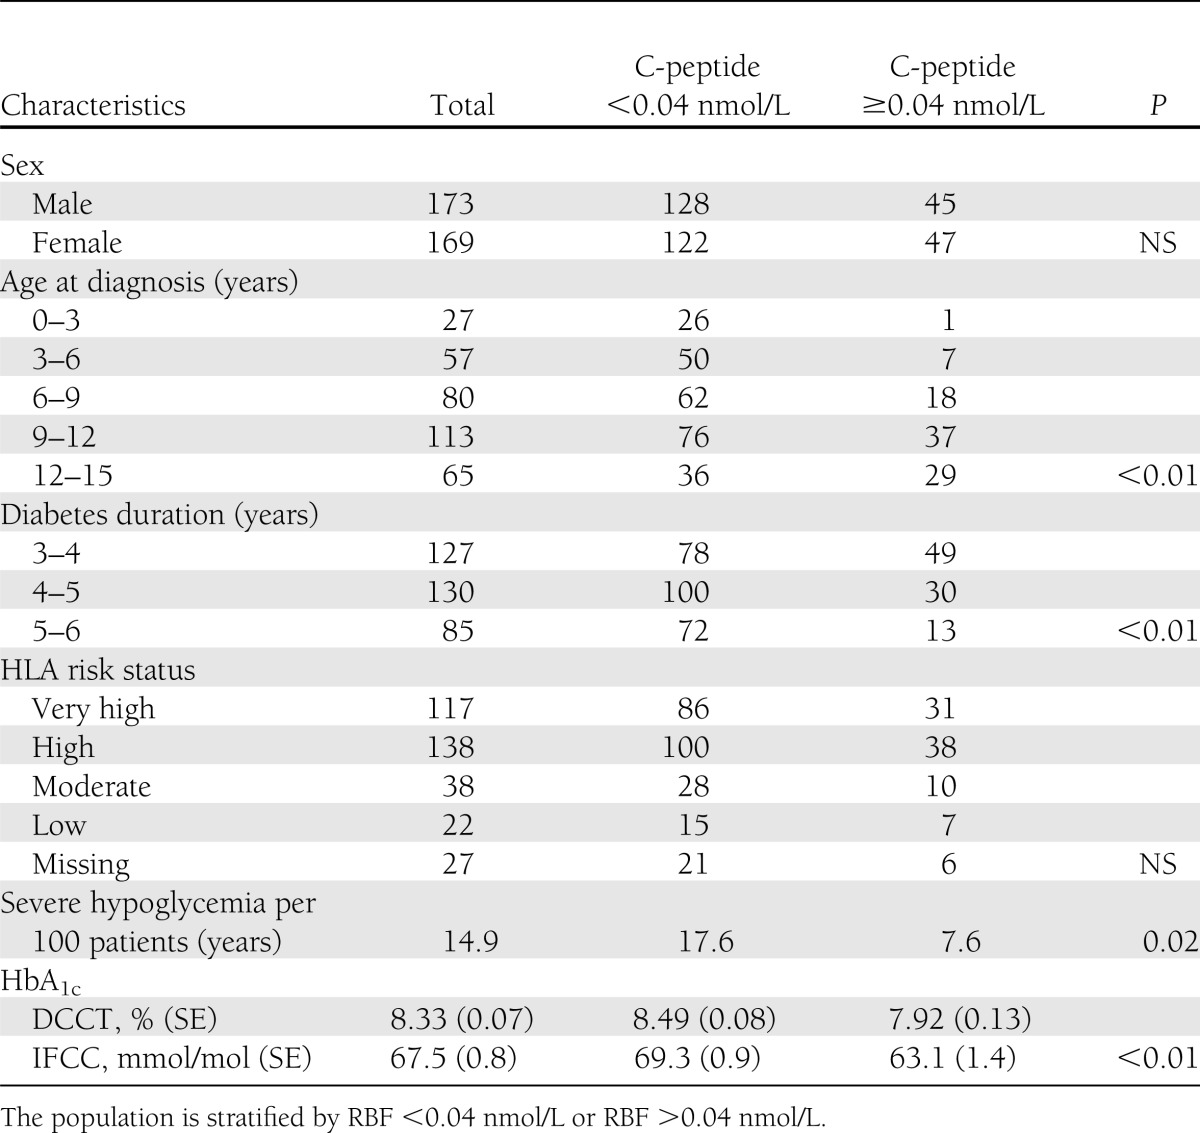
The study cohort of 342 children comprised 169 girls and 173 boys. The group included 61% of the total eligible population of Danish children and adolescents with type 1 diabetes for 3–6 years at the time of the study. Median age at type 1 diabetes onset was 9.2 years (interquartile range, 6.2–11.5); median age at inclusion in the study was 13.6 years (interquartile range, 10.8–15.7). Median diabetes duration was 4.2 years (interquartile range, 3.7–5.0). Four children were non-Caucasian and one child had a Danish father and a Philippine mother. Twenty-seven percent of the patients were treated by two insulin injections per day, 61% were treated by multiple subcutaneous insulin injections, and 12% were treated by continuous subcutaneous insulin injections. Patient characteristics stratified for C-peptide <0.04 nmol/L or >0.04 nmol/L are shown in Table 1.
Table 1.
Characteristics of the 342 patients by RBF as assessed by stimulated C-peptide
RBF after 3–6 years of type 1 diabetes
A total of 160 patients (46.8%) had detectable levels of meal-stimulated C-peptide (≥0.01 nmol/L); of these, 134 (39.2%) also had detectable levels of C-peptide during the fasting state, leaving 26 patients with only detectable meal-stimulated C-peptide. A strong correlation between fasting and meal-stimulated C-peptide levels was demonstrated (Spearman ρ = 0.93; P < 0.01). Ninety-two patients (27%) had meal-stimulated C-peptide concentrations (RBF) of >0.04 nmol/L. Of these, 65 patients (19%) had RBF between 0.04 and 0.2 nmol/L (low-RBF) and 27 patients (8%) had RBF >0.2 nmol/L (high-RBF). Eighty patients (23.3%) had stimulated RBF >0.06 nmol/L. There was no sex difference in RBF. Older age at diabetes onset increased the probability of having stimulated RBF >0.04 nmol/L, but 11% of children with diabetes onset before 7 years of age had stimulated RBF >0.04 nmol/L at 3–6 years after diabetes onset (Table 1). Long diabetes duration increased the probability of having RBF <0.04 nmol/L (Table 1).
Incidence of severe hypoglycemia
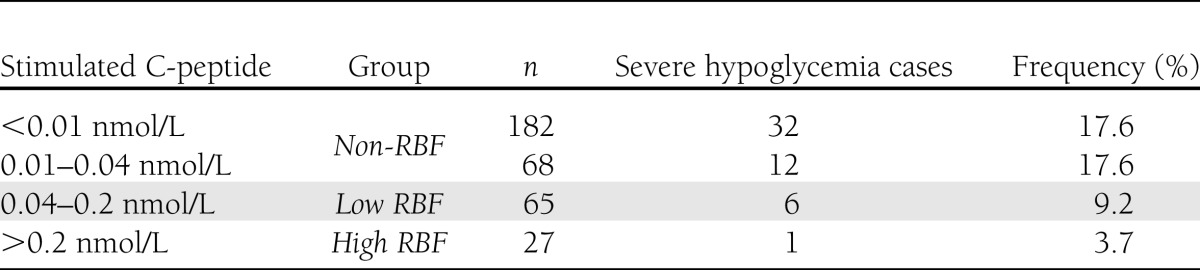
We observed the same high frequencies of severe hypoglycemia in the group with no detectable C-peptide as in the group with C-peptide <0.04 nmol/L (Table 2). In the group with C-peptide >0.04 but <0.2 nmol/L (low-RBF), and in the group with C-peptide >0.2 nmol/L (high-RBF), the frequency of severe hypoglycemia was considerably lower (Table 2). The incidence of severe hypoglycemic episodes in the low-RBF and high-RBF groups was 7.6 ± 2.8 per 100 patients, whereas in the non-RBF group it was 17.6 ± 2.4 per 100 participants (Table 1). Hence, the odds ratio (OR) for having a hypoglycemic incident in the non-RBF group compared with the low-RBF and high-RBF groups was 2.59 (95% CI, 1.10–7.08; P < 0.03). When adjusting for age, diabetes duration, sex, HbA1c level, daily insulin requirement, and insulin administration technique, logistic regression analysis revealed an adjusted OR of 2.65 (95% CI, 1.10–6.35; P < 0.03). Mean HbA1c in the group with hypoglycemia did not differ from that in the group without hypoglycemia (8.47 ± 0.17% [69.1 ± 1.9 mmol/mol] vs. 8.31 ± 0.08% [67.3 ± 0.9 mmol/mol]; P = 0.44). Mean daily insulin dose for the group with hypoglycemia was not different from that for the group without hypoglycemia (1.08 ± 0.04 units/kg/day vs. 1.06 ± 0.02 units/kg/day; P = 0.74).
Table 2.
Frequency of hypoglycemia by stimulated RBF
Metabolic control
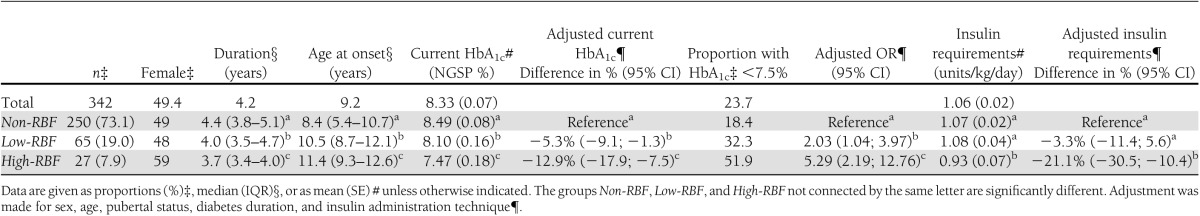
Mean HbA1c (±SE) in the total population was 8.33 ± 0.07% (67.5 ± 0.8 mmol/mol). When comparing the groups according to RBF, higher RBF levels were associated with lower current HbA1c. Mean HbA1c levels were 8.49 ± 0.08% (69.3 ± 0.09 mmol/mol) for the non-RBF group, 8.10 ± 0.16% (65.0 ± 1.7 mmol/mol) for the low-RBF group, and 7.47 ± 0.18% (58.1 ± 2.0 mmol/mol) for the high-RBF group (Table 3). The HbA1c levels thereby were reduced in the low-RBF group by 4.5% (P < 0.05) and by 12.0% (P < 0.01) (unadjusted levels) for the high-RBF group as compared with the non-RBF group. The difference between the low-RBF and high-RBF groups also was significant (P < 0.03) (Table 3). Multiple regression analysis using the current HbA1c levels (log HbA1c) as the dependent variable adjusting for sex, age, pubertal status, diabetes duration, and insulin administration technique showed adjusted HbA1c level reductions of 5.3% (P < 0.01) for the low-RBF group and 12.9% (P < 0.01) for the high-RBF group as compared with the non-RBF group (Table 3). The adjusted difference between the low-RBF and high-RBF groups also was significant (P < 0.03). The likelihood of having HbA1c <7.5% was found to be significantly associated with RBF levels and was found to be different across all three groups (Table 3), with proportions of participants having below-target levels being 18.4, 32.3, and 51.9% in the non-RBF, low-RBF, and high-RBF groups, respectively. Logistic regression revealed adjusted ORs for having HbA1c <7.5% to be 2.03 (P < 0.02) in the low-RBF group and 5.29 (P < 0.001) in the high-RBF group as compared with the non-RBF group.
Table 3.
Basic characteristics, HbA1c, and insulin requirements by RBF groups
Metabolic control and center effect
Multiple regression analysis using the standardized HbA1c level as the dependent variable yielded adjusted HbA1c reductions of 4.6% (95% CI, 0.6–8.7; P < 0.03) for the low-RBF group and 10.7% (95% CI, 4.8–16.6; P < 0.001) for the high-RBF group as compared with the non-RBF group. The HbA1c reductions in the low-RBF and high-RBF groups were approximately the same as those obtained when multiple regression analysis was conducted with the current HbA1c as the dependent variable instead of the standardized HbA1c. Therefore, the center effect seems negligible.
Insulin requirement
The insulin requirements showed significant differences between the high-RBF and the low-RBF and non-RBF groups (P < 0.05 and P < 0.05, respectively). No significant difference was detected between the low-RBF and non-RBF groups (Table 3). Multiple regression analysis revealed that the crude association did not change when adjusting for sex, age, pubertal status, diabetes duration, and insulin administration technique.
Participants compared with nonparticipants
Comparisons between participants and nonparticipants did not show any significant differences in sex, age at type 1 diabetes onset, diabetes duration, or mean annual HbA1c. Complete information for 20% of the participants and nonparticipants was not available from the registry.
CONCLUSIONS
The current study characterizes RBF evaluated as stimulated C-peptide 3–6 years after diabetes onset in a homogeneous, Danish, type 1 diabetic population. The study group included 342 children and adolescents, of whom 97% were positive for one or more diabetes-specific autoantibodies at diabetes onset (29). Great diversity concerning RBF phenotype was observed. We demonstrated that the group with RBF >0.04 nmol/L had significantly lower frequency of severe hypoglycemia and significantly lower HbA1c.
In total, 47% of the children had a meal-stimulated C-peptide level higher than our lower detection limit of 0.01 nmol/L. Stimulated C-peptide level equal to or just higher than our lower detection limit may not affect the clinical outcome but may serve as an autoantigen stimulus (29). Schiffrin et al. (19) found that 23% of 151 Canadian children and adolescents with type 1 diabetes onset during 1985–1988 had stimulated C-peptide >0.06 nmol/L at 3 years after diabetes onset. Remarkably, 20 years later, in our population of type 1 diabetic children the percentage with RBF >0.06 nmol/L also was 23%. This suggests that the proportion of diabetic children with RBF after 3 years of type 1 diabetes has not changed during the past two decades. Nordwall and Ludvigsson (30) came to the same conclusion using a Swedish type 1 diabetic population of 316 children with diabetes onset during the period 1976–2000. In a population of 2,789 children and adolescents with type 1 diabetes onset after 2000 in the United States, 10.7% had fasting C-peptide >0.08 nmol/L at 5 years after diabetes onset. However, due to the diverse ethnicity in that study population, the fact that 10% of the patients had diabetes onset in the age interval 15–19 years, and the fact that stimulated C-peptide was not performed, the study is not quite comparable to our study (31).
In patients who underwent islet transplantation, fasting C-peptide concentration >0.1 nmol/L (0.3 ng/mL), corresponding to stimulated C-peptide of ∼0.25 nmol/L (31), confers protection from severe hypoglycemia (32); in adults with type 1 diabetes, stimulated C-peptide concentration >0.2 nmol/L reduces the risk of severe hypoglycemia (13). We found that even lower stimulated C-peptide levels reduce the risk of severe hypoglycemia. However, our results indicate that there may be a limit of ∼0.04 nmol/L of stimulated C-peptide that confers a beneficial effect on the risk of severe hypoglycemia. Remarkably, Steffes et al. (7) also demonstrated differences in the risk of severe hypoglycemia depending on a cutoff point of stimulated RBF of 0.04 nmol/L in adults (7). Egger et al. (20) compared children who had experienced an episode of hypoglycemic coma with children without incidents of hypoglycemic coma and found significantly higher RBF in children without severe hypoglycemia compared with the children with one or more severe hypoglycemic episodes. In that study, HbA1c was significantly lower in the group experiencing one or more episodes of severe hypoglycemia than in the group without hypoglycemia (20). Although mean HbA1c was 9% in the group with hypoglycemia, Egger et al. (20) proposed a less tight glycemic control to reduce the frequency of severe hypoglycemia. We did not find any difference in HbA1c in the groups with and without hypoglycemia, nor did we find any difference in insulin requirements. The fewer severe hypoglycemia episodes in patients with some RBF may be partly attributable to preserved α-cells with the ability to secrete glucagon (7,33).
RBF correlated inversely with HbA1c levels in a dose-response–like manner throughout all groups, with a lower cutoff point of 0.04 nmol/L for the low-RBF group; the chance of having HbA1c <7.5% also was significantly higher in the high-RBF group compared with the other groups. In the DCCT, the cutoff point for an effect of RBF on HbA1c in adults was a stimulated C-peptide level >0.2 nmol/L (5); however, Nordwall and Ludvigsson (30) demonstrated lower HbA1c in children with fasting C-peptide >0.1 nmol/L. Schiffrin et al. (19) did not find any association between RBF and HbA1c.
Daily insulin requirement was lowest in the high-RBF group but was not different between the low-RBF and the non-RBF groups. Patients in the non-RBF group may have higher glucose variability (34), making it difficult to increase the insulin dose.
Strengths of the study
All participants had fasting and stimulated C-peptide levels measured 90 min after ingestion of a standard meal, which is a highly sensitive and specific measure of endogenous insulin secretion (27). Two of the authors performed all the tests and blood sample procedures. All C-peptide analyses were completed in two batches. The study group was a homogeneous Danish population with only a few non-Caucasians.
Limitations of the study
Thirty-nine percent of children eligible for the study according to the DanDiabKids registry did not participate. However, analysis of the nonparticipant group with data available from the registry showed no difference among participants and nonparticipants regarding age at diabetes onset, diabetes duration, and the value of the last centrally registered HbA1c. The HbA1c used for the study was analyzed locally, but we found no significant independent center effect.
Conclusion
In summary, we found in this homogenous, Danish, type 1 diabetic population of children and adolescents a considerable phenotypic diversity with respect to RBF at 3–6 years after the onset of diabetes. However, the phenotype diversity concerning RBF seems unchanged during the past 20 years. We demonstrated that RBF ≥0.04 nmol/L had a major beneficial effect on the frequency of severe hypoglycemia. Finally, we demonstrated that RBF as low as 0.04 nmol/L had a beneficial effect on HbA1c, whereas RBF of 0.2 nmol/L was needed to reduce the daily insulin requirements. Future efforts should focus on strategies to preserve RBF for as long as possible in children with type 1 diabetes. However, it appears that stimulated RBF of 0.04 nmol/L is the lower limit for providing beneficial effects on the frequency of severe hypoglycemia and metabolic control.
Acknowledgments
No potential conflicts of interest relevant to this article were reported.
J.S.S. conceived the study, acquired, analyzed, and interpreted data, and wrote and edited the manuscript. J.J. conceived the study, contributed to discussion, and reviewed the manuscript. F.P. performed C-peptide measurements and HLA genotyping, conceived the study, and reviewed the manuscript. K.K., J.T., N.T.H., and P.K. conceived the study and reviewed the manuscript. C.B. performed HLA genotyping. N.H.B. conceived the study, acquired and interpreted data, contributed to discussion, and reviewed the manuscript. N.H.B. is the guarantor of this work and, as such, had full access to all the data in the study and takes responsibility for the integrity of the data and the accuracy of the data analysis.
References
- 1.Bluestone JA, Herold K, Eisenbarth G. Genetics, pathogenesis and clinical interventions in type 1 diabetes. Nature. 29. 2010;464:1293–300. [DOI] [PMC free article] [PubMed]
- 2.Sherry NA, Tsai EB, Herold KC. Natural history of beta-cell function in type 1 diabetes. Diabetes 2005;54(Suppl. 2):S32–S39 [DOI] [PubMed] [Google Scholar]
- 3.Tsai EB, Sherry NA, Palmer JP, Herold KC. The rise and fall of insulin secretion in type 1 diabetes mellitus. Diabetologia 2006;49:261–270 [DOI] [PubMed] [Google Scholar]
- 4.Palmer JP. C-peptide in the natural history of type 1 diabetes. Diabetes Metab Res Rev 2009;25:325–328 [DOI] [PMC free article] [PubMed] [Google Scholar]
- 5.The DCCT Research Group Effects of age, duration and treatment of insulin-dependent diabetes mellitus on residual beta-cell function: observations during eligibility testing for the Diabetes Control and Complications Trial (DCCT). J Clin Endocrinol Metab 1987;65:30–36 [DOI] [PubMed] [Google Scholar]
- 6.Keenan HA, Sun JK, Levine J, et al. Residual insulin production and pancreatic β-cell turnover after 50 years of diabetes: Joslin Medalist Study. Diabetes 2010;59:2846–2853 [DOI] [PMC free article] [PubMed] [Google Scholar]
- 7.Steffes MW, Sibley S, Jackson M, Thomas W. Beta-cell function and the development of diabetes-related complications in the diabetes control and complications trial. Diabetes Care 2003;26:832–836 [DOI] [PubMed] [Google Scholar]
- 8.Sjöberg S, Gjötterberg M, Berglund L, Möller E, Ostman J. Residual C-peptide excretion is associated with a better long-term glycemic control and slower progress of retinopathy in type I (insulin-dependent) diabetes mellitus. J Diabet Complications 1991;5:18–22 [DOI] [PubMed] [Google Scholar]
- 9.Nakanishi K, Kobayashi T, Miyashita H, et al. Relationships among islet cell antibodies, residual beta-cell function, and metabolic control in patients with insulin-dependent diabetes mellitus of long duration: use of a sensitive C-peptide radioimmunoassay. Metabolism 1990;39:925–930 [DOI] [PubMed] [Google Scholar]
- 10.Nakanishi K, Watanabe C. Rate of beta-cell destruction in type 1 diabetes influences the development of diabetic retinopathy: protective effect of residual beta-cell function for more than 10 years. J Clin Endocrinol Metab 2008;93:4759–4766 [DOI] [PubMed] [Google Scholar]
- 11.Panero F, Novelli G, Zucco C, et al. Fasting plasma C-peptide and micro- and macrovascular complications in a large clinic-based cohort of type 1 diabetic patients. Diabetes Care 2009;32:301–305 [DOI] [PMC free article] [PubMed] [Google Scholar]
- 12.Mühlhauser I, Overmann H, Bender R, Bott U, Berger M. Risk factors of severe hypoglycaemia in adult patients with Type I diabetes—a prospective population based study. Diabetologia 1998;41:1274–1282 [DOI] [PubMed] [Google Scholar]
- 13.Effect of intensive therapy on residual beta-cell function in patients with type 1 diabetes in the diabetes control and complications trial. A randomized, controlled trial. The Diabetes Control and Complications Trial Research Group. Ann Intern Med 1998;128:517–523 [DOI] [PubMed]
- 14.Komulainen J, Knip M, Lounamaa R, et al. The Childhood Diabetes in Finland Study Group Poor beta-cell function after the clinical manifestation of type 1 diabetes in children initially positive for islet cell specific autoantibodies. Diabet Med 1997;14:532–537 [DOI] [PubMed] [Google Scholar]
- 15.Bonfanti R, Bognetti E, Meschi F, et al. Residual beta-cell function and spontaneous clinical remission in type 1 diabetes mellitus: the role of puberty. Acta Diabetol 1998;35:91–95 [DOI] [PubMed] [Google Scholar]
- 16.Böber E, Dündar B, Büyükgebiz A. Partial remission phase and metabolic control in type 1 diabetes mellitus in children and adolescents. J Pediatr Endocrinol Metab 2001;14:435–441 [DOI] [PubMed] [Google Scholar]
- 17.Picardi A, Visalli N, Lauria A, et al. Metabolic factors affecting residual beta cell function assessed by C-peptide secretion in patients with newly diagnosed type 1 diabetes. Horm Metab Res 2006;38:668–672 [DOI] [PubMed] [Google Scholar]
- 18.Mortensen HB, Swift PGF, Holl RW, et al. Hvidoere Study Group on Childhood Diabetes Multinational study in children and adolescents with newly diagnosed type 1 diabetes: association of age, ketoacidosis, HLA status, and autoantibodies on residual beta-cell function and glycemic control 12 months after diagnosis. Pediatr Diabetes 2010;11:218–226 [DOI] [PubMed] [Google Scholar]
- 19.Schiffrin A, Suissa S, Weitzner G, Poussier P, Lalla D. Factors predicting course of beta-cell function in IDDM. Diabetes Care 1992;15:997–1001 [DOI] [PubMed] [Google Scholar]
- 20.Egger M, Gschwend S, Smith GD, Zuppinger K. Increasing incidence of hypoglycemic coma in children with IDDM. Diabetes Care 1991;14:1001–1005 [DOI] [PubMed] [Google Scholar]
- 21.Fourlanos S, Varney MD, Tait BD, et al. The rising incidence of type 1 diabetes is accounted for by cases with lower-risk human leukocyte antigen genotypes. Diabetes Care 2008;31:1546–1549 [DOI] [PMC free article] [PubMed] [Google Scholar]
- 22.Gillespie KM, Bain SC, Barnett AH, et al. The rising incidence of childhood type 1 diabetes and reduced contribution of high-risk HLA haplotypes. Lancet 2004;364:1699–1700. [DOI] [PubMed]
- 23.Vendrame F, Zappaterreno A, Dotta F. Markers of beta cell function in type 1 diabetes mellitus. Minerva Med 2004;95:79–84 [PubMed] [Google Scholar]
- 24.Daneman D, Clarson C. Residual beta-cell function in children with type 1 diabetes: measurement and impact on glycemic control. Clin Invest Med 1987;10:484–487 [PubMed] [Google Scholar]
- 25.Palmer JP, Fleming GA, Greenbaum CJ, et al. C-peptide is the appropriate outcome measure for type 1 diabetes clinical trials to preserve beta-cell function: report of an ADA workshop, 21-22 October 2001. Diabetes 2004;53:250–264 [DOI] [PubMed] [Google Scholar]
- 26.Greenbaum CJ, Mandrup-Poulsen T, McGee PF, et al. Type 1 Diabetes Trial Net Research Group. European C-Peptide Trial Study Group Mixed-meal tolerance test versus glucagon stimulation test for the assessment of beta-cell function in therapeutic trials in type 1 diabetes. Diabetes Care 2008;31:1966–1971 [DOI] [PMC free article] [PubMed] [Google Scholar]
- 27.Besser REJ, Shields BM, Casas R, Hattersley AT, Ludvigsson J. Lessons from the mixed-meal tolerance test: use of 90-minute and fasting C-peptide in pediatric diabetes. Diabetes Care 2013;36:195–201 [DOI] [PMC free article] [PubMed] [Google Scholar]
- 28.Hoelzel W, Weykamp C, Jeppsson J-O, et al. IFCC Working Group on HbA1c Standardization IFCC reference system for measurement of hemoglobin A1c in human blood and the national standardization schemes in the United States, Japan, and Sweden: a method-comparison study. Clin Chem 2004;50:166–174 [DOI] [PubMed] [Google Scholar]
- 29.Sorensen JS, Vaziri-Sani F, Maziarz M, et al. Danish Study Group for Childhood Diabetes Islet autoantibodies and residual beta cell function in type 1 diabetes children followed for 3-6 years. Diabetes Res Clin Pract 2012;96:204–210 [DOI] [PubMed] [Google Scholar]
- 30.Nordwall M, Ludvigsson J. Clinical manifestations and beta cell function in Swedish diabetic children have remained unchanged during the last 25 years. Diabetes Metab Res Rev 2008;24:472–479 [DOI] [PubMed] [Google Scholar]
- 31.Greenbaum CJ, Anderson AM, Dolan LM, et al. SEARCH Study Group Preservation of beta-cell function in autoantibody-positive youth with diabetes. Diabetes Care 2009;32:1839–1844 [DOI] [PMC free article] [PubMed] [Google Scholar]
- 32.Barton FB, Rickels MR, Alejandro R, et al. Improvement in outcomes of clinical islet transplantation: 1999-2010. Diabetes Care 2012;35:1436–1445 [DOI] [PMC free article] [PubMed] [Google Scholar]
- 33.Taborsky GJ, Jr, Mundinger TO. Minireview: The role of the autonomic nervous system in mediating the glucagon response to hypoglycemia. Endocrinology 2012;153:1055–1062 [DOI] [PMC free article] [PubMed] [Google Scholar]
- 34.Sherr J, Tamborlane WV, Xing D, et al. Diabetes Research in Children Network (DirecNet) Study Group Achievement of target A1C levels with negligible hypoglycemia and low glucose variability in youth with short-term type 1 diabetes and residual β-cell function. Diabetes Care 2012;35:817–820 [DOI] [PMC free article] [PubMed] [Google Scholar]