

Abstract
OBJECTIVE
We investigated the association of fasting serum glycerol and fatty acids (FAs) as predictors for worsening of hyperglycemia and incident type 2 diabetes.
RESEARCH DESIGN AND METHODS
Cross-sectional and longitudinal analyses of the population-based METabolic Syndrome in Men (METSIM) Study included 9,398 Finnish men (mean age 57 ± 7 years). At baseline, levels of serum glycerol, free FAs (FFAs), and serum FA profile, relative to total FAs, were measured with proton nuclear magnetic resonance spectroscopy.
RESULTS
At baseline, levels of glycerol, FFAs, monounsaturated FAs, saturated FAs, and monounsaturated n-7 and -9 FAs, relative to total FAs, were increased in categories of fasting and 2-h hyperglycemia, whereas the levels of n-3 and n-6 FAs, relative to total FAs, decreased (N = 9,398). Among 4,335 men with 4.5-year follow-up data available, 276 developed type 2 diabetes. Elevated levels of glycerol, FFAs, monounsaturated FAs, and saturated and monounsaturated n-7 and -9 FAs, relative to total FAs, predicted worsening of hyperglycemia and development of incident type 2 diabetes after adjustment for confounding factors. n-6 FAs, mainly linoleic acid (LA), relative to total FAs, were associated with reduced risk for the worsening of hyperglycemia and conversion to type 2 diabetes.
CONCLUSIONS
Our large population-based study shows that fasting serum levels of glycerol, FFAs, monounsaturated FAs, saturated FAs, and n-7 and -9 FAs are biomarkers for an increased risk of development of hyperglycemia and type 2 diabetes, whereas high levels of serum n-6 FAs, reflecting dietary intake of LA, were associated with reduced risk for hyperglycemia and type 2 diabetes.
Increasing incidence and prevalence of type 2 diabetes worldwide is a global health burden for all societies. Therefore, the identification of early biomarkers, which, in high-risk individuals, predict progression to type 2 diabetes, is of great interest. Especially unique in this respect are biomarkers related to fatty acid (FA) metabolism. FAs have profound effects on insulin sensitivity and insulin secretion, the two major mechanisms leading to type 2 diabetes (1). Identification of serum FAs as biomarkers for the development of type 2 diabetes would be particularly important because their modification is possible by diet.
Insulin regulates the levels of glycerol and free FAs (FFAs) in serum by inhibiting lipolysis. In insulin-resistant states, increased lipolysis leads to the overproduction of glycerol and FFAs from triglycerides (1,2). Glycerol is a gluconeogenic substrate and stimulates gluconeogenesis (3), but its role as a predictor of type 2 diabetes has not been previously investigated. In contrast, fasting FFA levels (4–7) and total triglycerides (8) have been shown to predict type 2 diabetes in prospective studies.
In humans, essential FAs, linoleic acid (LA) and alfa-LA, are derived from diet only. A major monounsaturated FA, oleic acid (n-9), is derived from diet or by desaturation from stearic acid. A major monounsaturated n-7 FA, palmitoleic acid, is derived from palmitic acid by desaturation. Thus, serum FA profile is determined both by diet and endogenous FA metabolism (9). Previous studies have shown that the intake of saturated FAs increases the risk of type 2 diabetes (10), but the role of monounsaturated and polyunsaturated FAs has remained less clear (11–23). Many of the intervention studies have been small in size and the mechanisms by which n-7 and to a lesser extent even n-9 FAs may lead to an increased risk of diabetes have remained unclear. Reasons to divergent findings may be related to differences in the background diet and genetic variance, which modify the FA composition of serum lipids (24). Thus, the evidence that serum FAs modify the development of hyperglycemia and type 2 diabetes is still limited and inconclusive.
The aims of our study were 1) to investigate the association of the levels of glycerol and FFAs and serum FA profile with fasting and 2-h hyperglycemia in a large population-based cross-sectional METabolic Syndrome in Men (METSIM) Study; 2) to investigate glycerol, FFAs, and FAs as predictors for the worsening of hyperglycemia and incident type 2 diabetes in a 5-year follow-up study of the METSIM cohort; and 3) to investigate the role of insulin sensitivity and insulin secretion as mediators for the associations of glycerol and FAs with the deterioration of glycemia.
RESEARCH DESIGN AND METHODS
Study population
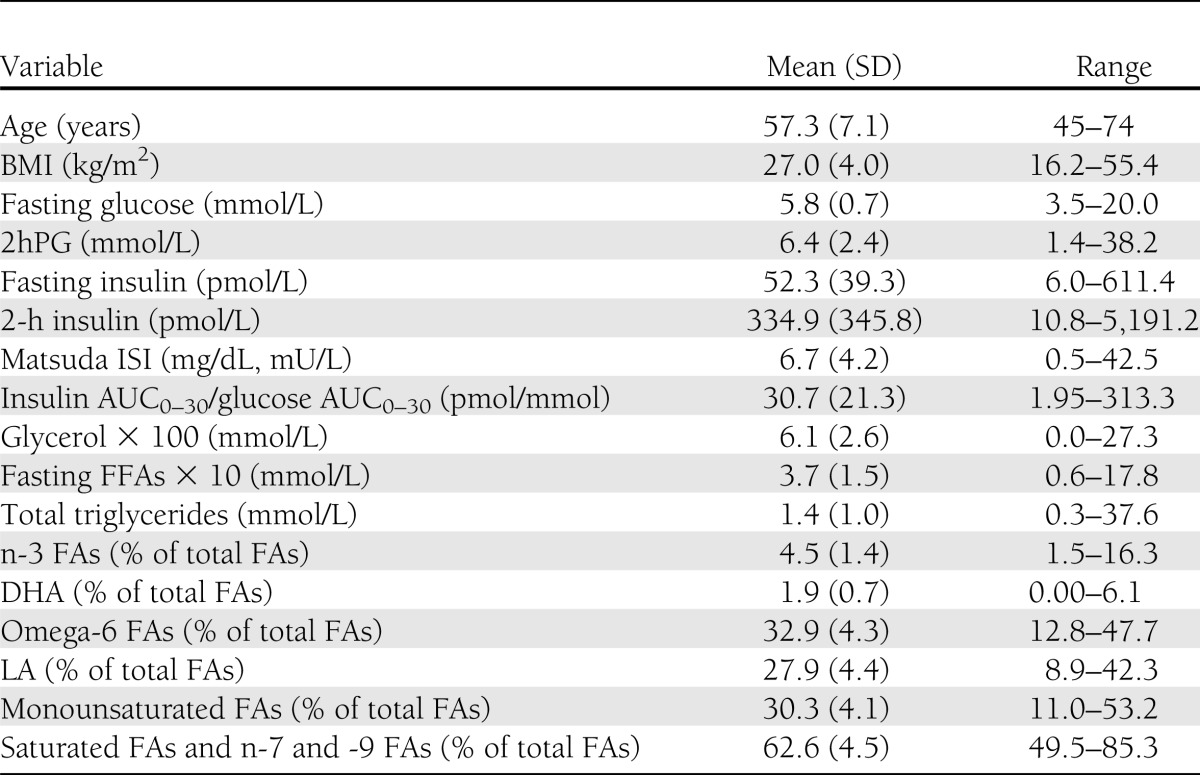
The cross-sectional analysis included 9,398 Finnish men from a population-based METSIM Study performed from 2005–2010 (age 57 ± 7 years; BMI 27.0 ± 4.0 kg/m2 [mean ± SD]) (25). Characteristics of participants relevant to the current study are given in Table 1. Glucose tolerance was classified according to the American Diabetes Association criteria (26) (32.3% had normal glucose tolerance [NGT], 46.2% had isolated impaired fasting glucose [IFG], 3.3% had isolated impaired glucose tolerance [IGT], 11.3% had both IFG and IGT, and 6.9% had newly diagnosed type 2 diabetes). Individuals with previously diagnosed type 1 or type 2 diabetes were excluded from all statistical analyses. A total of 4,335 nondiabetic men from the METSIM cohort have been so far reexamined in 2010–2013 (mean follow-up of 4.5 years), and 276 of them had developed newly diagnosed type 2 diabetes. The diagnosis of new diabetes was based either on an oral glucose tolerance test (OGTT) at our follow-up study or drug treatment for diabetes started between the baseline and follow-up studies.
Table 1.
Clinical and laboratory characteristics of the cross-sectional METSIM cohort (N = 9,398)
The study was approved by the Ethics Committee of the University of Eastern Finland and Kuopio University Hospital and was conducted in accordance with the principles of the Helsinki Declaration. All study participants gave written informed consent.
Anthropometric measurements
Height and weight were measured as previously described (25), and BMI was calculated as weight (kilograms) divided by height (meters) squared.
OGTT
A 2-h OGTT (75 g of glucose) was performed after a 12-h fasting, and samples for plasma glucose and insulin were drawn at 0, 30, and 120 min.
Laboratory measurements
Plasma glucose was measured by enzymatic hexokinase photometric assay (Konelab Systems reagents; Thermo Fischer Scientific, Vantaa, Finland). Plasma insulin was determined by immunoassay (ADVIA Centaur Insulin IRI no. 02230141; Siemens Medical Solutions Diagnostics, Tarrytown, NY). Serum total triglyceride levels (Konelab Systems Reagents; Thermo Fischer Scientific) and FFAs (Wako Chemicals, Neuss, Germany) were measured by enzymatic colorimetric methods. Proton nuclear magnetic resonance (NMR) spectroscopy was used to measure fasting glycerol, FFAs, and serum FA profile (n-3 FAs, n-6 FAs, n-7 and -9 FAs, saturated FAs, total FAs, LA, other polyunsaturated FAs, docosahexaenoic acid [DHA], and monounsaturated FAs, relative to total FAs) (27). Briefly, the fasting serum samples collected at the baseline study were stored at −80°C. For the glycerol assay, aliquots of each sample (300 μl) were mixed with 300 μl sodium phosphate buffer, and the samples were measured with a Bruker AVANCE III NMR spectrometer (Bruker Biospin, Rheinstetten, Germany) operating at 500.36 MHz using a Bruker 1D CPMG pulse sequence (Bruker Biospin) with water peak suppression. For lipid analysis, the above samples were extracted with a modified Folch protocol (28). The extracted lipids were dissolved to deuterochloroform, and standard one-dimensional 1H NMR spectra were measured. The quantification of glycerol and all of the above-mentioned FAs was performed using an automated regression-based quantification protocol (29). The results for FAs are expressed relative to total FAs and given as percentages in all tables and figures.
Calculations
The trapezoidal method was used to calculate the glucose and insulin areas under the curve (AUC) in an OGTT based on samples collected at 0, 30, and 120 min. Calculation of insulin sensitivity (Matsuda Insulin Sensitivity Index [ISI]) and insulin secretion (insulin AUC0–30/glucose AUC0–30) indices have been previously described (25,30). Disposition index (DI) was calculated as follows: DI = Matsuda ISI × insulin AUC0–30/glucose AUC0–30.
Statistical analysis
Statistical analyses were conducted using SPSS version 19 (SPSS, Chicago, IL). All traits except for age were log transformed to correct for their skewed distributions. Glycerol, FFAs, n-3 FAs (including DHA), n-6 FAs (including LA), monounsaturated FAs, saturated FAs, and n-7 and -9 FAs were compared across the fasting plasma glucose (FPG) and 2-h plasma glucose (2hPG) categories using general linear model adjusted for age and BMI. The associations among glycerol, FFAs, and aforementioned FAs with various traits were evaluated by Pearson and partial correlations. Linear regression model was used to evaluate fasting levels of glycerol, FFAs, and FAs measured at baseline as predictors for changes in glucose AUC in an OGTT at the 5-year follow-up study (4,205 men were included in this analysis after the exclusion of participants diagnosed with type 2 diabetes and started on antidiabetes medication between baseline and follow-up). Unstandardized effect sizes (B [SE]) were estimated by linear regression analysis using untransformed dependent variables. Logistic regression analysis was used to assess the association of levels of glycerol, FFAs, and FAs with incident type 2 diabetes during the follow-up. In all models, adjustment was done for age, BMI, current smoking (yes vs. no), and physical activity (physically active, regular exercise at least 30 min a week vs. physically less active, occasional exercise, or no exercise). The threshold of statistical significance in linear and logistic models was P < 5.5 × 10⁻³ given the nine traits tested.
RESULTS
Fasting levels of glycerol, FFAs, and FAs in serum in the categories of glucose tolerance
Glucose categories of FPG <5.0 mmol/L and 2hPG <5.0 mmol/L were set as the reference categories. Fasting levels of glycerol increased significantly across the FPG (P = 4.5 × 10⁻²⁸) and 2hPG (P = 1.2 × 10−99) categories. Glycerol levels increased in the FPG categories up to 23% in IFG and up to 95% in newly diagnosed diabetes and in the 2hPG categories up to 23, 45, and 56% in normoglycemia, IGT, and in newly diagnosed diabetes, respectively (Fig. 1). Similarly, fasting FFAs increased significantly across the entire range of FPG (P = 4.3 × 10−51) and 2hPG (P = 2.2 × 10−217) categories. FFAs increased up to 17% in IFG and further to 75% in newly diagnosed diabetes, to 28% in NGT, to 48% in IGT, and to 67% in newly diagnosed diabetes in 2hPG categories (Fig. 1).
Figure 1.

Mean values and their 95% CIs of fasting levels of glycerol (A and B) and FFAs (C and D) across the entire range of fasting and 2-h glucose categories in the cross-sectional METSIM Study cohort. P values (from ANOVA post hoc tests) indicating statistical significance with respect to the reference category (fasting or 2-h plasma glucose <5.0 mmol/L) are coded as follows: **P < 0.01. P values for trends, adjusted for age and BMI, were as follows: 4.5 × 10⁻²⁸(A), 1.2 × 10−99(B), 4.3 × 10−51(C), and 2.2 × 10−217(D).
n-3 FAs significantly decreased across the FPG (P = 1.0 × 10⁻³) and 2hPG (P = 1.9 × 10⁻⁴) categories (Fig. 2). They increased <5% in NGT and IFG, but decreased to −9% in newly diagnosed diabetes in the FPG categories and decreased to −7% in the newly diagnosed diabetes in the 2hPG categories. n-6 FAs also decreased across the FPG (P = 4.3 × 10−63) and 2hPG (P = 1.2 × 10−146) categories, especially in participants with newly diagnosed diabetes (−20 and −16% in the FPG and 2hPG categories, respectively).
Figure 2.

Mean values and their 95% CIs of fasting levels of n-3 FAs (A and B), n-6 FAs (C and D), monounsaturated FAs (E and F), and saturated FAs and n-7 and -9 FAs (G and H) across the entire range of fasting and 2-h glucose categories in the cross-sectional METSIM Study cohort. P values (from ANOVA post hoc tests) indicating statistical significance with respect to the reference category (fasting or 2hPG <5.0 mmol/L) are coded as follows: *P < 0.05, **P < 0.01. P values for trends, adjusted for age and BMI, were as follows: 1.0 × 10⁻³ (A), 1.9 × 10⁻⁴ (B), 4.3 × 10−63 (C), 1.2 × 10−146 (D), 3.9 × 10−41 (E), 2.0 × 10−78 (F), 5.1 × 10−52 (G), and 6.1 × 10−132 (H).
Fasting levels of monounsaturated FAs significantly increased across the FPG (P = 3.9 × 10−41) and 2hPG (P = 2.0 × 10−78) categories (Fig. 2). In the FPG categories, the levels of monounsaturated FAs increased up to 8 and 17% in IFG and newly diagnosed diabetes, respectively. In the 2hPG categories, the levels of monounsaturated FAs increased 11% in IGT and 13% in newly diagnosed diabetes.
Fasting levels of saturated FAs and n-7 and -9 FAs significantly increased across the FPG (P = 5.1 × 10−52) and 2hPG (P = 6.1 × 10−132) categories (Fig. 2). In the FPG categories, the levels of saturated and n-7 and -9 FAs increased up to 5 and 12% in IFG and newly diagnosed diabetes, respectively. In the 2hPG categories, the levels of saturated FAs and n-7 and -9 FAs increased up to 7 and 9% in IGT and newly diagnosed diabetes, respectively.
Pearson correlations of fasting levels of glycerol, FFAs, and serum FAs with various traits of glucose metabolism
Fasting levels of glycerol, FFAs, monounsaturated FAs, saturated FAs, and n-7 and n-9 FAs all correlated positively with fasting and 2hPG levels (correlations between 0.121 and 0.313) and negatively with Matsuda ISI (correlations of −0.307, −0.154, −0.315, and −0.397, respectively), whereas n-3 and n-6 FAs correlated positively with Matsuda ISI (r = 0.053 and r = 0.386, respectively) (Supplementary Table 1). Glycerol and saturated and n-7 and -9 FAs correlated positively (r = 0.164 and r = 0.254, respectively) and n-6 FAs negatively (r = −0.235) with insulin secretion (insulin AUC0–30/glucose AUC0–30). Adjustment for age and BMI attenuated the correlations, but most of the correlations remained statistically significant (Supplementary Table 2).
Glycerol, FFAs, and serum FAs as predictors for the worsening of hyperglycemia and incident diabetes
During a mean 4.5-year follow-up (range 2.5–6.2 years), a total of 276 of 4,335 men developed incident type 2 diabetes. Fasting levels of glycerol (P = 9.1 × 10−39), FFAs (P = 4.6 × 10−42), total triglycerides (P = 3.4 × 10⁻²¹), monounsaturated FAs (P = 6.4 × 10⁻¹⁶), saturated FAs, n-7 FAs, and n-9 FAs (P = 3.3 × 10⁻²⁶), adjusted for age, BMI, smoking, and physical activity, predicted an increase in the glucose AUC (Table 2). In contrast, n-6 FAs (including LA) significantly reduced glucose AUC at follow-up (P = 1.8 × 10⁻²⁶). In logistic regression analysis, fasting levels of glycerol (odds ratio [OR] 1.18 [95% CI 1.12–1.24]), FFAs (OR 1.19 [95% CI 1.10–1.29]), total triglycerides (OR 1.26, [95% CI 1.11–1.44]), monounsaturated FAs (OR 1.09 [95% CI 1.06–1.12]), and saturated FAs, n-7 FAs, and n-9 FAs (OR 1.09 [95% CI 1.06–1.12]) significantly predicted an increase in the risk of incident type 2 diabetes. In contrast, fasting levels of n-6 FAs significantly predicted a decrease in incident type 2 diabetes (OR 0.92 [95% CI 0.89–0.95]). n-3 FAs (including DHA) did not predict changes in glucose AUC or incident type 2 diabetes.
Table 2.
Association of baseline levels of glycerol, fasting FFAs, total triglycerides, and n-FAs with glucose AUC and incident type 2 diabetes at the 5-year follow-up of the METSIM cohort
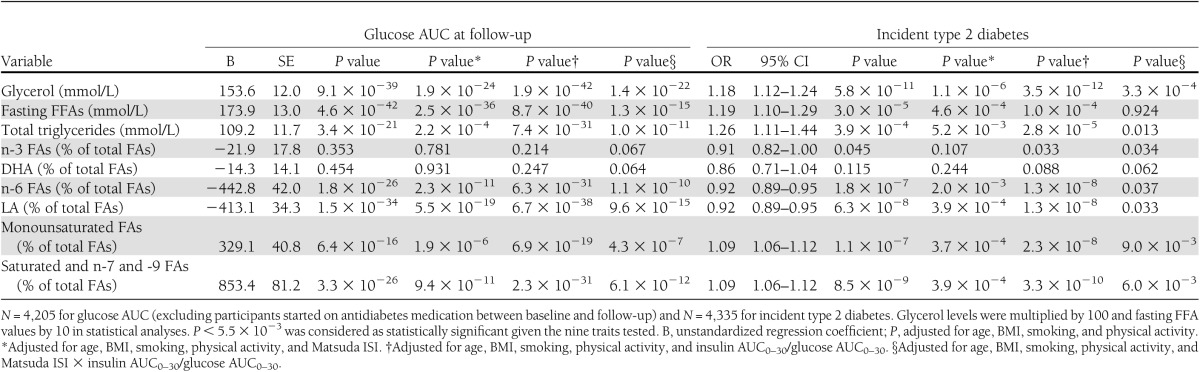
Adjustment for Matsuda ISI, in addition to age, BMI, smoking, and physical activity, substantially weakened most of the associations of glycerol, FFAs, total triglycerides, n-6 FAs, monounsaturated FAs, and saturated, n-7, and n-9 FAs with glucose AUC and incident diabetes (Table 2). In contrast, adjustment for insulin secretion did not have any major effect on these associations. Adjustment for DI, which takes into account both insulin sensitivity and insulin secretion, resulted in quite similar P values as adjustment for Matsuda ISI alone.
CONCLUSIONS
Our cross-sectional analysis of the METSIM Study of 9,398 men showed that fasting levels of glycerol, FFAs, monounsaturated FAs, saturated FAs, and monounsaturated n-7 and n-9 FAs significantly increased with fasting and 2-h glycemia, whereas the levels of n-3 and n-6 FAs decreased in the diabetic range. Our 4.5-year follow-up study of 4,335 men showed that fasting levels of glycerol, FFAs, total triglycerides, monounsaturated FAs, and saturated, n-7, and -9 FAs predicted the deterioration of hyperglycemia and incident type 2 diabetes, whereas n-6 FAs (mainly LA) were preventive of hyperglycemia and type 2 diabetes.
Glycerol and FFAs
We demonstrated that fasting levels of glycerol and FFAs were increased not only in newly diagnosed diabetes but also in IFG and IGT in a cross-sectional analysis of the METSIM Study. More important, we demonstrated that fasting levels of glycerol, total triglycerides, and FFAs predicted an increase in glucose AUC and the development of new-onset type 2 diabetes in our prospective 5-year follow-up of the METSIM cohort.
We measured insulin sensitivity and insulin secretion with validated indices (25) and evaluated their roles in the prediction of worsening of hyperglycemia and incident diabetes by glycerol, total triglycerides, and FFAs. Our 4.5-year follow-up of the METSIM cohort showed that adjustments for insulin sensitivity (Matsuda ISI) or DI attenuated the associations of glycerol, total triglycerides, and FFAs with glucose AUC with incident type 2 diabetes. In contrast, adjustment for insulin secretion alone did not significantly alter these results. Our findings do not implicate, however, that insulin resistance is a causal mechanism for the association of elevated levels of glycerol and FFAs with the worsening of hyperglycemia and incident diabetes. Dietary intake or other factors could also play an important role in these associations.
FAs
Elevated levels of n-3 and n-6 FAs, monounsaturated FAs, and saturated, n-7, and n-9 FAs have been linked to hyperglycemia in some previous studies (12,13,18–20), although the evidence is conflicting. Human intervention trials suggest that saturated FAs, relative to unsaturated FAs, could lead to insulin resistance (23). We demonstrated that monounsaturated FAs and saturated, n-7, and n-9 FAs predicted the worsening of hyperglycemia and the development type 2 diabetes in a 4.5-year follow-up of the METSIM cohort, independent of known risk factors for type 2 diabetes.
Three previous studies have linked elevated risk of type 2 diabetes with n-7 FAs (palmitoleic acid) (18–20), but did not find association with n-9 FA (oleic acid) and did not investigate in detail the mechanisms explaining these associations. Findings on the association of n-3 FAs and n-6 FAs with incident type 2 diabetes are conflicting and inconclusive (12,13,18). We demonstrated a significant association of n-6 FAs (mainly LA) with a reduction in the development of hyperglycemia and type 2 diabetes. LA is derived from diet only, but it can be metabolized to longer chain unsaturated FAs. The finding that also monounsaturated FAs (palmitoleic and oleic acids) were related to increased risk of impaired glucose metabolism and type 2 diabetes in the current study may be explained by the fact that major saturated FAs are desaturated to monounsaturated FAs and that in the Western diet, saturated FAs and monounsaturated FAs are positively correlated (31,32).
The levels of n-6 FAs correlated positively with insulin sensitivity. In contrast, monounsaturated FAs, saturated, and n-7 and -9 FAs showed negative correlations with insulin sensitivity, which is in agreement with previous findings of an inverse association of n-7 FAs with insulin sensitivity (33,34).The adjustment for Matsuda ISI, but not for insulin secretion, attenuated the associations of n-6 FAs (including LA), monounsaturated FAs, saturated FAs, and n-7 and -9 FAs with glucose AUC and incident type 2 diabetes. However, causal directions are not possible to conclude from our study given the fact that diet and other factors modify insulin sensitivity and that we did not have dietary assessment in the METSIM study.
Strengths and limitations
Strengths of our study are a large population-based cohort including a careful clinical and laboratory characterization of participants and the measurements of insulin sensitivity and insulin secretion using validated markers (25). The diagnosis of new type 2 diabetes was based on an OGTT or drug treatment for diabetes. Limitations of our study are that only middle-aged and elderly Finnish men were included in the study, and therefore, it is unclear whether our results are applicable to women and other ethnic and racial groups. The study did not include dietary data, and therefore, we were unable to adjust for dietary intake in statistical analyses, which limits making conclusions from the associations reported. Additionally, we could not investigate all individual FAs in detail because of the limitations of the proton NMR technique. However, results for DHA and LA, the main dietary n-3 and n-6 FAs, were similar to those of total n-3 and n-6 FAs.
Clinical implications
Given the constant increase in the incidence and prevalence of type 2 diabetes worldwide, there is an increasing interest in the prevention of this disease. Polyunsaturated FAs have been of particular interest given their role in pathophysiological processes related to cardiovascular disease. However, recent meta-analyses and systematic reviews (35–38) and the Outcome Reduction with Initial Glargine Intervention (ORIGIN) trial (38) have not provided evidence that n-3 supplementation is associated with lower mortality and morbidity of cardiovascular causes. In our study, based on the measurement of n-FAs in the serum, we did not observe any association of n-3 FAs with insulin sensitivity and with decreased risk of type 2 diabetes. In contrast, high levels of n-6 FAs (mainly LA) were associated with high insulin sensitivity and prevention of type 2 diabetes. However, conclusive trial evidence on the effects of n-6 FA supplementation on the prevention of type 2 diabetes is still missing, and therefore, the clinical significance of our results remains to be proven. Major dietary saturated FAs and their unsaturated metabolites seem to increase the risk of type 2 diabetes. Therefore, our results suggest that replacing saturated FAs by (poly)unsaturated FAs may be beneficial both in the prevention of type 2 diabetes and cardiovascular diseases.
Supplementary Material
Acknowledgments
This work has been supported by the Academy of Finland (M.L.); Responding to Public Health Challenges Research Programme (M.A.-K.); the Finnish Diabetes Research Foundation (M.L.); the Finnish Cardiovascular Research Foundation (M.A.-K. and M.L.); the Jenny and Antti Wihuri Foundation (A.J.K.); the Strategic Research Funding from the University of Oulu, Finland (M.A.-K.); the Strategic Research Funding from the University of Eastern Finland, Kuopio, Finland (M.L.); and EVO Grant 5263 from the Kuopio University Hospital (M.L.).
No potential conflicts of interest relevant to this article were reported.
The funding bodies named above had no role in the design and conduct of the study; collection, management, analysis, and interpretation of the data; and preparation, review, or approval of the manuscript.
Y.M. wrote the manuscript and researched the data. H.C. and J.V. researched the data and reviewed and edited the manuscript. A.J.K. analyzed NMR data, contributed to analysis tools, and reviewed and edited the manuscript. P.S. conceived, designed, and performed the NMR experiments; analyzed the data; and reviewed and edited the manuscript. J.K. designed the study and reviewed the manuscript. M.U. contributed to discussion and reviewed and edited the manuscript. M.A.-K. conceived and designed the NMR experiments, analyzed the data, and reviewed and edited the manuscript. M.L. designed the study, contributed to discussion, and reviewed and edited the manuscript. M.L. is the guarantor of this work and, as such, had full access to all the data in the study and takes responsibility for the integrity of the data and the accuracy of the data analysis.
Footnotes
This article contains Supplementary Data online at http://care.diabetesjournals.org/lookup/suppl/doi:10.2337/dc13-0800/-/DC1.
References
- 1.Eckel RH, Alberti KG, Grundy SM, Zimmet PZ. The metabolic syndrome. Lancet 2010;375:181–183 [DOI] [PubMed] [Google Scholar]
- 2.Hagen JH, Moorhouse JA, Steinberg J. Effect of insulin on plasma glycerol in man. Metabolism 1963;12:346–351 [PubMed] [Google Scholar]
- 3.Funahashi T, Nagasawa A, Hibuse T, Maeda N. Impact of glycerol gateway molecule in adipocytes. Cell Mol Biol (Noisy-le-grand) 2006;52:40–45 [PubMed] [Google Scholar]
- 4.Salgin B, Ong KK, Thankamony A, Emmett P, Wareham NJ, Dunger DB. Higher fasting plasma free fatty acid levels are associated with lower insulin secretion in children and adults and a higher incidence of type 2 diabetes. J Clin Endocrinol Metab 2012;97:3302–3309 [DOI] [PubMed] [Google Scholar]
- 5.Paolisso G, Tataranni PA, Foley JE, Bogardus C, Howard BV, Ravussin E. A high concentration of fasting plasma non-esterified fatty acids is a risk factor for the development of NIDDM. Diabetologia 1995;38:1213–1217 [DOI] [PubMed] [Google Scholar]
- 6.Pankow JS, Duncan BB, Schmidt MI, et al. Atherosclerosis Risk in Communities Study Fasting plasma free fatty acids and risk of type 2 diabetes: the atherosclerosis risk in communities study. Diabetes Care 2004;27:77–82 [DOI] [PubMed] [Google Scholar]
- 7.Charles MA, Eschwège E, Thibult N, et al. The role of non-esterified fatty acids in the deterioration of glucose tolerance in Caucasian subjects: results of the Paris Prospective Study. Diabetologia 1997;40:1101–1106 [DOI] [PubMed] [Google Scholar]
- 8.Hjellvik V, Sakshaug S, Strøm H. Body mass index, triglycerides, glucose, and blood pressure as predictors of type 2 diabetes in a middle-aged Norwegian cohort of men and women. Clin Epidemiol 2012;4:213–224 [DOI] [PMC free article] [PubMed] [Google Scholar]
- 9.Baylin A, Campos H. The use of fatty acid biomarkers to reflect dietary intake. Curr Opin Lipidol 2006;17:22–27 [DOI] [PubMed] [Google Scholar]
- 10.Feskens EJ, van Dam RM. Dietary fat and the etiology of type 2 diabetes: an epidemiological perspective. Nutr Metab Cardiovasc Dis 1999;9:87–95 [PubMed] [Google Scholar]
- 11.Zheng JS, Huang T, Yang J, Fu YQ, Li D. Marine N-3 polyunsaturated fatty acids are inversely associated with risk of type 2 diabetes in Asians: a systematic review and meta-analysis. PLoS ONE 2012;7:e44525. [DOI] [PMC free article] [PubMed] [Google Scholar]
- 12.Djoussé L, Biggs ML, Lemaitre RN, et al. Plasma omega-3 fatty acids and incident diabetes in older adults. Am J Clin Nutr 2011;94:527–533 [DOI] [PMC free article] [PubMed] [Google Scholar]
- 13.Hodge AM, English DR, O’Dea K, et al. Plasma phospholipid and dietary fatty acids as predictors of type 2 diabetes: interpreting the role of linoleic acid. Am J Clin Nutr 2007;86:189–197 [DOI] [PubMed] [Google Scholar]
- 14.Patel PS, Sharp SJ, Jansen E, et al. Fatty acids measured in plasma and erythrocyte-membrane phospholipids and derived by food-frequency questionnaire and the risk of new-onset type 2 diabetes: a pilot study in the European Prospective Investigation into Cancer and Nutrition (EPIC)-Norfolk cohort. Am J Clin Nutr 2010;92:1214–1222 [DOI] [PubMed] [Google Scholar]
- 15.Huang T, Wahlqvist ML, Xu T, Xu A, Zhang A, Li D. Increased plasma n-3 polyunsaturated fatty acid is associated with improved insulin sensitivity in type 2 diabetes in China. Mol Nutr Food Res 2010;54(Suppl. 1):S112–S119 [DOI] [PubMed] [Google Scholar]
- 16.Nigam A, Frasure-Smith N, Lespérance F, Julien P. Relationship between n-3 and n-6 plasma fatty acid levels and insulin resistance in coronary patients with and without metabolic syndrome. Nutr Metab Cardiovasc Dis 2009;19:264–270 [DOI] [PubMed] [Google Scholar]
- 17.Haag M, Dippenaar NG. Dietary fats, fatty acids and insulin resistance: short review of a multifaceted connection. Med Sci Monit 2005;11:RA359–RA367 [PubMed] [Google Scholar]
- 18.Wang L, Folsom AR, Zheng ZJ, Pankow JS, Eckfeldt JH, ARIC Study Investigators Plasma fatty acid composition and incidence of diabetes in middle-aged adults: the Atherosclerosis Risk in Communities (ARIC) study. Am J Clin Nutr 2003;78:91–98 [DOI] [PubMed] [Google Scholar]
- 19.Vessby B, Aro A, Skarfors E, Berglund L, Salminen I, Lithell H. The risk to develop NIDDM is related to the fatty acid composition of the serum cholesterol esters. Diabetes 1994;43:1353–1357 [DOI] [PubMed] [Google Scholar]
- 20.Laaksonen DE, Lakka TA, Lakka HM, et al. Serum fatty acid composition predicts development of impaired fasting glycaemia and diabetes in middle-aged men. Diabet Med 2002;19:456–464 [DOI] [PubMed] [Google Scholar]
- 21.Würtz P, Tiainen M, Mäkinen VP, et al. Circulating metabolite predictors of glycemia in middle-aged men and women. Diabetes Care 2012;35:1749–1756 [DOI] [PMC free article] [PubMed] [Google Scholar]
- 22.Vessby B, Uusitupa M, Hermansen K, et al. KANWU Study Substituting dietary saturated for monounsaturated fat impairs insulin sensitivity in healthy men and women: the KANWU Study. Diabetologia 2001;44:312–319 [DOI] [PubMed] [Google Scholar]
- 23.Lichtenstein AH, Schwab US. Relationship of dietary fat to glucose metabolism. Atherosclerosis 2000;150:227–243 [DOI] [PubMed] [Google Scholar]
- 24.Corella D, Ordovás JM. Interactions between dietary n-3 fatty acids and genetic variants and risk of disease. Br J Nutr 2012;107(Suppl. 2):S271–S283 [DOI] [PMC free article] [PubMed] [Google Scholar]
- 25.Stancáková A, Javorský M, Kuulasmaa T, Haffner SM, Kuusisto J, Laakso M. Changes in insulin sensitivity and insulin release in relation to glycemia and glucose tolerance in 6,414 Finnish men. Diabetes 2009;58:1212–1221 [DOI] [PMC free article] [PubMed] [Google Scholar]
- 26.American Diabetes Association Standards of medical care in diabetes. Diabetes Care 2004;27(Suppl. 1):S15–S35 [DOI] [PubMed] [Google Scholar]
- 27.Soininen P, Kangas AJ, Würtz P, et al. High-throughput serum NMR metabonomics for cost-effective holistic studies on systemic metabolism. Analyst (Lond) 2009;134:1781–1785 [DOI] [PubMed] [Google Scholar]
- 28.Tukiainen T, Tynkkynen T, Mäkinen VP, et al. A multi-metabolite analysis of serum by 1H NMR spectroscopy: early systemic signs of Alzheimer’s disease. Biochem Biophys Res Commun 2008;375:356–361 [DOI] [PubMed] [Google Scholar]
- 29.Kettunen J, Tukiainen T, Sarin AP, et al. Genome-wide association study identifies multiple loci influencing human serum metabolite levels. Nat Genet 2012;44:269–276 [DOI] [PMC free article] [PubMed] [Google Scholar]
- 30.Matsuda M, DeFronzo RA. Insulin sensitivity indices obtained from oral glucose tolerance testing: comparison with the euglycemic insulin clamp. Diabetes Care 1999;22:1462–1470 [DOI] [PubMed] [Google Scholar]
- 31.Sundström J, Lind L, Vessby B, Andrén B, Aro A, Lithell H. Dyslipidemia and an unfavorable fatty acid profile predict left ventricular hypertrophy 20 years later. Circulation 2001;103:836–841 [DOI] [PubMed] [Google Scholar]
- 32.Kouki R, Schwab U, Hassinen M, et al. Food consumption, nutrient intake and the risk of having metabolic syndrome: the DR’s EXTRA Study. Eur J Clin Nutr 2011;65:368–377 [DOI] [PubMed] [Google Scholar]
- 33.Lovejoy JC, Champagne CM, Smith SR, et al. Relationship of dietary fat and serum cholesterol ester and phospholipid fatty acids to markers of insulin resistance in men and women with a range of glucose tolerance. Metabolism 2001;50:86–92 [DOI] [PubMed] [Google Scholar]
- 34.Vessby B, Tengblad S, Lithell H. Insulin sensitivity is related to the fatty acid composition of serum lipids and skeletal muscle phospholipids in 70-year-old men. Diabetologia 1994;37:1044–1050 [DOI] [PubMed] [Google Scholar]
- 35.Rizos EC, Ntzani EE, Bika E, Kostapanos MS, Elisaf MS. Association between omega-3 fatty acid supplementation and risk of major cardiovascular disease events: a systematic review and meta-analysis. JAMA 2012;308:1024–1033 [DOI] [PubMed] [Google Scholar]
- 36.Jeppesen C, Schiller K, Schulze MB. Omega-3 and omega-6 fatty acids and type 2 diabetes. Curr Diab Rep 2013;13:279–288 [DOI] [PubMed] [Google Scholar]
- 37.Czernichow S, Thomas D, Bruckert E. n-6 Fatty acids and cardiovascular health: a review of the evidence for dietary intake recommendations. Br J Nutr 2010;104:788–796 [DOI] [PubMed] [Google Scholar]
- 38.Bosch J, Gerstein HC, Dagenais GR, et al. ORIGIN Trial Investigators n-3 fatty acids and cardiovascular outcomes in patients with dysglycemia. N Engl J Med 2012;367:309–318 [DOI] [PubMed] [Google Scholar]
Associated Data
This section collects any data citations, data availability statements, or supplementary materials included in this article.