Abstract
Acetaminophen (APAP) is a widely used analgesic and antipyretic drug that undergoes extensive phase I and II metabolism. To better understand the kinetics of this process and to characterize the dynamic changes in metabolism and pharmacokinetics (PK) between children and adults, we developed a physiologically based PK (PBPK) model for APAP integrating in silico, in vitro, and in vivo PK data into a single model. The model was developed and qualified for adults and subsequently expanded for application in children by accounting for maturational changes from birth. Once developed and qualified, it was able to predict clinical PK data in neonates (0–28 days), infants (29 days to <2 years), children (2 to <12 years), and adolescents (12–17 years) following intravenous and orally administered APAP. This approach represents a general strategy for projecting drug exposure in children, in the absence of pediatric PK information, using previous drug- and system-specific information of adults and children through PBPK modeling.
Acetaminophen (APAP, Tylenol) is one of the most commonly used analgesic and antipyretic agents around the world.1 In the United States, >300 million bottles or packets of APAP or APAP-containing products in different formulations are used by adults and children as over-the-counter or as prescription medicines annually.2 In adults and adolescents (≥13 years old), the maximum recommended dose by the US Food and Drug Administration is 1,000 mg following single administration and 4,000 mg daily.3 In children (2–12 years), dose reduction is recommended based on patient's age or body weight to account for differences in metabolism between adults and children.4,5 Although APAP is generally considered safe and efficacious, drug-induced adverse events occur because of accidental or deliberate overdose, which can result in acute and serious liver failure. In some cases, even approved doses have resulted in liver damage, which were associated with both genetic and epigenetic factors.6,7 In the wake of concerns about APAP overdoses and toxicity, the US Food and Drug Administration announced new requirements for the prescription of APAP products, adding to their warnings about liver damage from over-the-counter APAP products in January 2011.8
Liver injury from APAP is closely linked to its pharmacokinetics (PK) which is influenced by metabolism via phase I (cytochrome P450 (CYP) 1A2, 2E1, 3A4, etc.) and phase II enzymes (sulfotransferases and UDP-glucuronosyltransferases (UGTs)) in the liver.4,6 Approximately 5–10% of APAP is metabolized by CYP enzymes to its toxic metabolite N-acetyl-p-benzoquinone imine (NAPQI).4,6 NAPQI is usually rapidly and efficiently detoxified to APAP-glutathione (APAP-GSH) conjugate, which is then further converted to 3′-[S-cysteinyl]-APAP, APAP mercapturate, 3′-[S-methyl]-APAP, and other inactive metabolites.4,6,9 However, once this detoxification process becomes saturated because of the following reasons: (i) induction or stabilization of CYP enzymes that form NAPQI, (ii) depletion of GSH conjugation pathway, or (iii) a combination of these two processes, NAPQI may accumulate and covalently bind to hepatic and renal tubular cell proteins and cause cell necrosis.4,6,10 Thus, simultaneous evaluation of a combination of metabolic enzyme pathways under different physiological and pathological conditions will help in elucidating potential bioactivation mechanisms related to APAP toxicity.
The enzymes involved in APAP metabolism undergo maturational changes from birth. For example, it has been reported that sulfation is the major conjugation pathway in children, whereas glucuronidation is the main pathway in adults.4,6,11 This is due to the fact that sulfation is generally considered mature at birth,4 whereas UGTs expression and activity undergo age-dependent changes. Recent in vitro enzyme kinetics studies with neonatal and pediatric liver microsomes showed that the metabolic capacity of UGT1A1, 1A9, and 1A6 reached adults levels at 3.8, 4, and 14 months postpartum, respectively,12,13 whereas that of UGT1A4 and UGT2B7 was not fully developed until the age of 18 years.14,15 The same holds true for the CYP isozymes, such as CYP1A2, CYP2E1, and CYP3A4, which also show variable ontogeny profiles.2,16 The expression of CYP2E1, in particular, is thought to be low in children <1 year of age.17 It should further be noted that the interindividual variability in the CYP enzymes–mediated NAPQI formation is not well understood, especially in children <2–3 years of age. A more mechanistic understanding of the underlying metabolic pathways, and the impact of maturational changes of the various disposition processes on APAP PK can enable more informed decisions on APAP dosing in patient subpopulations and predict the subgroups that may be the most susceptible to drug-induced liver injury.
Physiologically based PK (PBPK) models and simulations are very useful mechanistic tools to achieve these goals because they can be used to simultaneously evaluate multiple intrinsic and extrinsic factors that influence PK through a single, unifying model structure. PBPK models can be used to account for population subgroup differences in the PK and can distinguish between drug-specific and biological system–specific parameters.18 Drug-specific properties characterize the interaction between a given drug and the biological system, e.g., lipophilicity, target affinity to specific enzyme, transporter, or receptor activation, and are usually identical across different biological systems. System-specific parameters, on the other hand, describe the function of the underlying system (e.g., anatomy, physiology, and biochemistry) and usually vary between species (e.g., human vs. rats), individuals (e.g., age, genotype), and conditions (e.g., healthy subjects vs. patients).18,19 The ability of PBPK models to simultaneously account for age-dependent changes in various metabolic pathways makes them valuable dynamic tools to characterize and predict APAP metabolism and PK in children and to identify the subgroups that are at increased risk for liver toxicity by accounting for differences in system-specific properties between different patient populations using clinical trial simulations.
The objective of this study was to develop a PBPK model for APAP that uses available information on the underlying enzymatic pathways, particularly those involved in phase I and II metabolism, and their maturation to mechanistically understand APAP metabolism in children. The model was built using a step-wise approach. First, information on APAP's physicochemical properties was gathered from the literature. Second, elimination pathways were identified and quantified based on in vitro and human PK and pharmacogenetic (PGx) data from adults. Third, drug- and system-specific parameters obtained in steps 1 and 2 were integrated into a PBPK model for APAP in adults. Fourth, the developed model was externally qualified by comparing model-predicted plasma and urine metabolite PK profiles with reported independent literature PK data. Fifth, the PBPK model for adults was refined and modified for children by incorporating knowledge on growth and maturation processes from birth to adolescence (i.e., ontogenic factors). Finally, the pediatric PBPK model was externally qualified by comparing model-predicted APAP plasma PK and urinary metabolite profiles to corresponding literature profiles with respect to the child's age. The proposed step-wise approach above serves as a conceptual framework and workflow process for demonstrating the applications of PBPK models for predicting PK and bridging adult data to pediatric patients using available in silico, in vitro, and in vivo information from different sources.
Results
Prediction of adult APAP PK and metabolism
The developed PBPK model provides a consistent representation of the APAP dose–exposure relationship in adults following administration of different intravenous (i.v.) and oral formulations (Figure 1) using drug-specific parameters derived from literature and the absorption, distribution, metabolism, and excretion (ADME) simulator (see Supplementary Table S1 online). It was also able to characterize the contribution of major elimination pathways with respect to urinary recovery of each metabolite following both 5 and 20 mg/kg i.v. infusion of APAP (see Supplementary Table S2 online). The developed model was qualified by comparing the similarity of model-based predictions to plasma PK properties from independent PK studies in healthy adult subjects following administrations of different i.v. and oral doses of APAP (Figure 2) as well as that in cirrhosis patients following oral administration of APAP tablet (see Supplementary Figure S2 online). Our simulation also showed that, compared with healthy control, APAP clearance in Gilbert's syndrome patients decreased from 4.65 ± 0.13 to 4.20 ± 0.12 ml/min/kg, which was consistent with reported literature values (4.70 ± 0.16 to 4.19 ± 0.34 ml/min/kg).20 Simulated urinary recovered APAP-glucuronide in subjects with 100, 50, and 0% of UGT2B15 activity were 42.8 ± 1.3, 37.8 ± 1.1, and 31.5 ± 1.0%, respectively, which are also similar to the observed values in UGT2B15 *1/*1 (40.2 ± 1.6%), *1/*2 (35.1 ± 1.1%), and *2/*2 (29.3 ± 1.5%) allele carriers.21
Figure 1.
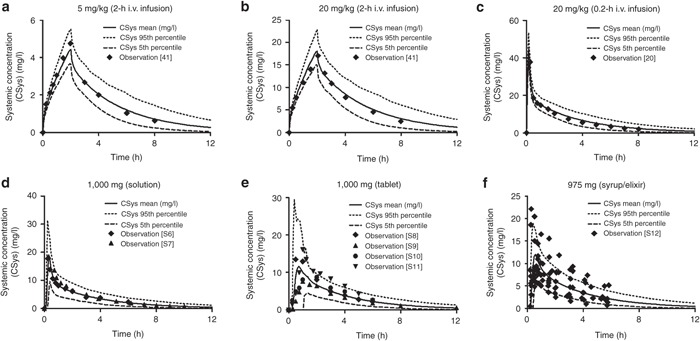
Observed vs. predicted acetaminophen plasma concentration profiles in adults included in model development following i.v. (a,b,c) and oral (d,e,f) doses of acetaminophen. Symbols represent individual or mean observed data digitized from different literature. The solid, dashed, and dotted lines represent the predicted mean and 5% or 95% confidence interval of the current physiologically based current pharmacokinetic model at respective doses in adults. Literature sources for (d,e,f) oral administration data are presented in Supplementary Material 2 online. i.v., intravenous.
Figure 2.
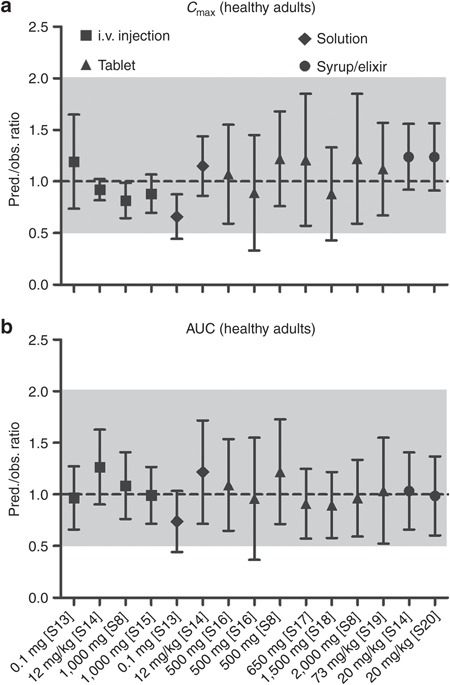
Qualification of physiologically based pharmacokinetic model performance in adults by comparing prediction (pred.)/observation (obs.) ratios of (a) mean peak plasma concentration (Cmax) and (b) mean area under the curve (AUC) following intravenous (i.v.) and oral administrations of acetaminophen from various clinical studies in healthy adults at respective doses. The dashed line represents line of identity (pred./obs. ratio = 1); the gray shade represents 0.5–2.0 ratio window. Literature sources are presented in Supplementary Material 2 online.
Prediction of APAP PK and metabolism in pediatric subjects
Once the APAP PBPK model developed for adults was modified to account for maturational changes of the biological system from birth, it was able to predict the plasma PK profiles of APAP in neonates (0–28 days), infants (29 days to <2 years), children (2 to <12 years), and adolescents (12–16 years) following i.v. infusion of 12.5, 15, or 20 mg/kg of APAP9,22 (Figure 3a–g). Our model also predicted APAP plasma PK in children receiving different dosing regimens (i.v. and oral doses) across the entire age range (0.02–17 years; Figure 3h,i). In addition, it reasonably predicted the impact of maturational changes in metabolite formation and elimination from birth, as reflected by changes in the urinary APAP-GSH/APAP-sulfate (APAP-S) ratio after single dose and APAP-glucuronide (APAP-G)/APAP-S ratio at steady state (Table 1).9 Sensitivity analysis showed that our choice of the UGT2B15 ontogeny parameter accurately reflected the maturation process of overall glucuronidation as other simulated enzyme parameters resulted either in a significant under- or overprediction of the APAP-G/APAP-S ratio upon visual inspection (see Supplementary Figure S1 online).
Figure 3.
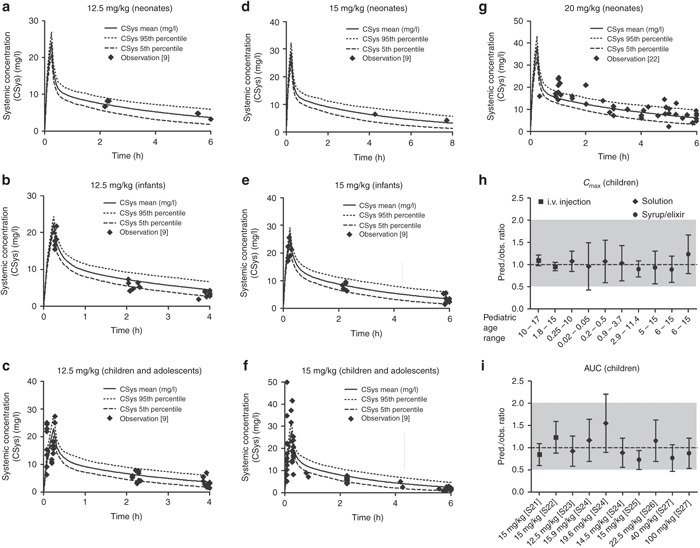
Observed vs. predicted plasma concentration profiles of acetaminophen (APAP) following (a,b,c) 12.5 mg/kg, (d,e,f) 15 mg/kg, or (g) 20 mg/kg of 15 min intravenous (i.v.) infusion of APAP in different pediatric age groups. Symbols represent individual observed data digitized from literature.9,22 The solid, dashed, and dotted lines represent the predicted mean and 5 or 95% confidence interval of the current physiologically based pharmacokinetic (PBPK) model at respective doses and age ranges. Additional qualification of PBPK model performance in children was conducted by comparing prediction (pred.)/observtation (obs.) ratios of (h) mean peak plasma concentration (Cmax) and (i) mean area under the curve (AUC) following i.v. and oral administrations of APAP from various clinical studies in pediatric subjects at respective doses and age ranges. The dashed line represents line of identity (pred./obs. ratio = 1); the gray shade represents 0.5–2.0 ratio window. Literature sources are presented in Supplementary Material 2 online.
Table 1. Comparison of the model-predicted and literature-reported9 APAP-G/APAP-S and APAP-GSH/APAP-S ratio values following 15 mg/kg 0.25-h i.v. infusion in different pediatric age groups.

Discussion
In recent years, the use of modeling and simulation approaches in pediatric drug development has been encouraged by regulatory authorities in light of the insufficient number of drugs available in children, high off-label use, and the need to improve pediatric study designs.23 Since 2012, the US Food and Drug Administration Safety and Innovation Act requires sponsors to submit a pediatric drug development plan to the regulatory agency at the end of their phase II program.24 The submission of a Pediatric Investigation Plan is required by the European Medicines Agency at the end of phase I clinical trial.25 Beside conventional pharmacometric methods, such as population PK (pop-PK)/pharmacodynamic modeling, PBPK modeling has recently gained increasing popularity in assessing PK and pharmacodynamics in various patient subgroups, making more informed decisions on drug dosing, supporting clinical trial design and regulatory submissions in children.26,27,28 In this study, we developed a PBPK model on the basis of in vitro and adult PK data that was able to predict APAP PK and metabolism both in adults and children across the entire pediatric age range (0–17 years) by accounting for physiological changes and enzyme ontogeny from birth to adulthood, further approving the potential of PBPK modeling in pediatric drug development.
Although there are currently no generally accepted criteria for validating/qualifying/verifying PBPK models, the results of visual prediction check revealed that our PBPK model successfully predicted APAP PK and metabolism in adults and all pediatric age groups. The observed APAP plasma PK profiles followed the mean trend of prediction nicely and >80% of observed data were within 90% confidence interval of PBPK model prediction (Figure 3). The prediction/observation ratio values of peak plasma concentration and area under the curve evenly distributed across the line of identity (ratio = 1); >80% prediction/observation ratio ± SD values were within 0.5–2.0 ratio window, a criterion usually applied to evaluate prediction of metabolic drug–drug interaction29 (Figures 2 and 3). The variability of model predictions (up to 44.9%) was similar to that of observations (up to 50.5%), which both contributed to the SD values of prediction/observation ratios. Moreover, the observed metabolic ratio values across the whole pediatric age ranges were all within 90% of the PBPK model prediction (Table 1).
PBPK model–predicted systemic clearance values were similar to those estimated from two independent clinical pediatric studies (study 1: 1 week to 16 years9, study 2: 37 weeks to 14 years30) using a conventional pop-PK approach (Figure 4). Some deviation of clearance values was observed between pop-PK and PBPK approaches at relative younger ages, which became less prominent as age increased. Such deviation can be explained by the fact that the pop-PK estimation tends to exhibit a trend toward the center/mean of the data, whereas the PBPK approach treats all information equally across the whole pediatric age range. In addition, pop-PK and PBPK modeling and simulation approaches typically use different scaling strategies when accounting for differences in the PKs between adults and children. Pop-PK approaches frequently use allometric scaling and a single fitted maturation function to account for age-dependent changes in systemic clearance. This approach requires a relatively large amount of pediatric PK data for model building and its predictive power is frequently limited to the age range based on which the model was established.19,30 PBPK models, on the other hand, integrate drug-specific and biological system–specific properties, as well as knowledge on the maturation of the biological system from birth into a single model structure. Once the drug-specific parameters have been determined and qualified in healthy adults, this model can be used to predict the drug's PK and metabolism in special populations, such as patients or children, by applying different system-specific properties.19,26,27,30,31
Figure 4.
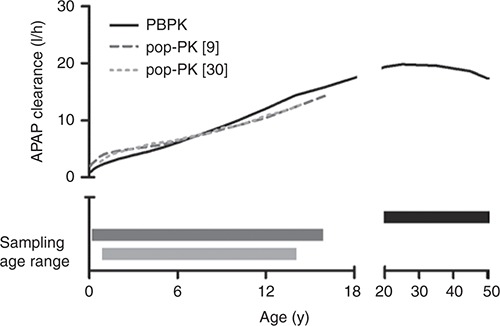
Comparison of the simulated systemic clearance values of acetaminophen (APAP) using the developed physiologically based pharmacokinetic (PBPK) model and two independent population pharmacokinetic (pop-PK) analyses in children of different age ranges. Black solid line represents the APAP clearance vs. age profile in children predicted from the current PBPK model, whereas the dark gray broken line and the light gray dashed line represent the clearance vs. age profiles estimated from the pop-PK models.9,30 The corresponding bars with respective colors represent the age ranges of APAP PK data used for the development of the APAP clearance vs. age curves with either the PBPK or pop-PK approach.
By incorporation of information on the major phase I and phase II enzymes involved in APAP metabolism as well as on the maturation of the biological system (e.g., body size, blood flow, enzyme), our PBPK model was able to characterize the impact of UGT and CYP enzyme ontogeny on major APAP metabolic and bioactivation pathways, as reflected in changes in APAP-G/APAP-S and APAP-GSH/APSP-S ratios from neonates to adolescents (Table 1). The simulated urinary recovery of APAP metabolites profiles by our PBPK model also showed that sulfation accounted for ~65% of total clearance in neonates and dropped quickly as age increases, whereas the contribution of glucuronidation and bioactivation reaches 90% of adult level at the age of 2 and 5 years, respectively (Figure 5). These findings suggest that the major APAP elimination and bioactivation pathways mature at different rates, which may impact APAP toxicity in an age-dependent manner as it represents the sum of both processes.
Figure 5.
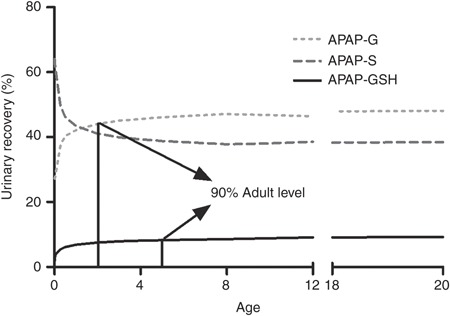
Simulated 24-h urinary recovery profiles of acetaminophen (APAP) metabolites in different pediatric age groups with the developed physiologically based pharmacokinetic (PBPK) model. Solid, broken, and dashed lines represent the changes of proportion of APAP-glutathione (APAP-GSH) (reflecting bioactivation), APAP-sulphate (APAP-S), and APAP-glucuronide (APAP-G), respectively, in the urine as age increases from newborns (0 years) to adults (18–20 years).
During the development of PBPK models, it is important to integrate knowledge from different sources when some prerequisite information is missing. In this study, because the absolute in vivo expression values of UGT isozymes is not available, the contribution of UGT1A1, UGT1A9, and UGT2B15 to the overall in vivo APAP glucuronidation was assigned as 30, 30, and 40%, respectively, based on the information from PGx studies and in vitro enzyme kinetics data20,21,32,33 (see Supplementary Material 1 online). The validity of the assigned ratio was confirmed by comparing model-based predictions with clinical observations with respect to the subject's genotype, which also accurately reflected the maturation of the glucuronidation pathway in children (see Supplementary Figure S1 online). When using the adult PBPK model for extrapolation to children, particularly to those very young ones, it is essential to understand the ontogeny of all major drug metabolizing enzymes that contribute to drug clearance.19 Since the ontogeny information of UGT2B15 is still unavailable, we predicted the possible maturation profile of UGT2B15 based on information from in vitro studies and historical in vivo data. Two early PK studies with neonates (1–3 days old full-term infants) revealed that following oral administration of a single dose of 10 or 12 mg/kg APAP syrup/elixir, urinary recovery of APAP-G/APAP-S ratio was approximately 0.25–0.35.11,34 The existence of APAP-G suggests that UGT isoform other than UGT1A1 and UGT1A9 (defined as having almost negligible activities in the neonates),12,13 namely UGT2B15, should have substantial activity at birth. This assumption is in line with recent literature findings, where, compared with UGT1A1 and UGT1A9 that had almost no expression, a considerable amount of UGT2B15 mRNA was found in the human fetal liver and the expression level of UGT2B15 mRNA was positively correlated with fetal age.35,36 These experimental data support the possibility of having an already relatively high expression of UGT2B15 in neonates, as compared with other UGT enzymes. Simulations showed that the UGT1A4 ontogeny profile (75% adult level at birth) sufficiently reflected UGT2B15 activity and was, hence, chosen as a surrogate in our model (Figure 3, Table 1, and Supplementary Figure S1 online).
This model may further be used to qualitatively and quantitatively describe the impact of various intrinsic and extrinsic factors on NAPQI generation, including PGx, maturation of metabolizing enzymes, smoking, drinking, and concurrent medications. Once expanded to account for GSH homeostasis, which governs the detoxification process of NAPQI in vivo,6 this PBPK model will be able to characterize and predict NAPQI dynamics and the associated risk for liver toxicity. Ultimately, the model may be applied to identify the subgroups of patients (e.g., age, alcohol intake) that are most susceptible to APAP-induced liver injury and to the selection of safe and efficacious APAP dosing regimens. It may also be used to explore safety concerns of other drugs that also cause GSH depletion, such as cisplatin37 and phenytoin.38
The PBPK model developed and qualified based on in vitro and adult clinical data may provide a priori prediction of the metabolism and PK behavior of a compound in children and suggest the “first-in-children” rationale. After qualification and refinement with metabolism and PK information from children, the pediatric PBPK model can be further utilized for designing pediatric clinical trials, optimizing pediatric dosing across age groups, and evaluating efficacy and safety of new drugs in pediatric patients. On the basis of our work and recent publications in literature,19,26,27,31 we propose a generally applicable conceptual framework for applying PBPK modeling and simulation approaches in guiding the design of pediatric clinical studies (Figure 6). This strategy may also be applied to other special populations.
Figure 6.
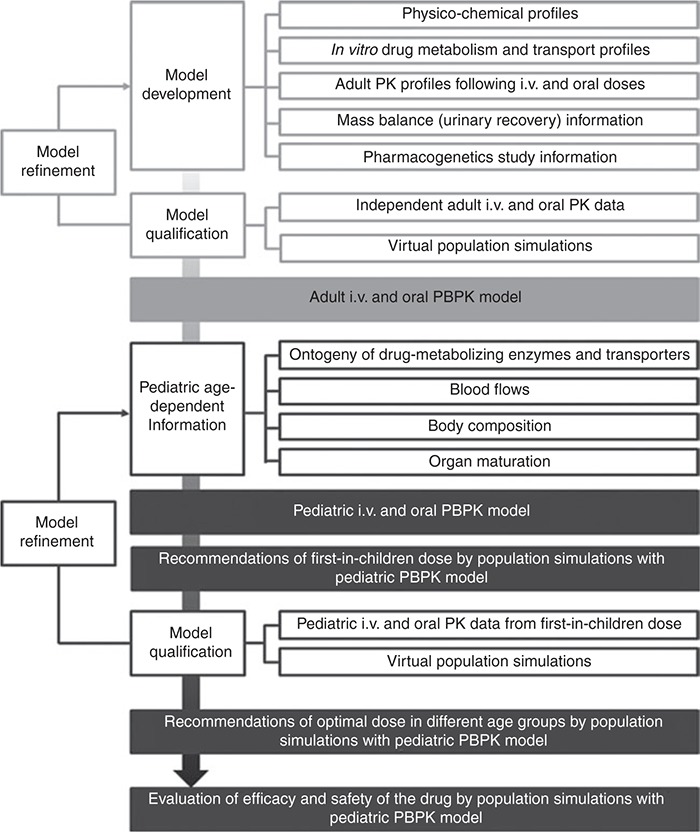
Proposed framework of applying physiologically based pharmacokinetic (PBPK) modeling and simulation in pediatric drug development from established in silico, in vitro, and in vivo information. i.v., intravenous; PK, pharmacokinetic.
In summary, this investigation represents a successful example of using PBPK modeling and simulation strategy to predict drug exposure in children for drugs with relatively complex PK and metabolic profiles. Our work underscores the importance of adequately establishing a PBPK model for mechanistic predictions of drug metabolism and PK in understudied populations, such as children, with most available in vitro and in vivo data and the up-to-date knowledge merging top-down (human PK and PGx data) and bottom-up (drug physicochemical properties, in vitro and in silico disposition data, as well as development and ontogeny information) approaches. This established PBPK model strategy can be applied as a supporting tool for pediatric drug development.
Methods
Development and qualification of APAP PBPK model in adults. The APAP PBPK model was developed and qualified in an ADME simulator (SimCYP V12.1; SimCYP Limited, Sheffield, UK). Drug-specific parameters characterizing the ADME of APAP (see Supplementary Table S1 online) were derived from published in silico, in vitro, and human PK data. The structural model was developed using a step-wise approach. APAP's molecular weight, pKa, logP, and unbound fraction (fu) were obtained from literature. Tissue-to-plasma partitioning coefficients (Kp) were calculated in silico using the equations developed by Poulin and Theil.39,40 Then, Kp scalar and human blood-to-plasma partition ratio values were simultaneously estimated using the parameter estimation (PE) function in the ADME simulator using the PK data. Total systemic clearance (CLAPAP) was estimated from i.v. infusion data in healthy Caucasian adults from different clinical PK studies.20,41 Hepatic (CLAPAP,H) and renal (CLAPAP,R) clearance was then estimated based on 24-h urinary recovery data following a 2-h i.v. infusion (5 mg/kg).41 It was assumed for our computations that the majority of administered drug was recovered in the urine42 and that the major metabolic pathways were within linear ranges because the achieved maximum plasma concentrations (~5 mg/l (33 µmol/l)41 were well below the reported Km values of the contributing metabolic enzymes.43,44,45 Unbound intrinsic hepatic clearance (CLu,int(APAP,H)) was first back-calculated from derived CLAPAP,H values with a retrograde calculator provided by the ADME simulator assuming linear PK and perfusion-limited clearance.46 This value was then fine-tuned by comparing model prediction with the observed plasma PK data following i.v. infusions.20,41 Apparent intrinsic clearances of each pathway (glucuronidation, sulfation, and NAPQI formation) were then calculated based on the percentage of each respective metabolites recovered in the urine.41 In cirrhosis patients (both CP-B and CP-C), the intrinsic clearance values of glucuronidation and sulfation were assigned as 100 and 70% of those in healthy subjects, respectively, based on information from a recent in vitro enzyme kinetics study with human liver microsomes from patients with nonalcoholic fatty liver disease/cirrhosis.47 The contribution of each specific UGT enzyme to the overall glucuronidation was derived from PGx studies with homozygous carriers of UGT wild-type alleles and subjects carrying different UGT mutations (Glibert's syndrome patients, who have 75% loss of UGT1A1 activity; and UGT2B15 *1/*2 or *2/*2 carriers, who have 50 and 100% loss of UGT2B15 activity, respectively) as well as data from in vitro enzyme kinetics studies20,21,32,33 (see Supplementary Material 1 online). The intrinsic formation clearance of NAPQI was derived from in vivo urinary recovery study with APAP cysteine and mercapturic acid conjugate data.41 Because the in vitro enzyme kinetic data used relative activity to express CYP-mediated NAPQI formation,44 both in vitro and in vivo values and systemic information was combined to convert this unit to the absolute amount of NAPQI. The unbound intrinsic clearance (CLu,int(enzyme)) of each CYP and UGT enzyme and the total intrinsic clearance of sulfotransferases were normalized to pmol enzyme (CYPs) or microsomal protein (UGTs and total sulfotransferases) levels by incorporating system-specific information including enzyme abundance, microsomal protein expression level, liver weight, intersystem extrapolation factor for scaling of recombinant CYP in vitro kinetic data,48 which are provided by the ADME simulator, and intrinsic clearance derived from in vivo study. The maximum velocity for each phase I and phase II pathway or enzymes (Vmax(enzyme)) was derived from the calculated CLu,int(enzyme) values using the following equation:
where the Michaelis–Menten constant (km(enzyme)) for each specific pathway or enzyme was directly obtained from in vitro enzyme kinetics experiments using baculovirus-insect cell-expressed microsomal proteins (CYP1A2, CYP2C9, CYP2C19, CYP2D6, CYP2E1, CYP3A4, UGT1A1, UGT1A9, and UGT2B15) or cultured cryopreserved human hepatocytes (total sulfotransferases).43,44,45 Although some UGT enzymes exhibited substrate inhibition in the in vitro enzyme kinetics study, this information was not included in our PBPK model as the lowest estimated Ki value (5.3 mM or 800 mg/l) was remarkably higher than the therapeutic concentration range.4,43,49
The PBPK base model developed with i.v. dose data was further expanded by incorporating the rate, extent, and time course of absorption following administration of oral solutions, tablets, and syrups/elixirs. The respective first-order absorption rate constant (Ka) and lag time (Tlag) values were simultaneously estimated for each individual formulation using the PE and automated sensitivity analysis functions of the ADME simulator. The base and full PBPK models were externally qualified with independent plasma PK data from different i.v. and oral dosing PK studies in healthy Caucasian adults, which was not used for model building. Additional qualification was performed by comparing simulated APAP concentration–time profiles with the ADME simulator preloaded cirrhosis patient virtual populations at different stages of cirrhosis to the observed values from literature (data sources are provided in Supplementary Material 2 online).
Prediction of pediatric APAP PK with developed APAP PBPK model. The developed PBPK model was used to simulate APAP concentration–time profiles in children with respective age ranges (0–17 years) using the pediatric module of the ADME simulator. This built-in module contains information on the ontogeny profiles of the different phase I and II enzymes involved in APAP metabolism from birth as well as changes in biological system, such as tissues volumes, blood flow, and organ size, over time. The ontogeny profile of UGT1A4 was used as a surrogate to represent that of UGT2B15. The rationale for this selection is provided in the discussion section. Additional sensitivity analysis was performed to explore the impact of ontogeny information on APAP metabolism in different pediatric age groups after the direct use of the model with assigning different UGT2B15 ontogeny profiles (see Supplementary Material 3 online). Simulation results were compared with APAP PK and metabolism profiles from PK studies (12.5, 15, or 20 mg/kg i.v. infusion) with pediatric subjects age ranged from neonates (0–28 days) to adolescents (12–16 years)9,22 as well as PK profiles of APAP from other literature findings with respective age ranges (data sources are provided in Supplementary Material 2 online).
Population simulations. All PK simulations were performed using 10 trials containing 10 subjects each. Mean and distribution of demographic covariates (e.g., age, sex, and body weight) as well as drug parameters were generated via a Monte-Carlo approach within the ADME simulator under predefined study designs from each respective PK study used for model simulation. Interindividual variability of the parameters was incorporated within the algorithm using the values predefined in the ADME simulator or were specified separately. Urinary recovery of APAP-GSH that reflects the NAPQI formation process was determined based on the assumption that the majority of NAPQI formed GSH conjugate subsequently converted to subsequent derivatives, such as 3′-[S-cysteinyl]-APAP, APAP mercapturate, and 3′-[S-methyl]-APAP, and were exclusively eliminated to the urine.9,41
Model qualification. For plasma PK profiles and urinary metabolite ratios, model qualification was performed by comparing population mean or individual values of the observations with the model predictions. Details are described in Supplementary Material 6 online.
Conflict of interest
The authors declared no conflict of interest.
Disclaimer
The views expressed in this article do not reflect the official policy of the FDA.
Author contributions
X.L.J, P.Z., J.S.B, L.J.L., and S.S. designed the study. X.L.J, P.Z., J.S.B, L.J.L., and S.S. wrote the manuscript. X.L.J. performed the research. X.L.J. analyzed the data.
Study Highlights
Acknowledgments
We acknowledge the partial funding of Xi-Ling Jiang by the US Food and Drug Administration (FDA) Critical Path Initiative Project “Investigation of the relative contribution of phase II drug metabolizing enzymes to acetaminophen clearance and their implications to the acetaminophen-induced liver toxicity in humans with the aid of physiologically based pharmacokinetic modeling.” The project was supported in part by an appointment to the Research Participation Program at the Center for Drug Evaluation and Research administered by the Oak Ridge Institute for Science and Education through an interagency agreement between the US Department of Energy and the FDA.
Supplementary Material
References
- Weil K., et al. Paracetamol for pain relief after surgical removal of lower wisdom teeth. Cochrane Database Syst. Rev. 2007. p. CD004487. [DOI] [PMC free article] [PubMed]
- Kearns G.L., Abdel-Rahman S.M., Alander S.W., Blowey D.L., Leeder J.S., Kauffman R.E. Developmental pharmacology–drug disposition, action, and therapy in infants and children. N. Engl. J. Med. 2003;349:1157–1167. doi: 10.1056/NEJMra035092. [DOI] [PubMed] [Google Scholar]
- Hines R.N. Developmental expression of drug metabolizing enzymes: impact on disposition in neonates and young children. Int. J. Pharm. 2013;452:3–7. doi: 10.1016/j.ijpharm.2012.05.079. [DOI] [PubMed] [Google Scholar]
- Ji P., et al. Regulatory review of acetaminophen clinical pharmacology in young pediatric patients. J. Pharm. Sci. 2012;101:4383–4389. doi: 10.1002/jps.23331. [DOI] [PubMed] [Google Scholar]
- Hopkins C.S., Underhill S., Booker P.D. Pharmacokinetics of paracetamol after cardiac surgery. Arch. Dis. Child. 1990;65:971–976. doi: 10.1136/adc.65.9.971. [DOI] [PMC free article] [PubMed] [Google Scholar]
- Zhao L., Pickering G. Paracetamol metabolism and related genetic differences. Drug Metab. Rev. 2011;43:41–52. doi: 10.3109/03602532.2010.527984. [DOI] [PubMed] [Google Scholar]
- Bárzaga Arencibia Z., Choonara I. Balancing the risks and benefits of the use of over-the-counter pain medications in children. Drug Saf. 2012;35:1119–1125. doi: 10.1007/BF03261998. [DOI] [PubMed] [Google Scholar]
- FDA. FDA Drug Safety Communication: Prescription Acetaminophen Products to be Limited to 325 mg Per Dosage Unit; Boxed Warning Will Highlight Potential for Severe Liver Failure. < http://www.fda.gov/Drugs/DrugSafety/ucm239821.htm#sa > ( 2011. Accessed 16 July 2013.
- Zuppa A.F., et al. Safety and population pharmacokinetic analysis of intravenous acetaminophen in neonates, infants, children, and adolescents with pain or Fever. J. Pediatr. Pharmacol. Ther. 2011;16:246–261. doi: 10.5863/1551-6776-16.4.246. [DOI] [PMC free article] [PubMed] [Google Scholar]
- Le Vaillant J., Pellerin L., Brouard J., Eckart P. [Acetaminophen (paracetamol) causing renal failure: report on 3 pediatric cases]. Arch. Pediatr. 2013;20:650–653. doi: 10.1016/j.arcped.2013.03.027. [DOI] [PubMed] [Google Scholar]
- Levy G., Khanna N.N., Soda D.M., Tsuzuki O., Stern L. Pharmacokinetics of acetaminophen in the human neonate: formation of acetaminophen glucuronide and sulfate in relation to plasma bilirubin concentration and D-glucaric acid excretion. Pediatrics. 1975;55:818–825. [PubMed] [Google Scholar]
- Miyagi S.J., Collier A.C. The development of UDP-glucuronosyltransferases 1A1 and 1A6 in the pediatric liver. Drug Metab. Dispos. 2011;39:912–919. doi: 10.1124/dmd.110.037192. [DOI] [PMC free article] [PubMed] [Google Scholar]
- Miyagi S.J., Milne A.M., Coughtrie M.W., Collier A.C. Neonatal development of hepatic UGT1A9: implications of pediatric pharmacokinetics. Drug Metab. Dispos. 2012;40:1321–1327. doi: 10.1124/dmd.111.043752. [DOI] [PMC free article] [PubMed] [Google Scholar]
- Miyagi S.J., Collier A.C. Pediatric development of glucuronidation: the ontogeny of hepatic UGT1A4. Drug Metab. Dispos. 2007;35:1587–1592. doi: 10.1124/dmd.107.015214. [DOI] [PubMed] [Google Scholar]
- Zaya M.J., Hines R.N., Stevens J.C. Epirubicin glucuronidation and UGT2B7 developmental expression. Drug Metab. Dispos. 2006;34:2097–2101. doi: 10.1124/dmd.106.011387. [DOI] [PubMed] [Google Scholar]
- Hines R.N. Ontogeny of human hepatic cytochromes P450. J. Biochem. Mol. Toxicol. 2007;21:169–175. doi: 10.1002/jbt.20179. [DOI] [PubMed] [Google Scholar]
- Johnsrud E.K., Koukouritaki S.B., Divakaran K., Brunengraber L.L., Hines R.N., McCarver D.G. Human hepatic CYP2E1 expression during development. J. Pharmacol. Exp. Ther. 2003;307:402–407. doi: 10.1124/jpet.102.053124. [DOI] [PubMed] [Google Scholar]
- Danhof M., de Jongh J., De Lange E.C., Della Pasqua O., Ploeger B.A., Voskuyl R.A. Mechanism-based pharmacokinetic-pharmacodynamic modeling: biophase distribution, receptor theory, and dynamical systems analysis. Annu. Rev. Pharmacol. Toxicol. 2007;47:357–400. doi: 10.1146/annurev.pharmtox.47.120505.105154. [DOI] [PubMed] [Google Scholar]
- Johnson T.N., Rostami-Hodjegan A. Resurgence in the use of physiologically based pharmacokinetic models in pediatric clinical pharmacology: parallel shift in incorporating the knowledge of biological elements and increased applicability to drug development and clinical practice. Paediatr. Anaesth. 2011;21:291–301. doi: 10.1111/j.1460-9592.2010.03323.x. [DOI] [PubMed] [Google Scholar]
- de Morais S.M., Uetrecht J.P., Wells P.G. Decreased glucuronidation and increased bioactivation of acetaminophen in Gilbert's syndrome. Gastroenterology. 1992;102:577–586. doi: 10.1016/0016-5085(92)90106-9. [DOI] [PubMed] [Google Scholar]
- Navarro S.L., et al. UGT1A6 and UGT2B15 polymorphisms and acetaminophen conjugation in response to a randomized, controlled diet of select fruits and vegetables. Drug Metab. Dispos. 2011;39:1650–1657. doi: 10.1124/dmd.111.039149. [DOI] [PMC free article] [PubMed] [Google Scholar]
- Allegaert K., Naulaers G., Vanhaesebrouck S., Anderson B.J. The paracetamol concentration-effect relation in neonates. Paediatr. Anaesth. 2013;23:45–50. doi: 10.1111/pan.12076. [DOI] [PubMed] [Google Scholar]
- Edginton A.N., Schmitt W., Willmann S. Development and evaluation of a generic physiologically based pharmacokinetic model for children. Clin. Pharmacokinet. 2006;45:1013–1034. doi: 10.2165/00003088-200645100-00005. [DOI] [PubMed] [Google Scholar]
- FDA FDA Safety and Innovation Act. < http://www.gpo.gov/fdsys/pkg/BILLS-112s3187enr/pdf/BILLS-112s3187enr.pdf > ( 2012. Accessed 16 July 2013.
- Zisowsky J., Krause A., Dingemanse J. Drug development for pediatric populations: regulatory aspects. Pharmaceutics. 2010;2:364–388. doi: 10.3390/pharmaceutics2040364. [DOI] [PMC free article] [PubMed] [Google Scholar]
- Leong R., et al. Regulatory experience with physiologically based pharmacokinetic modeling for pediatric drug trials. Clin. Pharmacol. Ther. 2012;91:926–931. doi: 10.1038/clpt.2012.19. [DOI] [PubMed] [Google Scholar]
- Barrett J.S., Della Casa Alberighi O., Läer S., Meibohm B. Physiologically based pharmacokinetic (PBPK) modeling in children. Clin. Pharmacol. Ther. 2012;92:40–49. doi: 10.1038/clpt.2012.64. [DOI] [PubMed] [Google Scholar]
- Abdel-Rahman S.M., Amidon G.L., Kaul A., Lukacova V., Vinks A.A., Knipp G.T. Members of the BCS Task Force Summary of the National Institute of Child Health and Human Development-best pharmaceuticals for Children Act Pediatric Formulation Initiatives Workshop-Pediatric Biopharmaceutics Classification System Working Group. Clin. Ther. 2012;34:S11–S24. doi: 10.1016/j.clinthera.2012.09.014. [DOI] [PMC free article] [PubMed] [Google Scholar]
- Einolf H.J. Comparison of different approaches to predict metabolic drug-drug interactions. Xenobiotica. 2007;37:1257–1294. doi: 10.1080/00498250701620700. [DOI] [PubMed] [Google Scholar]
- Strougo A., Eissing T., Yassen A., Willmann S., Danhof M., Freijer J. First dose in children: physiological insights into pharmacokinetic scaling approaches and their implications in paediatric drug development. J. Pharmacokinet. Pharmacodyn. 2012;39:195–203. doi: 10.1007/s10928-012-9241-9. [DOI] [PMC free article] [PubMed] [Google Scholar]
- Edginton A.N. Knowledge-driven approaches for the guidance of first-in-children dosing. Paediatr. Anaesth. 2011;21:206–213. doi: 10.1111/j.1460-9592.2010.03473.x. [DOI] [PubMed] [Google Scholar]
- Court M.H., et al. Interindividual variability in acetaminophen glucuronidation by human liver microsomes: identification of relevant acetaminophen UDP-glucuronosyltransferase isoforms. J. Pharmacol. Exp. Ther. 2001;299:998–1006. [PubMed] [Google Scholar]
- Miners J.O., Bowalgaha K., Elliot D.J., Baranczewski P., Knights K.M. Characterization of niflumic acid as a selective inhibitor of human liver microsomal UDP-glucuronosyltransferase 1A9: application to the reaction phenotyping of acetaminophen glucuronidation. Drug Metab. Dispos. 2011;39:644–652. doi: 10.1124/dmd.110.037036. [DOI] [PubMed] [Google Scholar]
- Miller R.P., Roberts R.J., Fischer L.J. Acetaminophen elimination kinetics in neonates, children, and adults. Clin. Pharmacol. Ther. 1976;19:284–294. doi: 10.1002/cpt1976193284. [DOI] [PubMed] [Google Scholar]
- Court M.H., Zhang X., Ding X., Yee K.K., Hesse L.M., Finel M. Quantitative distribution of mRNAs encoding the 19 human UDP-glucuronosyltransferase enzymes in 26 adult and 3 fetal tissues. Xenobiotica. 2012;42:266–277. doi: 10.3109/00498254.2011.618954. [DOI] [PubMed] [Google Scholar]
- Ekström L., Johansson M., Rane A. Tissue distribution and relative gene expression of UDP-glucuronosyltransferases (2B7, 2B15, 2B17) in the human fetus. Drug Metab. Dispos. 2013;41:291–295. doi: 10.1124/dmd.112.049197. [DOI] [PubMed] [Google Scholar]
- Zunino F., Pratesi G., Micheloni A., Cavalletti E., Sala F., Tofanetti O. Protective effect of reduced glutathione against cisplatin-induced renal and systemic toxicity and its influence on the therapeutic activity of the antitumor drug. Chem. Biol. Interact. 1989;70:89–101. doi: 10.1016/0009-2797(89)90065-3. [DOI] [PubMed] [Google Scholar]
- Gallagher E.P., Sheehy K.M. Effects of phenytoin on glutathione status and oxidative stress biomarker gene mRNA levels in cultured precision human liver slices. Toxicol. Sci. 2001;59:118–126. doi: 10.1093/toxsci/59.1.118. [DOI] [PubMed] [Google Scholar]
- Poulin P., Theil F.P. Prediction of pharmacokinetics prior to in vivo studies. 1. Mechanism-based prediction of volume of distribution. J. Pharm. Sci. 2002;91:129–156. doi: 10.1002/jps.10005. [DOI] [PubMed] [Google Scholar]
- Berezhkovskiy L.M. Volume of distribution at steady state for a linear pharmacokinetic system with peripheral elimination. J. Pharm. Sci. 2004;93:1628–1640. doi: 10.1002/jps.20073. [DOI] [PubMed] [Google Scholar]
- Clements J.A., Critchley J.A., Prescott L.F. The role of sulphate conjugation in the metabolism and disposition of oral and intravenous paracetamol in man. Br. J. Clin. Pharmacol. 1984;18:481–485. doi: 10.1111/j.1365-2125.1984.tb02495.x. [DOI] [PMC free article] [PubMed] [Google Scholar]
- Prescott L.F. Kinetics and metabolism of paracetamol and phenacetin. Br. J. Clin. Pharmacol. 1980;10 suppl. 2:S291––S298. doi: 10.1111/j.1365-2125.1980.tb01812.x. [DOI] [PMC free article] [PubMed] [Google Scholar]
- Mutlib A.E., Goosen T.C., Bauman J.N., Williams J.A., Kulkarni S., Kostrubsky S. Kinetics of acetaminophen glucuronidation by UDP-glucuronosyltransferases 1A1, 1A6, 1A9 and 2B15. Potential implications in acetaminophen-induced hepatotoxicity. Chem. Res. Toxicol. 2006;19:701–709. doi: 10.1021/tx050317i. [DOI] [PubMed] [Google Scholar]
- Laine J.E., Auriola S., Pasanen M., Juvonen R.O. Acetaminophen bioactivation by human cytochrome P450 enzymes and animal microsomes. Xenobiotica. 2009;39:11–21. doi: 10.1080/00498250802512830. [DOI] [PubMed] [Google Scholar]
- Riches Z., Bloomer J., Patel A., Nolan A., Coughtrie M. Assessment of cryopreserved human hepatocytes as a model system to investigate sulfation and glucuronidation and to evaluate inhibitors of drug conjugation. Xenobiotica. 2009;39:374–381. doi: 10.1080/00498250902763440. [DOI] [PubMed] [Google Scholar]
- Vieira M.L., et al. Predicting drug interaction potential with a physiologically based pharmacokinetic model: a case study of telithromycin, a time-dependent CYP3A inhibitor. Clin. Pharmacol. Ther. 2012;91:700–708. doi: 10.1038/clpt.2011.305. [DOI] [PubMed] [Google Scholar]
- Hardwick R.N., et al. Altered UDP-glucuronosyltransferase and sulfotransferase expression and function during progressive stages of human nonalcoholic fatty liver disease. Drug Metab. Dispos. 2013;41:554–561. doi: 10.1124/dmd.112.048439. [DOI] [PMC free article] [PubMed] [Google Scholar]
- Crewe H.K., Barter Z.E., Yeo K.R., Rostami-Hodjegan A. Are there differences in the catalytic activity per unit enzyme of recombinantly expressed and human liver microsomal cytochrome P450 2C9? A systematic investigation into inter-system extrapolation factors. Biopharm. Drug Dispos. 2011;32:303–318. doi: 10.1002/bdd.760. [DOI] [PubMed] [Google Scholar]
- Tan C., Graudins A. Comparative pharmacokinetics of Panadol Extend and immediate-release paracetamol in a simulated overdose model. Emerg. Med. Australas. 2006;18:398–403. doi: 10.1111/j.1742-6723.2006.00873.x. [DOI] [PubMed] [Google Scholar]
Associated Data
This section collects any data citations, data availability statements, or supplementary materials included in this article.


