

Abstract
Restricting energy expenditure is an adaptive response to food shortage. Despite being insulated with massive amount of fat tissues, leptin-deficient mice lose the ability to maintain their body temperature and develop deep hypothermia, which can be suppressed by exogenous leptin, suggesting an important role for leptin in energy expenditure regulation. However, the mechanism underlying the leptin action is not clear. We generated mice with disruption of glutamate release from leptin receptor-expressing neurons by deleting vesicular glutamate transporter 2 in these neurons, and found that these mice developed mild obesity purely due to reduced energy expenditure, exhibited bouts of rapidly reduced energy expenditure, body temperature and locomotion. In addition, these mice exhibited lower energy expenditure and body temperature in response to fasting and were defective in leptin-mediated thermogenic action in brown adipose tissues. Taken together, our results identify a role for glutamate release in mediating leptin action on energy expenditure.
Keywords: Glutamate, Leptin, Energy expenditure, Hypothermia, Obesity
1. Introduction
Homeothermic animals are capable of adjusting thermogenesis to maintain a constant body temperature, which ensures that bodily system functions most efficiently [1]. However, when facing adverse environments such as fasting, these animals reduce energy expenditure (EE) and develop forms of hypothermia, for example, torpor, to reserve energy for survival [2]. Torpor is an adaptive response to fasting and cold, characteristic with bouts of rapidly reduced EE, body temperature and locomotion to save energy. Since torpor is a controlled process animals can recover from torpor without noticeable defects [3]. Previous studies have implicated a role for NPY in the brain, fibroblast growth factor (FGF) 21 from liver and ghrelin from gut in the regulation of EE and hypothermia [3–4]. However, the neural pathway underlying hypothermia and torpor regulation is not yet clear.
The role of leptin in body weight regulation has been well established. Part of the mechanism underlying obesity is reduced EE as a result of diminished thermogenic activity due to defective leptin action [5–6]. Leptin deficient mice show lower body temperature [7]. Conversely, leptin action in the hypothalamus increases body temperature through the sympathetic nervous input to the brown adipose tissue (BAT), the major thermogenic organ in rodents [8–9]. Consistent with the role of leptin in body temperature regulation and thermogenesis, mice with leptin-deficiency, although being insulated by large amounts of fat tissues, cannot defend their body temperature, develop hypothermia and enter torpor in response to fasting [10]. Importantly, administration of exogenous leptin prevents the entry of torpor in these mice [10], suggesting a critical role for leptin in torpor-related EE regulation. However, the neural pathway underlying leptin action in torpor-related EE regulation is not clear.
Leptin action is primarily mediated by isoform B leptin receptor (LepR) in the brain [11]. LepR-expressing neurons (LepR neurons) reside predominantly in the hypothalamus, but also in other brain regions including the brainstem nuclei. Within the hypothalamus, LepRs are abundant in the arcuate nucleus, ventromedial hypothalamus (VMN), dorsomedial hypothalamus (DMH), ventral premammillary (PMv), preoptic area (POA) and lateral hypothalamus [12,13]. Despite intensive research on LepRs in these discrete brain sites, the relative contribution of LepRs in these sites on body weight regulation is not clear, suggesting the complexity of leptin neural pathway. To reduce the level of complexity, Vong et al. used a novel approach by divining LepR neurons into broadly glutamatergic and GABAergic groups, and found that LepRs in GABAergic neurons mediate a major part of leptin action on body weight regulation while those in glutamatergic neurons mediate a small part [14]. We previously showed that GABA release from LepR neurons is required for both normal food intake and energy expenditure [15]. However, it remains untested whether glutamate release from LepR neurons mediates leptin action on energy balance regulation.
2. Materials and methods
2.1. Materials
Leptin was purchased from Dr. Parlow from NHPP.
2.2. Animals
Generation of LepR-iCre mice, Ai9 mice and Vglut2flox/flox mice was described previously [16–18]. Study subjects were generated by mating LepR-iCre:Vglut2flox/flox mice with Vglut2flox/flox mice. Vglut2-Ires-Cre mice [14] , generously provided by Dr. Bradford Lowell, were crossed with Z/EG reporter mouse to visualize glutamatergic neurons. All animals and procedures were approved by the Animal Welfare Committee of the University of Texas Health Science Center at Houston or Pennington Biomedical Research Center. Mice were housed at 22–24 °C with a 14 h light/10 h dark cycle with standard mouse chow (Teklad F6 Rodent Diet 8664, 4.05 kcal/g, 3.3 kcal/g metabolizable energy, 12.5% kcal from fat, Harlan Teklad, Madison, WI) and water provided ad libitum.
2.3. Body weight studies
Weekly body weight was monitored in controls and LepR-iCre:Vglut2flox/flox mice fed standard mouse chow (Teklad F6 Rodent Diet 8664, Harlan Teklad, Madison, WI) from 4 to 20 weeks of age and on the high-fat diet study (HFD, D12331 from Research Diets, NJ) from 6 weeks of age and maintained on HFD for 20 weeks. Body composition was measured at indicated times using an Echo-MRI machine (Echo MRI, Houston, Texas).
2.4. Energy expenditure and food intake measurements
Energy expenditure was measured by oxygen consumption using indirect calorimetry. Individual housed mice maintained on chow diet at 7–8 weeks old were placed at room temperature (22–24 °C) in chambers of a Comprehensive Lab Animal Monitoring System (CLAMS, Columbus Instruments, Columbus, OH). Daily food intake was measured for 6 days for mice, which have been individually housed for at least 1 week on either chow diet or high fat diet. Accumulated food intake was calculated based one first 3 days measured for food intake.
2.5. Immunohistochemistry (IHC) and in situ hybridization (ISH) studies
The digoxigenin-labeled cRNA probes were generated against Vglut2 mRNA, and ISH was performed as we previously described [15]. Briefly, free-floating brain sections were rinsed with diethylpyrocarbonate(DEPC)-treated PBS, pH 7.0, for 30 min before being fixed with 4% paraformaldehyde (Sigma, St. Louis, MO) in DEPC-PBS for 30 min. Tissues were then incubated with 3% H2O2 and then treated with proteinase K (2 μg/ml; Roche Applied Bioscience, Indianapolis, IN). After the fixation again in 4% paraformaldehyde, the sections were treated for 10 min in 0.1 M triethanolamine-HCl, pH 8.0. Then cRNA probes diluted in hybridization buffer (500 ng/ml) were applied to the tissues for overnight at 60 °C. Following rinsed with 0.3% Triton X-100, 0.15 M NaCl, 100 mM Tris–HCl, pH 7.5 (TNT buffer) for 10 min and blocked with 5% normal sheep serum in TNT buffer for 1 h, tissues were incubated with anti-digoxigenin antibody (1:200, Fab fragment; Roche Applied Bioscience) conjugated with horseradish peroxidase overnight at 4 °C. Probes were visualized with tyramide signal amplification kit (PerkinElmer, Inc., Wellesley, MA) after three thorough washes in TNT buffer. Sections were photographed with a TCS SP5 confocal microscope (Leica, Nussloch, Germany). To qualify cell numbers, in each mouse (n=3), three brain sections for ventromedial hypothalamus (VMH), and two sections for dorsomedial hypothalamus (DMH) and ventral premammillary (PMv) at the same rostrocaudal levels were chosen. All immunoreactive cells with clear profile were counted, and the numbers from all animals were summed and then averaged as the number per section.
For p-STAT3 (signal transducer and activator of transcription 3) and c-fos detection, animals (9–10 weeks old males) received daily handling and injections of saline for 1 week to reduced stress levels. On the testing day, for p-STAT3 experiment, single dose of leptin (2 μg/g body weight) were i.p. injected at 9 am after 24 h fasting and mice were perfused 45 min later; for c-fos experiments, animals were perfused 2 h post leptin (5 μg/g body weight) or saline injection. After fixation, brains were sliced into sections and immunostained. Phosphor-specific-(Tyr705) STAT3 rabbit antiserum (1:1000; Cell Signaling Technology, Danvers, MA) and rabbit anti-c-fos (Ab-5, 1:1000; Millipore, Billerica, MA) were used and followed by Alexa fluor 488 conjugated donkey antirabbit IgG (1:100; Invitrogen, Carlsbad, CA). Sections were taken with the TCS SP5 confocal microscope. To quantify cell numbers, in each mouse (n=5–7), three sections for paraventricular hypothalamus (PVH), DMH, and preoptic area (POA) at corresponding rostrocaudal levels were chosen. All immunoreactive cells with clear profile were counted, and the numbers from all animals were summed and then averaged as the number per section.
2.6. Quantitative PCR assay
RNA was extracted from hypothalamic, liver and brown adipose tissues, micro-punched from mice, using the Trizol Reagent (Invitrogen), and was reverse transcribed with RETROscript (Ambion) and amplified using SYBR green technology (Bio-Rad, Hercules, CA). The primers for real time PCR are as follows: POMC, 5′-AGAACGCCATCATCAAGAAC-3′ and 5′-AAGAGGCTAGAGGTCATCAG-3′; NPY, 5′-GTGGATCTCTTCTCTCACAGAGG-3′ and 5′-GCCCAAACACACGAGCAGAG-3′; FGF-21, 5′-CTCTAGGTTTCTTTGCCAACAG-3′ and 5′-AAGCTGCAGGCCTCAGGAT-3′; UCP-1; 5′-TGGAGGTGTGGCAGTGTTCA-3′ and 5′-GCTCTGGGCTTGCATTCTG-3′. Assays were linear over five orders of magnitude.
2.7. Body temperature and movement measurement
As previously reported [8], precalibrated sensitive transmitters (PDT-4000 G2 E-Mitter sensors, Respironics Inc. Murrysville, PA, USA) were used for performing telemetric measurements. For measuring interscapular BAT temperature and locomotor activity, mice were anesthetized with ketamine/xylazine and then implanted E-Mitters underneath the iBAT pad between the scapulae. For core body temperature monitoring, E-Mitters were placed into the peritoneal cavity. Mice were allowed for 1 week recovery before all data were collected. Signals emitted by the E-Mitter transponders were sensed by a receiver positioned underneath the animal's housing cage and analyzed using VitalView software (Respironics Inc.). Locomotor activity counts are recorded as gross motor activity. For all experiments, activity counts and temperature measurements were taken every 1 min. All mice were acclimated for at least 3 days and then data were collected for 24 h. Multiple series of data at the same collected time point and from the same genotype mice were summed and then averaged to get their mean temperature and movement.
2.8. Glucose homeostasis studies
Fed blood glucose levels were measured between 9 am and 10 am and fasted blood glucose levels were obtained 24 h after removing food at 9 am on the previous day. For glucose tolerance test study, individually housed animals with overnight fasting were administrated with i.p. glucose (1.5 g/kg), and glucose levels were measured at time (minutes) 0, 15, 30, 60 and 90 after glucose administration. Similarly, for insulin tolerance test, individually housed animals with 4-hour fasting were administrated with i.p. insulin (1 U/kg), and glucose levels were measured at time (minutes) 0, 15, 30, 60 and 90 after insulin administration. Glucose was measured from tail vein using a glucose meter (Roche Diagnostics Corp.)
2.9. Statistical analyses
Data sets were presented at mean±SEM and analyzed for statistical significance using PRISM (GraphPad, San Diego, CA) for two-tailed unpaired Student's t-tests, or for ANOVA tests using Tukey's multiple comparison test. A P-value of <0.05 was required for significance.
3. Results and discussion
To identify LepR-expressing neurons, we p-STAT3 as a surrogate for LepR neurons since p-STAT3 is only accumulated in LepR neurons in the hypothalamus in response to leptin [19]. To identify Vglut2-expressing glutamatergic neurons, we used a previously established Vglut2-iCre mice [14] and cross them with Cre reporter Z/EG mice, and in the resulting Vglut2-iCre:Z/EG mice, GFP will recapitulate Vglut2 expression. In response to acute bolus leptin injections, numerous number of hypothalamus neurons contained p-STAT3 (Supplemental Figure. S1), similar to the pattern of LepR expression. Consistent with the previous data that VMH neurons are mainly glutamatergic [20], the majority of LepR neurons in the VMH were immunoreactive to GFP antibody. We also found that the majority of LepR neurons in the PMv, a significant number of LepR neurons in the DMH (Supplementary Figure. S1), and but relatively small number of neurons in the PVH and the hindbrain, expressed GFP (data not shown). Given the fact that p-STAT3 may not be induced in all LepR neurons in response to leptin, these results may underestimate the number of glutamatergic LepR neurons in the hypothalamus. Nonetheless, these results suggest that the majority of neurons in the PMV, a significant number of LepR neurons in the DMH, and relatively small number of LepR neurons in the PVH and the hindbrain, are both LepR positive and glutamatergic.
We crossed LepR-iCre mice with Vglut2flox/flox mice to generate LepR-iCre:Vglut2flox/flox mice (hereafter named CKO). In control Vglut2flox/flox mice (hereafter named CON), strong Vglut2 expression was found in the VMH and DMH (Figure. 1A), and the PMv (Figure. 1C). In CKO mice, Vglut2 signal was significantly reduced in the VMH and DMH (Figure. 1B), and PMv (Figure. 1D). Cell counting results revealed that, compared to CON mice, the number of Vglut2 positive neurons was reduced by two thirds in the VMH (Figure. 1E), one fifth in the DHM (Figure. 1F) and nearly half in the PMv (Figure. 1G). These results are consistent with LepR-iCre expression profile [15], suggesting effective deletion of Vglut2 by LepR-iCre. Consistent with the notion of small number of glutamatergic LepR neurons in the PVH and the hindbrain, Vglut2 signal appeared to be unchanged in the PVH and the hindbrain (Supplemental Fig. S2), suggesting specificity of LepR-iCre mediated deletion of Vglut2. Thus, we have achieved effective deletion of Vglut2 in LepR neurons in the hypothalamus.
Figure.1.
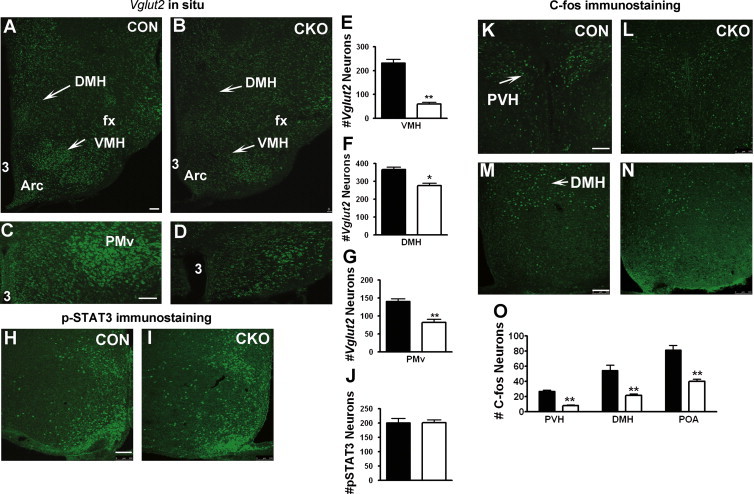
Generation of mice with disruption of glutamate release from LepR-expressing neurons. (A–G) In situ hybridization for Vglut2 in the hypothalamus of Vglut2flox/flox (CON) and LepR-iCre:Vglut2flox/flox mice (CKO). Vglut2 expression signal was shown in the DMH and VMH of CON (A) and CKO (B) mice, and in the PMv of CON (C) and CKO (D) mice. (E–G) Statistical comparison in the number of Vglut2 positive neurons between CON and CKO mice for the VMH (E), DMH (F) and PMv (G). (H–J) p-STAT3 expression in the hypothalamus after leptin injection of CON (H) and CKO (I) mice. (J) Statistical comparison of p-STAT3 positive neurons between CON and CKO mice. (K–O) C-fos expression in the hypothalamus after leptin injection in the PVH of CON (K) and CKO mice (L), and in the DMH of CON(M) and CKO (N) mice. (O) Statistical comparison in the number of C-fos expressing neurons in the PVH, DHM and POA between CON and CKO mice. Scale bar=100 μM. ⁎P<0.05; ⁎⁎P<0.01. n=5–7; DMH: dorsal medial hypothalamus; VMH: ventromedial hypothalamus; PMv: premammillary nucleus, ventral part; PVH: paraventricular hypothalamus; fx: fornix.
Leptin produced robust p-STAT3 accumulation in the hypothalamus in both CON (Figure. 1H) and CKO mice (Figure. 1I), and cell counting results showed that both genotypes exhibited equal number of p-STAT3 positive neurons in response to leptin (Figure. 1J), suggesting no major alterations by Vglut2 deletion in LepR neuron function in response to leptin. In the hypothalamus, leptin produces robust C-fos expression [21], part of which might be located in second-order neurons that receive synaptic inputs from first-order glutamatergic LepR neurons. Since glutamate normally excites neurons accompanied with increased C-fos expression, we examined C-fos expression pattern in CKO mice. Saline produced negligible C-fos response in both genotypes (data not shown). In CON mice, leptin administration produced numerous C-fos positive neurons in the PVH (Figure. 1K) and DMH (Figure. 1M). However, in CKO mice, less C-fos response was produced in the PVH (Figure. 1L) and DMH (Figure. 1N). Cell counting confirmed significant reduction in the number of C-fos positive neurons in CKO mice (Figure. 1O). The reduction is not due to cell autonomous effects from Vglut2 deletion because (1) leptin action in neurons with Vglut2 deletion is normal (Figure. 1J) and (2) LepR-iCre expression in the PVH is minimal and so is Vglut2 deletion (Supplemental Figure. S1). Thus, reduced C-fos expression is consistent with loss of glutamate release from LepR neurons. These results indicate that a significant part of C-fos response in the DMH and PVH to leptin is due to the activation of second-order neurons by glutamate release from LepR neurons.
Compared to CON group, body weight of CKO mice on chow diet is higher in both males (Figure. 2A) and females (Figure. 2B). The higher body weight is solely due to increased fat mass in males (Figure. 2C) and females (Supplemental Figure. S3A), suggesting an obese phenotype. The degree of obesity in CKO mice is comparable to that in mice with specific LepR deletion in glutamatergic neurons [14], suggesting that the function of LepRs in glutamatergic neurons is predominantly mediated by glutamate release. Hypothalamic neuropeptide expression analyzed by Q-PCR showed that there was no significant difference in the expression of POMC, NPY, AgRP and TRH between CON and CKO (Supplemental Fig. S3B). While consuming the same amount of food (Figure. 2D), CKO male mice exhibited reduced EE when the O2 consumption data were analyzed based either on body weight (Figure. 2E), or on lean mass or individual animal (Supplemental Figure. S3C–F). The reduction was more pronounced during the dark cycle (Figure. 2F). Strikingly, CKO mice exhibited repeatable, rapid reduction of EE (arrows in Figure. 2E). Consistently, these mice exhibited rapid reduction of core body temperature (Tc) at a similar time point of reduced EE (arrow in Figure. 2G). Despite an overall increased locomotion in CKO mice during the dark cycle (Figure. 2H), their locomotion was dramatically reduced, again at a similar time point of reduced EE (arrow in Figure. 1I). The phenotype of repeatable, rapidly reduced EE, body temperature and locomotion, all occurring at a similar time point, is reminiscent of torpor [3]. Notably, this torpor like behavior occurs spontaneously at room temperature on regular chow diet whereas torpor normally occurs in response to fasting/cold in mice [3]. These results may indicate that glutamate release from LepR neurons constitutes part of neurocircuits that promote EE and therefore prevent torpor. When fed high fat diet, CKO mice developed a similar degree of obesity to that on chow diet, which is associated with slightly, although not significantly, reduced EE (Supplemental Fig. S4). CKO mice showed no defects in either glucose or insulin tolerance (Supplemental Fig. S5). These results suggest that glutamate release from LepR neurons is not required for response to high-fat diet feeding or for glucose homeostasis.
Figure. 2.
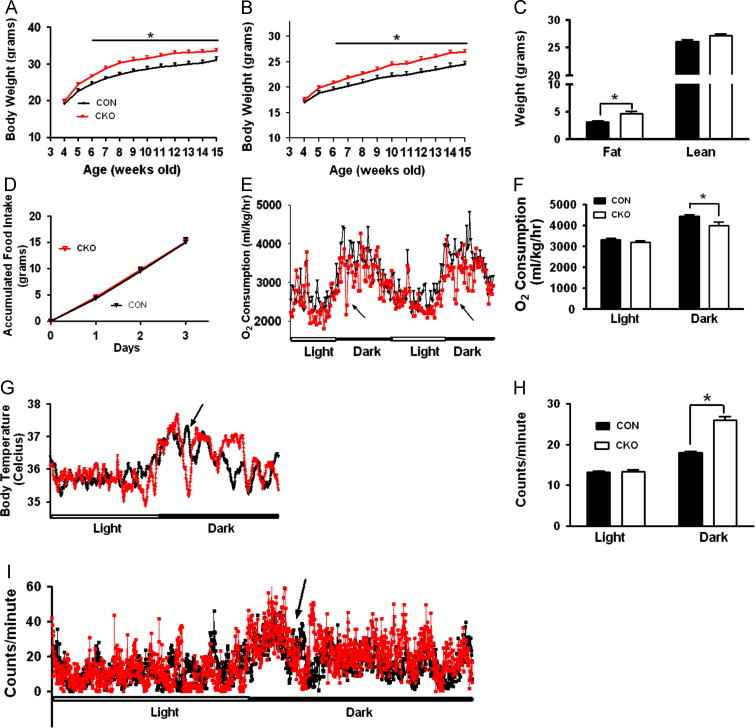
Disruption of glutamate release from LepR-expressing neurons leads to obesity and torpor like behavior. (A, B) Weekly body weight of CON and CKO mice measured from 4 weeks of age until 15 weeks of age in males (A, n=14–16) and females (B, n=11–14). (C) Body composition of males measured at 15 weeks of age. (D) Accumulative food intake measured in males during 5–6 weeks of age when there was no difference in body weight between genotypes. (E) O2 consumption of males (n=6–8) was measured during 5–6 weeks of age. Note a repeatable, rapid reduction in O2 consumption in early phase of the dark period (arrows). (F) Comparison of O2 consumption during the light and dark periods between CON and CKO mice. (G) Core body temperature (Tc) measured by E-mitter biotelemetry (n=5–7, 8–10 weeks old males). Note a period of rapid reduction in core body temperature during the early phase of the dark period (arrow), a similar time point with rapid reduction of O2 (F). (H) Comparison of locomotion during light and dark periods between CON and CKO mice. Note a significantly increased locomotion during the dark period in CKO mice. (I) Locomotion in 8–10 weeks old males (n=5–7). Note a period of rapid reduction in locomotion in the early phase of the dark period (arrow), a similar time point with rapid reduction of O2 consumption in (F) and Tc (G). ⁎P<0.05.
To estimate EE in basal metabolic states, we measured O2 consumption during early light cycle with food removed. EE was dramatically reduced in CKO mice (Fig. 3A and B). Consistently, Tc measured during fasting dropped to a much lower level in CKO mice compared to CON mice after a period in the dark cycle (Fig. 3C), suggestive of a defective EE regulation for body temperature maintenance in CKO mice. UCP1 expression in BAT of CKO mice was about half of the CON level (Fig. 3D), suggesting a reduced level of sympathetic input to BAT. CKO mice had reduced locomotion and spent more time with no movement counts (Fig. 3E). The reduction of locomotion in response to fasting in CKO mice is much more pronounced than CON mice (Fig. 3F). To test whether glutamate release mediates the leptin action on thermogenic activity [8–9], we measured interscapular BAT (iBAT) temperature. In CON mice, compared to saline treatment, leptin administration increased iBAT temperature, which lasts about 1 h (Fig. 3G). In CKO mice, the same administration produced no difference in iBAT temperature (Fig. 3H). Taken together, these results suggest that glutamate release from LepR neurons is required to maintain body temperature during fasting states through activating BAT thermogenesis. An increased FGF21 in liver has been linked to torpor in response to fasting [22]. Compared to CON mice, FGF21 expression in CKO liver was unexpectedly reduced in fasting (Fig. 3I) whereas NPY and POMC expression in the brain was unchanged (Supplemental Fig. S6). It remains to be tested whether reduced FGF21 expression results from compensatory changes.
Figure. 3.
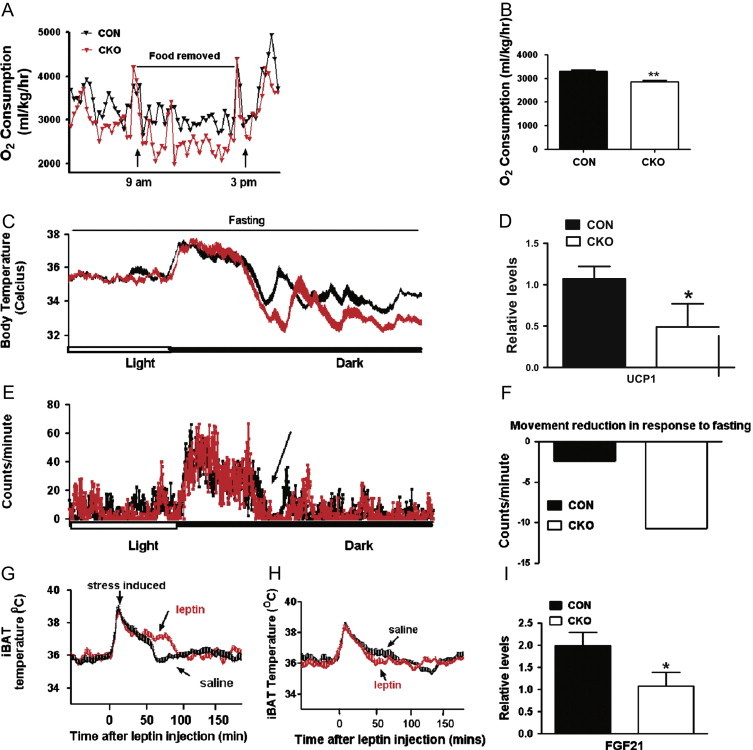
Disruption of glutamate release from LepR neurons leads to defective responses to fasting and leptin in energy expenditure (EE). (A) Resting EE in 5–6 weeks old males (n=6–8) from 9 am to 3 pm of the test day with food removed. (B) Comparison in O2 consumption measured during the 6-hour resting period. (C) Tc in 8–10 weeks old male mice (n=5–7) with fasted from late light period to the end of the dark period. Note a reduction in Tc of CKO mice compared to CON mice during dark periods. (D) UCP1 expression in the iBAT at the end of fasting period. (E) Locomotion measured by E-mitter biotelemetry from the same mice in (C). Note a more drastic reduction in locomotion in CKO mice (arrow). (F) Net difference in locomotion in the dark period between fed and fast conditions in CON and CKO mice. Note a reduction of 2 counts/minute in CON mice in response to fasting while 12 counts/minute in CKO mice. (G, H) iBAT temperature in response to saline and leptin in CON (G) and CKO (H) male mice (8–10 weeks old, n=5–6). Note that the injection procedure imposed a stress induced period of hyperthermia (both G and H). Compared to saline injection, leptin induced a period with higher temperature in iBAT of CON mice (G). In CKO mice, no difference in iBAT temperature produced by leptin administration (H). (I) FGF21 expression in liver at the end of the fasting period. ⁎P<0.05.
In this study, we showed that disruption of glutamate release from LepR neurons leads to reduced EE but normal food intake, suggesting a specific role for the leptin→glutamatergic neurons→glutamate release neural pathway in EE regulation through sympathetic output to BAT. Interestingly, the degree of EE reduction in CKO mice relative to control mice is more pronounced at the resting state with food removed than on high-fat diet feeding, suggesting a preferential role for glutamate release in EE regulation during fasting conditions. Since leptin levels are reduced during fasting [23], leptin might only play a permissive role in maintaining a level of EE for body temperature regulation.
Disruption of glutamate release from LepR neurons leads to bouts of rapidly reduced EE, body temperature and locomotion, which are characteristics of torpor behavior [3]. However, stark differences are discernable between CKO behavior and torpor: temperature drop in our mice was only about 2 °C whereas that in torpor is usually about 10 °C; the duration of the temperature drop was only about an hour whereas that in torpor lasts more than 4 h; and the hypothermia in our mice starts early while torpor starts later in the dark period [3]. These differences suggest that glutamate release from LepR neurons might only be part of neurocuitry that regulates torpor [10]. It is interesting to point out that leptin concentrations exhibit a circadian peak during early dark period, a similar time point when CKO mice develop rapid reduction in EE, body temperature and locomotion, suggesting that glutamate may mediate circadian action of leptin on energy expenditure [24]. The brain sites that mediate the action of glutamate release from LepR neurons on EE are unknown. VMH glutamatergic neurons may not be important since mice with Vglut2 deletion in the VHM showed normal EE [20]. Growing evidence suggests that DMH neurons might play an important role. DMH neurons control sympathetic output to BAT [9]; direct leptin action in DMH stimulates EE [8]; and the orphan receptor, GRP50, selectively expressed in the DMH, mediates leptin action on EE and torpor in mice [25]. Notably, both CKO mice and GRP50 knockout mice showed lower energy expenditure while exhibiting increased locomotion [25]. Furthers studies are warranted to test glutamate release specifically from LepR neurons in DMH as well as other brain regions in EE regulation. In conclusion, our results reveal a role for glutamate release from LepR neurons in mediating EE in accordance of energy availability.
Conflict of interest
None declared.
Acknowledgments
This work was supported by a Scientist Development Award from the American Heart Association (to QT), grants from National Institute of Health DK092605 (to QT), and R01 DK092587 and P/F NORC#2P30-DK072476-06 (to HM). This work utilized the facilities of the Cell Biology and Bioimaging and Genomics Core supported in part by COBRE (NIH P20-RR021945) and CNRU (NIH 1P30-DK072476) center grants from NIH.
Appendix A. Supporting information
Supplementary data associated with this article can be found in the online version at doi:10.1016/j.molmet.2013.01.004.
Appendix A. Supplementary materials
Supplementary data
References
- 1.Silva J.E. Thermogenic mechanisms and their hormonal regulation. Physiological Reviews. 2006;86:435–464. doi: 10.1152/physrev.00009.2005. [DOI] [PubMed] [Google Scholar]
- 2.Overton J.M., Williams T.D. Behavioral and physiologic responses to caloric restriction in mice. Physiology & Behavior. 2004;81:749–754. doi: 10.1016/j.physbeh.2004.04.025. [DOI] [PubMed] [Google Scholar]
- 3.Melvin R.G., Andrews M.T. Torpor induction in mammals: recent discoveries fueling new ideas. Trends in Endocrinology and Metabolism. 2009;20:490–498. doi: 10.1016/j.tem.2009.09.005. [DOI] [PMC free article] [PubMed] [Google Scholar]
- 4.Gluck E.F., Stephens N., Swoap S.J. Peripheral ghrelin deepens torpor bouts in mice through the arcuate nucleus neuropeptide Y signaling pathway. American Journal of Physiology—Regulatory, Integrative and Comparative Physiology. 2006;291:R1303–1309. doi: 10.1152/ajpregu.00232.2006. [DOI] [PubMed] [Google Scholar]
- 5.Bates S.H., Dundon T.A., Seifert M., Carlson M., Maratos-Flier E., Myers M.G., Jr. LRb-STAT3 signaling is required for the neuroendocrine regulation of energy expenditure by leptin. Diabetes. 2004;53:3067–3073. doi: 10.2337/diabetes.53.12.3067. [DOI] [PubMed] [Google Scholar]
- 6.Geiser F., Kortner G., Schmidt I. Leptin increases energy expenditure of a marsupial by inhibition of daily torpor. American Journal of Physiology. 1998;275:R1627–1632. doi: 10.1152/ajpregu.1998.275.5.R1627. [DOI] [PubMed] [Google Scholar]
- 7.Trayhurn P., James W.P. Thermoregulation and non-shivering thermogenesis in the genetically obese (ob/ob) mouse. Pflügers Archiv. 1978;373:189–193. doi: 10.1007/BF00584859. [DOI] [PubMed] [Google Scholar]
- 8.Enriori P.J., Sinnayah P., Simonds S.E., Garcia Rudaz C., Cowley M.A. Leptin action in the dorsomedial hypothalamus increases sympathetic tone to brown adipose tissue in spite of systemic leptin resistance. The Journal of Neuroscience. 2011;31:12189–12197. doi: 10.1523/JNEUROSCI.2336-11.2011. [DOI] [PMC free article] [PubMed] [Google Scholar]
- 9.Zhang Y., Kerman I.A., Laque A., Nguyen P., Faouzi M., Louis G.W. Leptin-receptor-expressing neurons in the dorsomedial hypothalamus and median preoptic area regulate sympathetic brown adipose tissue circuits. The Journal of Neuroscience. 2011;31:1873–1884. doi: 10.1523/JNEUROSCI.3223-10.2011. [DOI] [PMC free article] [PubMed] [Google Scholar]
- 10.Gavrilova O., Leon L.R., Marcus-Samuels B., Mason M.M., Castle A.L., Refetoff S. Torpor in mice is induced by both leptin-dependent and -independent mechanisms. Proceedings of the National Academy of Sciences USA. 1999;96:14623–14628. doi: 10.1073/pnas.96.25.14623. [DOI] [PMC free article] [PubMed] [Google Scholar]
- 11.Cohen P., Zhao C., Cai X., Montez J.M., Rohani S.C., Feinstein P. Selective deletion of leptin receptor in neurons leads to obesity. Journal of Clinical Investigation. 2001;108:1113–1121. doi: 10.1172/JCI13914. [DOI] [PMC free article] [PubMed] [Google Scholar]
- 12.Scott M.M., Lachey J.L., Sternson S.M., Lee C.E., Elias C.F., Friedman J.M. Leptin targets in the mouse brain. Journal of Comparative Neurology. 2009;514:518–532. doi: 10.1002/cne.22025. [DOI] [PMC free article] [PubMed] [Google Scholar]
- 13.Myers M.G., Jr., Munzberg H., Leinninger G.M., Leshan R.L. The geometry of leptin action in the brain: more complicated than a simple ARC. Cell Metabolism. 2009;9:117–123. doi: 10.1016/j.cmet.2008.12.001. [DOI] [PMC free article] [PubMed] [Google Scholar]
- 14.Vong L., Ye C., Yang Z., Choi B., Chua S., Jr., Lowell B.B. Leptin action on GABAergic neurons prevents obesity and reduces inhibitory tone to POMC neurons. Neuron. 2011;71:142–154. doi: 10.1016/j.neuron.2011.05.028. [DOI] [PMC free article] [PubMed] [Google Scholar]
- 15.Xu Y., O'Brien W.G., 3rd, Lee C.C., Myers M.G., Jr., Tong Q. Role of GABA release from leptin receptor-expressing neurons in body weight regulation. Endocrinology. 2012;153:2223–2233. doi: 10.1210/en.2011-2071. [DOI] [PMC free article] [PubMed] [Google Scholar]
- 16.Leshan R.L., Opland D.M., Louis G.W., Leinninger G.M., Patterson C.M., Rhodes C.J. Ventral tegmental area leptin receptor neurons specifically project to and regulate cocaine- and amphetamine-regulated transcript neurons of the extended central amygdala. Journal of Neuroscience. 2010;30:5713–5723. doi: 10.1523/JNEUROSCI.1001-10.2010. [DOI] [PMC free article] [PubMed] [Google Scholar]
- 17.Tong Q., Ye C.P., Jones J.E., Elmquist J.K., Lowell B.B. Synaptic release of GABA by AgRP neurons is required for normal regulation of energy balance. Nature Neuroscience. 2008;11:998–1000. doi: 10.1038/nn.2167. [DOI] [PMC free article] [PubMed] [Google Scholar]
- 18.Madisen L., Zwingman T.A., Sunkin S.M., Oh S.W., Zariwala H.A., Gu H. A robust and high-throughput Cre reporting and characterization system for the whole mouse brain. Nature Neuroscience. 2010;13:133–140. doi: 10.1038/nn.2467. [DOI] [PMC free article] [PubMed] [Google Scholar]
- 19.Faouzi M., Leshan R., Bjornholm M., Hennessey T., Jones J., Munzberg H. Differential accessibility of circulating leptin to individual hypothalamic sites. Endocrinology. 2007;148:5414–5423. doi: 10.1210/en.2007-0655. [DOI] [PubMed] [Google Scholar]
- 20.Tong Q., Ye C., McCrimmon R.J., Dhillon H., Choi B., Kramer M.D. Synaptic glutamate release by ventromedial hypothalamic neurons is part of the neurocircuitry that prevents hypoglycemia. Cell Metabolism. 2007;5:383–393. doi: 10.1016/j.cmet.2007.04.001. [DOI] [PMC free article] [PubMed] [Google Scholar]
- 21.Elmquist J.K., Ahima R.S., Maratos-Flier E., Flier J.S., Saper C.B. Leptin activates neurons in ventrobasal hypothalamus and brainstem. Endocrinology. 1997;138:839–842. doi: 10.1210/endo.138.2.5033. [DOI] [PubMed] [Google Scholar]
- 22.Inagaki T., Dutchak P., Zhao G., Ding X., Gautron L., Parameswara V. Endocrine regulation of the fasting response by PPARalpha-mediated induction of fibroblast growth factor 21. Cell Metabolism. 2007;5:415–425. doi: 10.1016/j.cmet.2007.05.003. [DOI] [PubMed] [Google Scholar]
- 23.Ahima R.S., Prabakaran D., Mantzoros C., Qu D., Lowell B., Maratos-Flier E. Role of leptin in the neuroendocrine response to fasting. Nature. 1996;382:250–252. doi: 10.1038/382250a0. [DOI] [PubMed] [Google Scholar]
- 24.Kalra S.P., Bagnasco M., Otukonyong E.E., Dube M.G., Kalra P.S. Rhythmic, reciprocal ghrelin and leptin signaling: new insight in the development of obesity. Regulatory Peptides. 2003;111:1–11. doi: 10.1016/s0167-0115(02)00305-1. [DOI] [PubMed] [Google Scholar]
- 25.Bechtold D.A., Sidibe A., Saer B.R., Li J., Hand L.E., Ivanova E.A. A role for the melatonin-related receptor GPR50 in leptin signaling, adaptive thermogenesis, and torpor. Current Biology. 2012;22:70–77. doi: 10.1016/j.cub.2011.11.043. [DOI] [PubMed] [Google Scholar]
Associated Data
This section collects any data citations, data availability statements, or supplementary materials included in this article.
Supplementary Materials
Supplementary data