

Abstract
Knowledge of taxis (directed swimming) in the Archaea is currently expanding through identification of novel receptors, effectors, and proteins involved in signal transduction to the flagellar motor. Although the ability for biological cells to sense and swim toward hydrogen gas has been hypothesized for many years, this capacity has yet to be observed and demonstrated. Here we show that the average swimming velocity increases in the direction of a source of hydrogen gas for the methanogen, Methanococcus maripaludis using a capillary assay with anoxic gas-phase control and time-lapse microscopy. The results indicate that a methanogen couples motility to hydrogen concentration sensing and is the first direct observation of hydrogenotaxis in any domain of life. Hydrogenotaxis represents a strategy that would impart a competitive advantage to motile microorganisms that compete for hydrogen gas and would impact the C, S and N cycles.
Hydrogen gas (H2) is a crucial substrate for methanogens as well as a common source of energy for other organisms in both anaerobic and aerobic environments, including acetogens, sulfate- and sulfur-reducers, and hydrogen-oxidizers1,2,3,4. Biological methane (CH4) production from H2 and carbon dioxide (CO2) contributes to greenhouse gas emissions and is possibly one of the oldest microbial metabolisms5,6. Understanding the ecological strategies of methanogens is not only important for our knowledge of early earth processes and present-day anaerobic environments, but also for determining potential roles in human health conditions (e.g., colon cancer and periodontal disease), where positive correlations have been made with incidence of disease and occurrence of methanogens7,8. Methanococcus maripaludis is an anaerobic archaeum that can use H2 or formate as electron donor to reduce CO2 to CH4 and is considered a model mesophilic methanogen. Recently, the swimming behavior of M. maripaludis was described9, but chemotactic responses have not been shown. Chemotaxis has been demonstrated for Archaea, including methanogens10,11, but taxis to hydrogen has not been shown for any domain of life. The chemotaxis signal transduction system in Archaea is similar to the well-studied system in Bacteria; however, the flagellar switch is different and none of the archaeal flagellar proteins have homologs to bacterial flagellar proteins12,13,14,15.
Chemotaxis has been the subject of many mathematical models and the majority have concentrated on reproducing the population-level observation of migrating bands of high cell concentration in swarm plates and capillary experiments16. Pioneering work in modeling chemotaxis behavior by Keller and Segel in 1971 has been the basis of the most common mathematical models17. In one dimension, with x being the spatial variable, the Keller-Segel model can be described as a flux, J, such that
 |
where μ is the cell diffusion coefficient that takes random, non-directed, movement of cells into account. b is the microbial population density, s is the attractant concentration and χ(s) is the non-constant chemotactic coefficient. The population flux, J, can be differentiated to yield the more common form
 |
and the average cell swimming velocity, v, is calculated by dividing the flux by the population density, or v = J/b. Lapidus and Schiller18 proposed a form of χ(s) such that
 |
where χ is the constant chemotactic coefficient and kd is the receptor-ligand binding dissociation constant. The Lapidus-Schiller χ(s) term, and variations thereof, have been used widely to describe chemotaxis in bacteria19. Most work on archaeal chemotaxis has been performed with Halobacterium salinarum; however, attempts to mathematically describe population flux in archaea have not been published. In addition, χ and kd have not been determined for any archaea12,20,21,22.
The goal of the present study was to subject M. maripaludis cells to a H2 concentration gradient and compare swimming behavior to model predictions. Attractant (H2) transport was modeled by Fickian diffusion and consumption by the population was modeled in the Michaelis–Menten form such that
 |
where D is the diffusion coefficient for H2, rmax is the maximum consumption rate, and km is the half-saturation constant.
A modified capillary assay was used in which cells were loaded into a gas-tight anaerobic capillary under an anoxic atmosphere, and a valve allowed controlled exposure to a H2 source (see Supplementary Fig. S1 and S2 online). In previous experiments, capillaries that contained a dissolved chemoattractant were immerged into a cell suspension and cells entered the capillary in the presence of a chemoattractant over a known incubation time. The population increase in the capillary relative to a control was then quantified through cell enumeration23. For this study, a novel method was developed to directly observe microscopic swimming behavior of anaerobic cells inside a capillary during exposure to a gas. M. maripaludis cells were tracked for direction and velocity changes upon exposure to H2 or an Argon (Ar) control to quantify the average population-wide response. Cell movement was measured using time-lapse confocal laser scanning microscopy (CLSM) in the center of the capillary (0.5 cm from the gas phase; as in Supplementary Fig. S1 online). A reaction-diffusion model predicted that within 10–15 minutes H2 concentrations would reach the threshold of 2.5–23 μM, at which hydrogenotrophic methanogens have been shown to use H2 in pure culture studies24,25,26,27 (Figure 1).
Figure 1. The predicted hydrogen concentration over time at the observation point 0.5 cm from the gas phase over the course of the experiment shown with (A) linear axes and (B) log-linear axes.

The 2.5–23 μM threshold, at which hydrogenotrophic methanogens have been shown to use H2 in pure culture studies24,25,26,27, is reached at approximately 10 minutes.
Results
When M. maripaludis cells were exposed to H2, the average swimming velocity exhibited significant bias toward H2 within ten minutes (Figure 2A). Biased random walk was not observed when cells were exposed to an Ar gradient (Figure 2B), nor was swimming velocity affected normal to the H2 or Ar gradients (Figures 2C and D). A strong chemotactic response was observed when cells were first starved of H2 for 4–5 hours, while cultures that had not been starved did not show an increase in biased swimming (see Supplementary Fig. S3 online). Similar results were observed in Rhodobacter sphaeroides and Sinorhizobium meliloti when well-fed cells exhibited weaker chemotactic responses than starved cells toward attractants such as organic acids and sugars. It was suggested that this was because chemosensory pathways in these organisms were dependent on metabolic state and/or transport28, as could be the case for H2 sensing in M. maripaludis.
Figure 2. Average cell velocity (black) with 95% confidence intervals (gray) before and after opening valve to gas phase for (A) H2 and (B) Ar control.

Positive y-axis values indicate movement toward the gas phase, negative y-axis values indicate movement away from the gas phase. Average cell velocity (C) and (D) normal to concentration gradient (n = 5 for H2 and n = 3 for Ar).
The starvation period (4–5 h) that was required to induce a tractable response to H2 did not cause loss of motility, as observed during starvation of H. salinarum20. The average swimming speed of starved M. maripaludis cells was 2.1 ± 0.05 μm s−1 before exposure to H2 (Figure 3A) and increased to 3.1 ± 0.02 μm s−1 after exposure; equal to non-starved cells. Maximum swimming speed averages (calculated by averaging the single maximum speed from each time point) were highly variable between time points, and the average maximum was higher for non-starved cells (9.3 μm s−1 versus 8.5 μm s−1 for starved cells + H2) and lowest for starved cells before H2 exposure (7.0 μm s−1) (Figure 3B). The highest maximum observed speed was 91 μm s−1 for H2 starved cells after exposure to H2 (Figure 3B inner boxes), approximately twice the previously observed maximum speed of 45 μm s−1 for M. maripaludis9.
Figure 3. Swimming speed of M. maripaludis cells when starved for 5 hours before H2 exposure (−H2 and n = 4,725), after H2 exposure (+H2 and n = 20,189), and when not starved (No starve, n = 45,001).

Values represent the mean and error bars represent 95% confidence intervals. (A) Average swimming speed. The difference between –H2 and both +H2 and no starvation is significant (p < 0.05). (B) Average maximum swimming speeds are represented by bars, and absolute maximum values inside each bar represent the highest observed speed over all time points for the condition. Differences between all conditions are significant (p < 0.05) and p values were calculated with two-tailed t-tests.
A Keller-Segel model was applied with boundary conditions specific to our study in an effort to quantify the observed chemotactic response to H2 in context with other known chemotactic responses. Currently, K-S model parameter values do not exist for any organism in Archaea or for any other gas besides O2; therefore, a broad range of kd values were used in the model. Three unknowns, namely ligand-receptor dissociation constant (kd), chemotactic coefficient (χ), and random cell diffusion coefficient (μ), were independently fitted by varying one unknown across the range of published literature values, while keeping the other two variables constant at the average literature values (see Supplementary Table S1 online). The best fit for average swimming velocity was obtained with a kd value of 0.70 mM, with 0.30 and 2.30 mM corresponding to the 95% confidence interval of the data, while χ and μ were kept at average published values (Figure 4A). This range for kd is similar to that observed for Escherichia coli AW405 to α-methyl aspartate29. It is; however, quite different from values reported for Bacillus subtilis receptor affinity to O2 (0.0015 and 0.075 mM for the high and low affinity of the receptor, respectively), which is the only previously reported kd for a gas30.
Figure 4. Model fitting results (smooth black lines) overlaid on experimental results with 95% confidence intervals (grey lines) (A) using average literature values for χ and μ and varying kd over the range shown or (B) using average literature values for kd and μ while varying χ over the range shown (C) or μ varied across the range of literature values.

The model could also be fitted to the velocity curve by varying χ and keeping kd and μ constant at average literature values (Figure 4B). The average χ of 9.3 × 10⁻³ cm2 s−1 used to fit the experimental results is higher than the literature range 7.20 × 10⁻⁵ to 1.24 × 10⁻³ cm2 s−1 (see Supplementary Table S1 online). The experimental results were best fitted to the model that assumed the average published value for χ, and then by varying kd (Figure 4A). The model could not be fitted to the experimental data by varying μ according to published values (Figure 4C, note the difference in y-axis scale); however, changing μ allowed for a change in shape of the velocity curve.
The response time predicted by the model does not fit the rapid response observed in the experiment and this is likely due to an inaccurate prediction of mass transport inside the capillary (for both H2 and cells). Both random cell diffusion (μ) and the diffusion of hydrogen would require correction from predicted values if mass transport was inaccurately represented. First, considering μ independently, it is likely that response time would be faster for cells with a larger μ (Figure 4C). This is based on the proportionality of μ to swimming speed and run time, and inverse proportionality to one minus the cosine of the turn angle θ31. Although not measured directly here, M. maripaludis has been shown to have relatively long runs and small changes in direction or turn angles9. Turn angles between 20 and 45° would result in the largest value of μ for a given swimming speed and run time, so it is reasonable to assume μ would be higher for this type of swimming. The observed rapid response can be explained by an inaccurate prediction of H2 mass flux into the liquid domain. If H2 were to reach the observation point faster than predicted by the model, then one would predict a proportionally faster response. This was an entirely static system on a visually observable scale but it is possible that unpredictable micro-scale convective forces increased H2 mass transport. The collective, directed motion of swimming cells may have induced convective flow inside the capillary. Previous work estimates that a force of 0.5 pN is exerted by a cell swimming at 25 μm s−1 32. While chemotaxis-induced convective flow is difficult to demonstrate conclusively, increased mass transport in the capillary could affect mass transport predictions.
A diffusion coefficient correction term, δ, was introduced as a tool to investigate the effect of increased mass transport on the predicted response time. The correction was applied to the H2 diffusion coefficient and the random cell diffusion coefficient (μ) simultaneously, making the assumption that micro-scale convection was the primary source of error. Any convection would affect the random diffusion of cells and the diffusion of H2 equally. Increased mass transport in the liquid (simulating convection) caused an earlier response in all conditions that were investigated (see Supplementary Fig. S4 online). The value of δ is likely to be on the order of 1 × 10⁻⁹ to 1 × 10⁻⁸ cm2 s−1 based on curve shape and response time as compared to the experimental velocity data.
Another possible explanation for the more rapid experimental response is the presence of more than one type of H2 receptor with varying affinities. This would allow M. maripaludis to respond to H2 across a wider range of concentrations. The predicted kd value 0.7 mM is high, and the presence of a high affinity receptor in M. maripaludis is likely. B. subtilis O2 receptors with two distinct affinities and binding components have been shown30. The presented data demonstrate a chemotactic response to H2, but more focused physiological studies and subsequent model refinement are needed to better represent this poorly understood phenomenon.
In our capillary assay, cells were not observed to accumulate in bands despite the chemotactic response observed. Typical chemotactic bands observed in capillary and swarm plate assays result from cell accumulation as a net result of a biased random walk16. In the capillary assay used, convection inside the capillary may have prevented cell accumulation. It is also possible that there are factors involved in chemotactic band formation that are unique between organisms or factors specific to hydrogenotaxis (e.g., swimming mode, adaption response, quorum sensing).
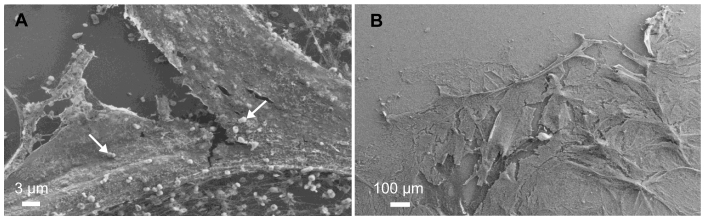
In our work, banding-like behavior was observed on a larger scale when M. maripaludis batch cultures were grown statically with H2. Under these conditions a pellicle formed at the gas-liquid interface (Figure 5A, B). This is a similar observation to the one made by Beijernck in 1893, where aerotactic cells were observed swimming toward the meniscus of a test tube16. When cultures of M. maripaludis were grown statically with the soluble electron donor formate, cells grew throughout the liquid medium (not in a pellicle) and had less cell-associated carbohydrate than H2-grown pellicle cultures (see Supplementary Fig. S5 online). These results suggest that extra-polymeric substance (EPS) production is important for the formation of a pellicle in response to a H2 gradient and may require a time-scale longer than used in the capillary experiment.
Figure 5. (A) and (B) Field emission scanning electron micrographs of M. maripaludis pellicle with extracellular material and cells (indicated by arrows in (A)).
Discussion
The hydrogenotrophic methanogen, M. maripaludis, displays chemotactic behavior toward H2 gas (hydrogenotaxis). Changes in pH were not observed in medium with or without H2 under the tested growth conditions and times, and these results indicate that the observed taxis was in response to H2 and not H+. Although the commonly used Keller-Segel model was not able to predict the exact response with previously published parameter ranges (values), parameter adjustment allowed the model to replicate the trend on a scale similar to other organisms and chemoattractants. The ability to move toward higher concentrations of H2 could incur an advantage to methanogens that are otherwise outcompeted by those that are able to use H2 at lower concentrations and/or utilize terminal electron acceptors that are more energetically favorable. The demonstrated chemotactic response would also allow cells to maintain desirable localization with respect to the major energy source as well as allow for proximity to H2-producers in mixed communities. Thus, hydrogenotaxis could play a crucial role in the establishment and maintenance of microbial interactions at the population- and community-level. The observed hydrogenotaxis could represent a widespread eco-physiological strategy of methanogens and other hydrogen-utilizing microbes that are important to processes such as bioremediation and overall carbon cycling4,33. CH4 is a potent greenhouse gas that has an estimated global warming potential (GWP) 25–40% higher than CO2 per molecule34. The three largest contributions of CH4 to atmospheric flux as of 2010 (wetlands, ruminant emissions, and rice cultivation) are the net result of the activity of anaerobic communities dominated by the exchange of H235,36. To the best of our knowledge this is the first direct observation of hydrogenotaxis in any domain of life.
Methods
Culturing conditions
Methanococcus maripaludis strain S2 was grown in Balch tubes or serum bottles fitted with black butyl stoppers (Geo-Microbial Technologies Inc., Ochelata, OK) and aluminum crimp seals. Methanococcus Culture Medium (MCC) was prepared under a stream of anoxic 80% N2, 20% CO2 and contains per liter 0.33 g KCl, 2.7 g, MgCl2•6H2O, 3.5 g MgSO4•7H2O, 0.14 g CaCl2•2H2O, 0.5 g NH4Cl, 5 g NaHCO3, 22 g NaCl, 0.14 g K2HPO4, 5 mL FeSO4 solution (0.19 g FeSO4•7H2O/100 mL of 10 mM HCl), 1 mL trace metal solution (per 100 mL; 2.1 g Na3Citratė2H2O, adjust pH to 6.5, then 0.45 g MnSO4•H2O, 0.1 g CoCl2•6H2O, 0.1 g ZnSO4•7H2O, 0.01 g CuSO4•5H2O, 0.01 g AlK(SO4)2, 0.01 g H3BO4, 0.1 g Na2MoO4•2H2O, 0.025 g NiCl2•6H2O, 0.2 g Na2SeO3, 0.01 g VCl3, 0.0033 g Na2WO4•2H2O) 10 mL of vitamin solution (per liter; 2 mg biotin, 2 mg folic acid, 10 mg pyridoxine HCl, 5 mg thiamine HCl, 5 mg riboflavin, 5 mg nicotinic acid, 5 mg DL-calcium pantothenate, 0.1 mg vitamin B12, 5 mg ρ-aminobenzoinc acid, 5 mg lipoic acid), 1 mL of Resazurin solution (1 g/L). This solution is boiled under a stream of gas before adding 0.5 g cysteine•H2O•HCl, then cooled under gas37. The solution was dispensed anaerobically and autoclaved. After inoculation, the headspace was displaced and pressurized to 25 PSI with anoxic 80% H2:20% CO2 through a sterile filter. Modified MCC medium was used for growth experiments with formate, where NaCl was reduced to 10.5 g/L; 200 mM Na-formate and 200 mM 3-(N-morpholino) propanesulfonic acid (MOPS) were added, and no H2 was added.
Cultures for taxis experiments were grown at 30°C (with no shaking) from frozen glycerol stocks in 40 mL MCC in 125 mL serum bottles to late exponential phase, then transferred to 5 mL MCC (10% inoculum) in 18 × 150 mm Balch tubes. These working cultures were grown to stationary phase (around 120 h and average cell density 69,420 cells/mL). 1 mL of culture was added to 5 mL fresh MCC in a Balch tube with no H2 and either incubated for 4–5 h at 30°C under starvation conditions (no electron source), or used immediately for non-starvation conditions. Media salts were separated from cell suspension prior to taxis experiments by centrifuging the inverted Balch tube (100 × g; 30°C for 10 minutes).
Electron microscopy
Pellicles were removed from tubes with a plastic inoculating loop and placed on a round coverslip freshly treated with poly-L-Lysine (1 μg/mL) and fixed in a solution of 2% paraformaldehyde, 2.5% glutaraldehyde and 0.05 M Na-cacodylate overnight at room temperature. Coverslips were rinsed and stepwise dehydrated in ethanol, and then critical point dried on a Samdri-795 (tousimis, Rockville, MD). Coverslips were mounted on SEM stubs with double-sided carbon tape and colloidal silver, and then sputter coated with Iridium for 35 s at 35 mA. Images were collected on a Zeiss Supra55VP FE-SEM.
Capillary assay
Square glass capillary tubes (1.0 mm) with the ends fitted with norprene tubing connected to a polypropylene female luer-lock hose barb adapter (Cole-Parmer, Vernon Hills, IL) were partially filled with the cell suspension in an anaerobic chamber that contained only N2 and CO2. A 5 mL glass gas-tight luer lock syringe (SGE, Inc., Austin, TX) was used to transfer the cells to the capillary, and left attached to the capillary with the valve closed. A second 5 mL glass gas-tight syringe with 100% H2 was attached to the gas side of the capillary (see Supplementary Fig. S1 online). The entire syringe/capillary assembly was removed from the anaerobic chamber and placed in a petri dish water bath on the microscope stage and firmly secured with poster putty and tape (see Supplementary Fig. S3 online).
Microscopic observation of swimming behavior and image analysis
A Leica TCS SP5 II upright confocal microscope was enclosed in an incubation chamber and was equilibrated to 30°C. High-resolution time lapse images were collected every 0.753 s at the center of the capillary, 0.5 cm from the cell suspension/gas phase interface. A 25 × water-dipping objective was used and a 3 × optical zoom was applied resulting in a final field of view of 206.9 × 206.9 μm2 and a pixel size of 0.20 μm. Images were initially acquired for 10 minutes with N2/CO2 in the gas phase, then the valve was opened to the H2 syringe and images were captured for 40 minutes. The control experiments were identical to the above except that 100% Ar was used instead of H2, and images were acquired for a minimum of 8 minutes before the valve was opened and 38 minutes after.
Images were manually thresholded and binarized using MetaMorph v. 7.6 (Molecular Devices, Sunnyvale, CA). Binary images were analyzed using Imaris v. 7.5.2 (Bitplane, Inc., South Windsor, CT) with a particle-tracking module (Imaris Track). 1 s, 5 s, and 10 s filter durations were tested where a given track was only analyzed if it was as long or longer than the specified duration. The 5 s filter was used for the described analyses, and differences were not observed in overall trends between track lengths.
Chemotaxis model
A one dimensional finite element model was constructed using Comsol Multiphysics Version 4.3 a that solves Equations 2 and 4 simultaneously in the liquid domain. Diffusion of hydrogen through the gas domains was modeled by Maxwell-Stefan equations. All model parameters were corrected for temperature (30°C) and salinity (2.65% m/v) of the medium, where possible, and hydrogen consumption rate parameters were estimated from literature values. Supplementary Table S1 online shows all constants used in the model.
The geometry of the model consisted of one liquid domain and two gas domains separated by a valve that opens at t = 0 to start the diffusion of hydrogen into the system. The short segment between the valve and the far right boundary is the length of the connection between the valve and the main volume of the gas-tight syringe. The geometry for each experimental replicate was slightly different so average lengths were used. The diffusion of hydrogen through the gas domain of the capillary was expected to be much faster than diffusion through the liquid domain so the precise length of the gas domain was not expected to affect the analysis. The diffusion-limiting segment between the liquid-gas interface and the point of observation 0.5 cm into the liquid remained constant through all replicates and is therefore not an average value. Initial conditions are zero hydrogen inside the capillary, 100% hydrogen behind the valve in the second gas domain and a constant population density in the liquid domain. Supplementary Figure S1 online shows the geometry, initial conditions and boundary conditions used in the model.
The model geometry was meshed at a maximum element size of 0.1 mm and time step discretization was done with a backward differentiation formula (BDF) method. The time steps taken by the solver were allowed to be free with larger steps being taken at later time points where gradients are shallower. A relative solution tolerance of 10−20 was imposed and PARDISO38 was the general direct solver as implemented in Comsol.
Most parameters in the model are well known or able to be calculated from the literature with the exception of the chemotaxis constants χ, μ and kd. A literature search was performed for observed chemotaxis values in any organism to establish a range of reasonable values. Twelve applicable values were found for χ, twenty-one for μ and seven for kd. Maximum, average and minimum values for each are found in Table S1. The model was fitted to the average swimming velocity data by independently varying one chemotaxis parameter by trial and error while keeping the other two constant at the average literature value found in Supplementary Table S1 online.
Every effort was made to model the diffusion of hydrogen into the liquid domain accurately; however, the likelihood of unpredictable factors such as micro-scale mixing due to convection still exists. To provide the flexibility to correct for enhanced mass transport, a correction term was applied such that
 |
Where δ represents the mass transport enhancement beyond what is predicted from Fickian diffusion alone and D'Haq is the corrected diffusion coefficient used in the model for this analysis. Similarly, δ was also applied to the random cell diffusion coefficient such that
 |
because any correction applied to DHaq would need to be applied to μ on grounds that convection would affect the movement of cells the same as the pass transport of H2.
Carbohydrate and protein measurements
Protein concentrations were determined with the Lowry assay using bovine serum albumin as the standard39. Hexose sugars were measured by the colorimetric cysteine-sulfuric acid method with glucose as the standard. Pentose sugars were measured with a colorimetric orcinol-FeCl3 assay with xylose as the standard. A colorimetric carbazole assay was used to measure uronic acid concentration with D-galacturonic acid as the standard40.
Author Contributions
K.A.B. developed experimental design, performed experiments, critically evaluated the model, wrote and revised the manuscript. J.M.C. developed experimental design, performed experiments, created the model, wrote and revised the manuscript. C.D. performed experiments and revised the manuscript. R.G. developed experimental design, critically evaluated the model, and revised the manuscript. M.W.F. developed experimental design, critically evaluated the model, and revised the manuscript.
Supplementary Material
Supplementary Table and Figures
Acknowledgments
The authors wish to thank Sara Altenburg for helping with the pH experiment, Betsey Pitts for microscopy assistance, Gill Geesey for encouraging us to pursue the experiments, Al Parker for assistance with statistics, Adam Arkin and Roland Hatzenpichler for helpful comments, and William B. Whitman for his suggestion to use formate. This work conducted by ENIGMA- Ecosystems and Networks Integrated with Genes and Molecular Assemblies (http://enigma.lbl.gov), a Scientific Focus Area Program at Lawrence Berkeley National Laboratory, was supported by the Office of Science, Office of Biological and Environmental Research, of the U. S. Department of Energy under Contract No. DE-AC02-05CH11231. K.A.B. and J.M.C. were also supported by a NSF-IGERT fellowship in Geobiological Systems at Montana State University (DGE 0654336). Partial support for R.G. was provided through the National Science Foundation under CHE-1230632. The confocal microscopy equipment used was purchased with funding from the NSF-Major Research Instrumentation Program and the M.J. Murdock Charitable Trust.
References
- Ferrera I. et al. Diversity of 16S rRNA gene, ITS region and aclB gene of the Aquificales. Extremophiles 11, 57–64 (2006). [DOI] [PubMed] [Google Scholar]
- Reysenbach A. L., Longnecker K. & Kirshtein J. Novel Bacterial and Archaeal Lineages from an In Situ Growth Chamber Deployed at a Mid-Atlantic Ridge Hydrothermal Vent. Applied and Environmental Microbiology 66, 3798–3806 (2000). [DOI] [PMC free article] [PubMed] [Google Scholar]
- Poehlein A. et al. An Ancient Pathway Combining Carbon Dioxide Fixation with the Generation and Utilization of a Sodium Ion Gradient for ATP Synthesis. PLoS ONE 7, 1–8 (2012). [DOI] [PMC free article] [PubMed] [Google Scholar]
- Petersen J. M. et al. Hydrogen is an energy source for hydrothermal vent symbioses. Nature 476, 176–180 (2012). [DOI] [PubMed] [Google Scholar]
- Thauer R. K. The Wolfe cycle comes full circle. Proc. Natl. Acad. Sci. U.S.A. 109, 15084–15085 (2012). [DOI] [PMC free article] [PubMed] [Google Scholar]
- Ueno Y., Yamada K., Yoshida N., Maruyama S. & Isozaki Y. Evidence from fluid inclusions for microbial methanogenesis in the early Archaean era. Nature 440, 516–519 (2006). [DOI] [PubMed] [Google Scholar]
- Jarrell K. F. et al. Major players on the microbial stage: why archaea are important. Microbiology 157, 919–936 (2011). [DOI] [PubMed] [Google Scholar]
- Conway de Macario E. & Macario A. J. L. Methanogenic archaea in health and disease: A novel paradigm of microbial pathogenesis. Int. J. Med. Microbiol. 299, 99–108 (2009). [DOI] [PubMed] [Google Scholar]
- Herzog B. & Wirth R. Swimming Behavior of Selected Species of Archaea. Applied and Environmental Microbiology 78, 1670–1674 (2012). [DOI] [PMC free article] [PubMed] [Google Scholar]
- Migas J., Anderson K. L., Cruden D. L. & Markovetz A. J. Chemotaxis in Methanospirillum hungatei. Applied and Environmental Microbiology 55, 264–265 (1989). [DOI] [PMC free article] [PubMed] [Google Scholar]
- Sment K. A. & Konisky J. Chemotaxis in the archaebacterium Methanococcus voltae. Journal of Bacteriology 171, 2870–2872 (1989). [DOI] [PMC free article] [PubMed] [Google Scholar]
- Schlesner M. et al. Identification of Archaea-specific chemotaxis proteins which interact with the flagellar apparatus. BMC Microbiol 9, 56–56 (2009). [DOI] [PMC free article] [PubMed] [Google Scholar]
- Lacal J., García-Fontana C., Muñoz-Martínez F., Ramos J.-L. & Krell T. Sensing of environmental signals: classification of chemoreceptors according to the size of their ligand binding regions. Environ Microbiol 12, 2873–2884 (2010). [DOI] [PubMed] [Google Scholar]
- Thomas N. A. & Jarrell K. F. Characterization of Flagellum Gene Families of Methanogenic Archaea and Localization of Novel Flagellum Accessory Proteins. Journal of Bacteriology 183, 7154–7164 (2001). [DOI] [PMC free article] [PubMed] [Google Scholar]
- Porter S. L., Wadhams G. H. & Armitage J. P. Signal processing in complex chemotaxis pathways. Nat Rev Micro 9, 153–165 (2011). [DOI] [PubMed] [Google Scholar]
- Adler J. Chemotaxis in Bacteria. Science 153, 708–716 (1966). [DOI] [PubMed] [Google Scholar]
- Keller E. F. & Segel L. A. Model for chemotaxis. Journal of Theoretical Biology 30, 225–234 (1971). [DOI] [PubMed] [Google Scholar]
- Lapidus I. R. & Schiller R. Model for the chemotactic response of a bacterial population. Biophysj 16, 779–789 (1976). [DOI] [PMC free article] [PubMed] [Google Scholar]
- Tindall M. J., Maini P. K., Porter S. L. & Armitage J. P. Overview of Mathematical Approaches Used to Model Bacterial Chemotaxis II: Bacterial Populations. Bull. Math. Biol. 70, 1570–1607 (2008). [DOI] [PubMed] [Google Scholar]
- Streif S., Staudinger W. F., Marwan W. & Oesterhelt D. Flagellar Rotation in the Archaeon Halobacterium salinarum Depends on ATP. Journal of Molecular Biology 384, 1–8 (2008). [DOI] [PubMed] [Google Scholar]
- del Rosario R. C. et al. Modelling the CheY D10K, Yl00W Halobacterium salinarum mutant: sensitivity analysis allows choice of parameter to be modified in the phototaxis model. IET systems biology 1, 207–221 (2007). [DOI] [PubMed] [Google Scholar]
- Alatyrev A. G. et al. Identification of the New Protein Participitating in the Archaea Motility Regulation. Biol Membrany 27, 121–132 (2010). [Google Scholar]
- Adler J. & Dahl M. M. A Method for Measuring the Motility of Bacteria and for Comparing Random and Non-random Motility. J Gen Microbiol 46, 161–173 (1967). [DOI] [PubMed] [Google Scholar]
- Thauer R. K., Kaster A.-K., Seedorf H., Buckel W. & Hedderich R. Methanogenic archaea: ecologically relevant differences in energy conservation. Nat Rev Micro 6, 579–591 (2008). [DOI] [PubMed] [Google Scholar]
- Lovley D. R. Minimum threshold for hydrogen metabolism in methanogenic bacteria. Applied and Environmental Microbiology 49, 1530–1531 (1985). [DOI] [PMC free article] [PubMed] [Google Scholar]
- Kaster A.-K., Moll J., Parey K. & Thauer R. K. Coupling of ferredoxin and heterodisulfide reduction via electron bifurcation in hydrogenotrophic methanogenic archaea. Proc. Natl. Acad. Sci. U.S.A. 108, 2981–2986 (2011). [DOI] [PMC free article] [PubMed] [Google Scholar]
- Ver Eecke H. C. et al. Hydrogen-limited growth of hyperthermophilic methanogens at deep-sea hydrothermal vents. Proc. Natl. Acad. Sci. U.S.A. 109, 13674–13679 (2012). [DOI] [PMC free article] [PubMed] [Google Scholar]
- Armitage J. P. & Schmitt R. Bacterial chemotaxis: Rhodobacter sphaeroides and Sinorhizobium meliloti-variations on a theme? Microbiology 143, 3671–3682 (1997). [DOI] [PubMed] [Google Scholar]
- Ahmed T. & Stocker R. Experimental Verification of the Behavioral Foundation of Bacterial Transport Parameters Using Microfluidics. Biophysical Journal 95, 4481–4493 (2008). [DOI] [PMC free article] [PubMed] [Google Scholar]
- Zhang W., Olson J. S. & Phillips Jr G. N. Biophysical and Kinetic Characterization of HemAT, an Aerotaxis Receptor from Bacillus subtilis. Biophysj 88, 2801–2814 (2005). [DOI] [PMC free article] [PubMed] [Google Scholar]
- Lewus P. & Ford R. M. Quantification of Random Motility and Chemotaxis Bacterial Transport Coefficients Using Individual-Cell and Population-Scale Assays. Biotechnol. Bioeng. 75, 292–304 (2001). [DOI] [PubMed] [Google Scholar]
- Kim M. & Kim T. Diffusion-Based and Long-Range Concentration Gradients of Multiple Chemicals for Bacterial Chemotaxis Assays. Anal. Chem. 82, 9401–9409 (2010). [DOI] [PubMed] [Google Scholar]
- Kleiner M. et al. Metaproteomics of a gutless marine worm and its symbiotic microbial community reveal unusual pathways for carbon and energy use. Proc. Natl. Acad. Sci. U.S.A. 109, E1173–E1182 (2012). [DOI] [PMC free article] [PubMed] [Google Scholar]
- Shindell D. T. et al. Improved Attribution of Climate Forcing to Emissions. Science 326, 716–718 (2009). [DOI] [PubMed] [Google Scholar]
- Neef L., van Weele M. & van Velthoven P. Optimal estimation of the present-day global methane budget. Global Biogeochem. Cycles 24, 1–10 (2010). [Google Scholar]
- Schlesinger W. H. & Bernhardt E. S. Biogeochemistry: An Analysis of Global Change. 3rd Ed. (Academic Press, Waltham, MA, 2013). [Google Scholar]
- Miller T. L. & Wolin M. J. A Serum Bottle Modification of the Hungate Technique for Cultivating Obligate Anaerobes. Appl Microbiol 27, 985–987 (1974). [DOI] [PMC free article] [PubMed] [Google Scholar]
- Schenk O. & Gärtner K. Solving unsymmetric sparse systems of linear equations with PARDISO. Future Gener Comput Syst 20, 475–487 (2004). [Google Scholar]
- Lowry O. H., Rosebrough N. J., Farr A. L. & Randall R. J. Protein Measurement with the Folin Phenol Reagent. J biol chem 193, 265–275 (1951). [PubMed] [Google Scholar]
- Chaplin M. F. & Kennedy J. F. Carbohydrate Analysis: A Practical Approach. The Practical Approach Series. 2nd Ed. (Irl Press, Oxford, 1994). [Google Scholar]
Associated Data
This section collects any data citations, data availability statements, or supplementary materials included in this article.
Supplementary Materials
Supplementary Table and Figures