

Abstract
Cornus mas L. is indigenous to Europe and parts of Asia. Although Cornus is widely considered to be an iridoid rich genera, only two iridoids have been previously found in this plant. The lack of information on taxonomically and biologically active iridoids prompted us to develop and optimize an analytical method for characterization of additional phytochemicals in C. mas fruit. An ultra performance liquid chromatography (UPLC) coupled with photodiode array spectrophotometry (PDA) and electrospray time-of-flight mass spectrometry (ESI-TOF-MS) was employed and mass parameters were optimized. Identification was made by elucidating the mass spectral data and further confirmed by comparing retention times and UV spectra of target peaks with those of reference compounds. Primary DNA damage and antigenotoxicity tests in E. coli PQ37 were used to screen the iridoids for biological activity. As a result, ten phytochemicals were identified, including iridoids loganic acid, loganin, sweroside, and cornuside. Nine of these were reported for the first time from C. mas fruit. The iridoids did not induce SOS repair of DNA, indicating a lack of genotoxic activity in E. coli PQ37. However, loganin, sweroside, and cornuside did reduce the amount of DNA damage caused by 4-nitroquinoline 1-oxide, suggesting potential antigenotoxic activity.
1. Introduction
Cornus mas L. is commonly known as European cornelian cherry and belongs to the Cornaceae family. It is a tall deciduous shrub or small tree (3–6 m in height) that is indigenous to Europe and parts of Asia [1, 2]. The fruit is edible but is astringent when unripe. Traditionally, C. mas has been used for improving health conditions, such as bowel complaints, fever, and diarrhea [3–6]. Fresh European cornelian cherry fruits are often processed to produce drinks, syrups, and jams [7, 8].
Some investigations of the nutritional and phytochemical properties of European cornelian cherry fruit have been reported previously. The fruit is reported to contain 0.1–0.3% fat, 0.4% protein, 21.7% carbohydrate, 0.8% ash, 0.5% dietary fiber, 6.6–15.1% total sugar (fructose 33.1–43.1%, glucose 53.6–63.1%), and 4.22–9.96% reducing sugars [3, 9]. The fruit has pH 2.7–3.2 and contains at least 15 amino acids, including aspartic acid, glutamic acid, serine, histidine, glycine, threonine, arginine, alanine, tyrosine, valine, phenylalanine, isoleucine, leucine, lysine, and proline [9]. Minerals in C. mas fruit include copper (1.2 to 8.1 mg/kg dry weight), iron, zinc, phosphorus, potassium, calcium, magnesium, and sulphur [9]. The vitamin C content of the fruit is reported to be 16.4 to 38.5 mg/100 g [9].
C. mas fruit has been found to contain a wide range of phytochemicals, including tannins (131.51–601.2 mg/L), phenolics (29.76–74.83 mg/g dry), organic acids (4.6–7.4%), anthocyanin, fatty acids, and flavonoids [3, 4, 10–16]. Anthocyanins seem to have been a popular subject of previous C. mas research. Anthocyanins have been found in the range of 1.12 to 2.92 mg/g in different C. mas fruit sources [14, 16, 17]. Two studies from Du and Francis reported the presence of five anthocyanins in the fruit, namely, delphinidin 3-galactoside, cyanidin 3-galactoside, cyanidin 3-rhamnosylgalactoside, pelargonidin 3-galactoside, and pelargonidin 3-rhamnosylgalactoside [18, 19]. Cyanidin 3-glucoside, cyanidin 3-rutinoside, and pelargonidin 3-glucoside were identified by Tural and Koca [15], with pelargonidin 3-O-glucoside being the most abundant followed by cyanidin 3-O-β-D-galactoside. Pelargonidin 3-O-rutinoside was present only in trace amounts [17]. Delphinidin 3-O-β-galactopyranoside, cyanidin 3-O-β-galactopyranoside, and pelargonidin 3-O-β-galactopyranoside were also identified in C. mas fruit [3].
Eight flavonoids have been previously isolated from the methanolic extract of C. mas fruit. These include aromadendrin 7-O-β-D-glucoside, quercetin 3-O-β-D-xyloside, quercetin 3-O-α-L-rhamnoside, quercetin 3-O-rutinoside, quercetin 3-O-β-D galactoside, quercetin 3-O-β-D-glucose, quercetin 3-O-β-D-glucoside, and kaempferol 3-O-galactoside [17]. Fatty acids identified in the fruit include lauric acid, myristic acid, pentadecenoic acid, palmitic acid, palmitoleic acid, stearic acid, oleic acid, vaccenic acid, linoleic acid, linolenic acid, and cis-10,12-octadecadienoic acid [9].
Cornus is widely considered to be an iridoid rich genera. However, there is very little information regarding the occurrence of iridoids in C. mas. Only two iridoids, secologanin and loganic acid, have been previously reported to occur in C. mas, with only one being reported for the fruit [20–22]. The current investigation was prompted by a lack of information on taxonomically critical and biologically active iridoids in C. mas fruit. The aim of this study is to identify more phytochemical compounds in the C. mas fruit, particularly bioactive iridoids, by using ultra performance liquid chromatography (UPLC) coupled with photodiode array spectrophotometry (PDA) and electrospray time-of-flight mass spectrometry (ESI-TOF-MS).
2. Materials and Methods
2.1. Chemicals and Standards
Optima acetonitrile (MeCN, lot no. 125783), methanol (MeOH, lot no. 124876), and formic acid of LC-MS grade were purchased from Fisher Scientific Co. (Fair Lawn, NJ, USA). Chromasolv® Water (H2O, lot no. SHBB9224V) of LC-MS grade was purchased from Sigma-Aldrich (St. Louis, MO, USA). Tartaric acid, malic acid, chlorogenic acid, gallic acid, and rutin standards were purchased from Sigma-Aldrich (St. Louis, MO, USA). Citric acid was purchased from Fisher Scientific Co. Loganic acid was obtained from ChromaDex (Irvine, CA, USA). Loganin, sweroside, and cornuside were purchased from Chengdu Biopurify Phytochemicals Ltd (Sichuan, China). The purities of all standards were higher than 98%. The standards were accurately weighed and then dissolved in an appropriate volume of MeOH to produce corresponding stock standard solutions. Working standard solutions were prepared by diluting the stock solutions with MeOH at different concentrations. All stock and working solutions were maintained at 0°C in a freezer.
2.2. Sample Collection and Preparation
C. mas fruit samples were collected from wild trees in the mountains near Kastamonu, Turkey, in 2012. A voucher specimen is deposited in Research and Development Department laboratory of Morinda Inc. (American Fork, Utah, USA). The raw fruits were mashed into puree and the seeds were removed. One gram of mashed fruit puree was weighed accurately and 9 mL of 50% MeOH in H2O was added. The mixture was sonicated for 30 minutes and then centrifuged. The supernatant was transferred into a volumetric flask and volume brought to 10 mL with 50% MeOH in H2O. All samples were filtered through a nylon microfilter (0.45 μm pore size) before UPLC analysis.
2.3. Instrumentation and Chromatographic Conditions
Analyses were performed with an Agilent 1260 Infinity LC System coupled to an Agilent 6230 time-of-flight (TOF) LC/MS System (Agilent Technologies, Santa Clara, CA). The Agilent 1260 LC module was coupled with a photodiode array (PDA) detector and a 6230 time-of-flight MS detector, along with a binary solvent pump and an autosampler. Chromatographic separations were performed with an Atlantis reverse phase C18 column (4.6 mm × 250 mm; 5 μm, Waters Corporation, Milford, MA, USA). The pump was connected to a gradient binary solvent system: A, 0.1% formic acid in H2O (v/v) and B, 0.1% formic acid in MeCN. The mobile phase was programmed consecutively in linear gradients as follows: 0–5 min, 98% A and 2% B; 40 min, 70% A and 30% B; 46–52 min, 2% A and 98% B; and 53–55 min, 98% A and 2% B. The ionization source was Agilent Jet Stream, with electrospray ionization (ESI) negative mode employed for acquisition of mass spectra. The elution was run at a flow rate of 0.8 mL/min. UV spectra were monitored in the range of 200 nm and 400 nm. Injection volume was 2 μL for each of the sample solutions, followed by needle wash. The column temperature was maintained at 40°C. Nitrogen, supplied by a nitrogen generator (model no. NM32LA, Peak Scientific Instruments Ltd, Scotland, UK), was used as the drying and nebulizer gas. Other MS instrumental conditions are summarized as follows: drying gas temperature and flow rate were 350°C and 11.0 L/min, respectively; nebulizer pressure was 50 psi; sheath gas temperature and flow rate were 350°C and 12.0 L/min, respectively; capillary, nozzle, and fragmentor voltages were 3500, 500, and 100 V, respectively; skimmer was 65.0; Oct 1 RF V pp was 750. The instrument state was set to high resolution mode (4 GHz). Tuning and calibration were performed before sample runs. Data collection and integration were performed using MassHunter workstation software (version B.05.00). The data was collected in the range of 100 and 1700 m/z.
2.4. Accurate Mass Measurement
Data were stored in both centroid and profile formats during acquisition. Two independent reference lock-mass ions, purine (m/z 119.03632) and HP-0921 (m/z 966.000725), were employed to ensure mass accuracy and reproducibility.
2.5. Characterization of Phytochemicals
Identification of phytochemical compounds 1–10 was accomplished by elucidating mass spectral data. Compound identities were then confirmed by comparing the UPLC retention times and UV spectra of target peaks with those of reference compounds.
2.6. Primary DNA Damage Test in E. coli PQ37
The SOS chromotest in E. coli PQ37 was used to determine the potential for loganic acid, loganin, sweroside, and cornuside to induce primary DNA damage. This test was carried out according to a previously developed method [23]. E. coli PQ37 was incubated in LB medium in a 96-well plate at 37°C in the presence of the iridoids for 2 hours. The concentrations tested were 7.81, 15.6, 31.2, 62.5, 125, 250, 500, and 1000 μg mL−1. Following incubation with replicate samples, 5-bromo-4-chloro-3-indolyl-β-D-galactopyranoside was added to the wells to detect β-galactosidase enzyme activity, which is induced during SOS repair of damaged DNA. Nitrophenyl phosphate is also added to the wells to measure alkaline phosphatase activity, an indicator of cell viability. The samples were again incubated and the absorbance of each sample, blanks, and controls was measured at 410 and 620 nm with a microplate reader. Vehicle blanks and positive controls, 1.25 μg mL−1 4-nitroquinoline 1-oxide (4NQO), were included in this test. The induction factor of each material was calculated by dividing the absorbance of the sample at 620 nm by that of the blank, while also correcting for cell viability. Induction factors less than two indicate an absence of genotoxic activity.
2.7. Antigenotoxicity Test in E. coli PQ37
The primary DNA damage test was performed again, similar to the method described above. However, the method was modified to include incubation of E. coli PQ37 in the presence of 1.25 μg mL−1 4NQO with 250 μg mL−1 loganic acid, loganin, sweroside, or cornuside. Induction factors were calculated in the same manner as described above. The percent reduction in genotoxicity was determined by dividing the difference between the induction factor of 4NQO and the blank (induction factor of 1) by the difference between the induction factor of 4NQO plus iridoid sample and the blank. Experiments were performed in triplicate.
3. Results and Discussion
Although the application of LC-MS may minimize the need for chromatographic separation, a good LC separation may prevent ion suppression and isobaric interferences in the MS analysis. The UPLC system delivered a more rapid and effective separation than HPLC, especially for the wide range of phytochemicals identified. UPLC also facilitated the simultaneous determination of the phytochemical matrix of our samples. The flow rate, solvent system, and column were optimized for the UPLC system relative to the analysis of phytochemicals in C. mas fruit samples. A moderate flow rate of 0.8 mL/min accommodated electrospray source, column separation and optimized sensitivity and resolution. Better peak shape and resolution for each target peaks, as well as optimal sensitivity for ion detection, were obtained by adding 0.1% formic acid. The column temperature was kept at 40°C to minimize column pressure due to flow rate. A gradient solvent system of MeCN-H2O ensured complete separation of target peaks within a limited time frame. The UPLC system delivered good separation and eliminated the overlap of targeted phytochemical peaks.
The time-of-flight mass spectral detector is known for providing accurate and precise mass information. It can accurately measure mass values with a mass error less than 5 ppm. The generation of empirical formulae results in possible identification of phytochemicals by means of elemental composition analysis. Our experiments used electrospray ionization and were operated in negative mode as the interface since it generated higher signal information for the compounds with less interruption compared to positive mode. All other mass spectral parameters, including drying gas flow and temperature, nebulizer pressure, and sheath gas flow and temperature, were also optimized in order to achieve good sensitivity and resolution.
The total ion chromatogram (TIC) of C. mas fruit is shown in Figure 1. Negative ion electrospray LC-MS chromatograms of the fruit puree resulted in the identification of 10 peaks. Deprotonated molecular ions [M − H]−, chlorinated ions [M + Cl]−, and/or formic acid adducts [M + HCOO]− of the compounds were identified with the TOF detector. As a result, accurate molecular weights were determined. Since peaks 6, 7, and 9 were not clearly visible on the TIC chromatogram due to their low concentration, zoomed-in peaks are provided accordingly.
Figure 1.
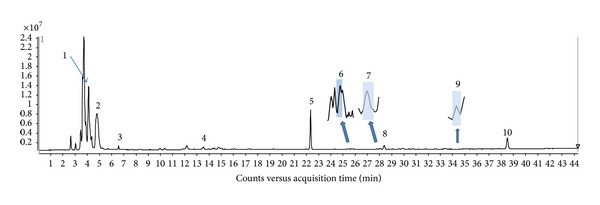
The typical total ion chromatogram (TIC) of C. mas fruit puree. Ionization source performed on Agilent Jet Stream TOF-MS with electrospray ionization (ESI) negative mode. (1) x-axis represents retention time and y-axis is intensity of m/z peaks. (2) Peaks 1–10 were identified as tartaric acid (1), malic acid (2), citric acid (3), gallic acid (4), chlorogenic acid (6), rutin (9), and four iridoids, loganic acid (5), loganin (7), sweroside (8), and cornuside (10). (3) Peaks 6, 7, and 9 were enlarged by zooming in.
Accurate mass spectra (mass-to-charge, m/z) of the phytochemical peaks identified are shown in Figure 2. Peaks 1–4 were compounds that eluted early from the column. Peaks 1, 3, and 4 had deprotonated molecular ions [M − H]− with m/z values of 149.0099, 191.0201, and 169.0146, respectively, corresponding to the molecular formula of C4H6O6, C6H8O7, and C7H6O5. Peak 2 had [M − H]− and [M + Cl]− with m/z values of 133.0145 and 168.9898, respectively, matching the molecular formula C4H6O5. Compound 6 had [M − H]− and [M + HCOO]− at m/z 353.0884 and 399.0936, corresponding to C16H24O10. Comparisons against reference compound retention revealed that peaks 1–4 and 6 were organic acids, namely, tartaric acid (1), malic acid (2), citric acid (3), gallic acid (4), and chlorogenic acid (6). By the same methods, peak 9 was determined to be rutin (9), a flavonoid glycoside.
Figure 2.
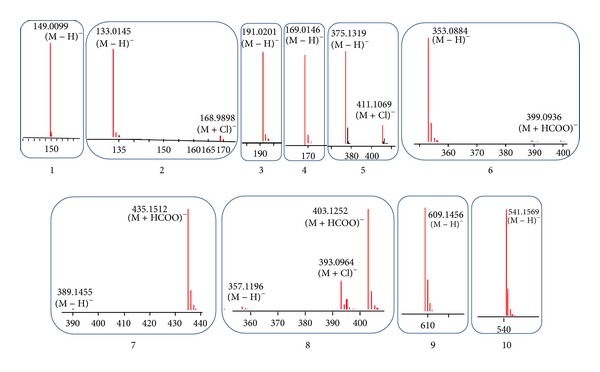
Accurate mass spectra (mass-to-charge, m/z), in ESI negative mode, of phytochemical peaks identified in C. mas fruit by Agilent TOF detector. (1) Numbers 1–10 represent peaks to be characterized, that is, tartaric acid (1), malic aicd (2), citric acid (3), gallic acid (4), chlorogenic acid (6), a flavonoid glycoside rutin (9), and four iridoids, loganic acid (5), loganin (7), sweroside (8), and cornuside (10). (2) Accurate mass-to-charge (m/z) is labeled on the top of each peak.
Peak 5 is a major peak on the chromatogram, eluting at 22.345 min and displaying both [M − H]− and [M + Cl]− at m/z 375.1319 and 411.1069. Its molecular formula was determined to be C16H24O10. Peak 7 showed [M − H]− and [M + HCOO]− at m/z 389.1455 and 435.1512. Peak 8 exhibited a deprotonated m/z, a chlorinated m/z, and a formic acid adduct of 357.1196, 393.0964, and 403.1252, respectively. Peak 10 had deprotonated ions with m/z value of 541.1569. By comparing these pieces of information with UV and mass spectra, as well as retention times of reference compounds, peaks 5, 7, 8, and 10 were identified as the iridoids loganic acid (5), loganin (7), sweroside (8), and cornuside (10). A summary of the chromatographic and mass spectral data of the phytochemical compounds identified in C. mas fruit is given in Table 1. Chemical structures of the iridoids in C. mas fruit are provided in Figure 3.
Table 1.
Chromatographic and mass spectral data of phytochemical compounds identified in C. mas fruits.
| Number | Name | Formula | RT | m/z | Mass | Score | Area | |
|---|---|---|---|---|---|---|---|---|
| 1 | Tartaric acid | C4H6O6 | 4.084 | 149.0099 | 150.0171 | [M − H]− | 96.91 | 26316227 |
| 2 | Malic acid | C4H6O5 | 4.863 | 133.0145, 168.9898 | 134.0218 | [M − H]−
[M + Cl]− |
99.32 | 28327606 |
| 3 | Citric acid | C6H8O7 | 6.57 | 191.0201 | 192.0273 | [M − H]− | 98.81 | 4041717 |
| 4 | Gallic acid | C7H6O5 | 13.529 | 169.0146 | 170.0219 | [M − H]− | 85.94 | 4663081 |
| 5 | Loganic acid | C16H24O10 | 22.345 | 375.1319, 411.1069 | 376.1372 | [M − H]−
[M + Cl]− |
98.79 | 3904847 |
| 6 | Chlorogenic acid | C16H18O9 | 25.725 | 353.0884 | 354.0956 | [M − H]− | 98.43 | 575436 |
| 7 | Loganin | C17H26O10 | 28.028 | 389.1455, 435.1512 | 390.153 | [M − H]−
[M + HCOO]− |
98.79 | 954718 |
| 8 | Sweroside | C16H22O9 | 28.393 | 357.1196, 393.0964, 403.1252 | 358.127 | [M − H]−
[M + Cl]− [M + HCOO]− |
98.84 | 3613261 |
| 9 | Rutin | C27H30O16 | 34.772 | 609.1456 | 610.1532 | [M − H]− | 98.25 | 28498 |
| 10 | Cornuside | C24H30O14 | 38.501 | 541.1569 | 542.1641 | [M − H]− | 93.36 | 17943814 |
Figure 3.
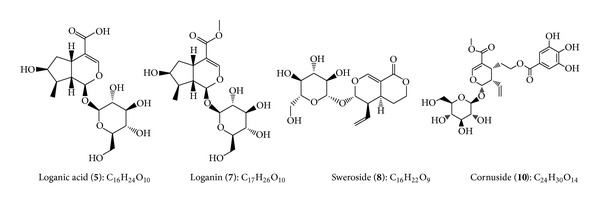
Chemical structures of iridoids identified in C. mas fruit by UPLC-TOF-MS.
These iridoids have displayed many potential biological activities. Loganic acid has potent anti-inflammatory activity [24]. Loganin and sweroside were observed to have strong antibacterial, antifungal, and antispasmodic activities [25]. Loganin was also found to have neuroprotective effects [26]. Cornuside has remarkable antioxidant activity and may provide protection against acute myocardial ischemia and reperfusion injury [27].
In the primary DNA damage test in E. coli PQ37 (Table 2), the mean induction factors for loganic acid, loganin, sweroside, and cornuside, at 1000 μg mL−1, were 1.095, 0.995, 1.028, and 1.068, respectively. At all concentrations tested, these iridoids did not induce any SOS repair at a frequency significantly above that of the blank. Statistically, induction factors were not different from that of the blank, and all results remained well below the twofold criteria for genotoxicity. SOS chromotest results have a high level of agreement (86%) with those from the reverse mutation assay [28]. Therefore, the SOS chromotest has some utility in predicting potential mutagenicity, in addition to primary DNA damage. These results are consistent with previously published genotoxicity tests of other food derived iridoids [29].
Table 2.
Primary DNA damage assay in E. coli PQ37.
| Compound | Concentration (µg mL−1) | Induction factor (mean ± standard deviation) |
|---|---|---|
| Loganic acid | 1000 | 1.095 ± 0.004 |
| 500 | 1.080 ± 0.038 | |
| 250 | 0.994 ± 0.003 | |
| 125 | 1.058 ± 0.025 | |
| 62.5 | 1.006 ± 0.024 | |
| 31.2 | 1.027 ± 0.003 | |
| 15.6 | 1.012 ± 0.003 | |
| 7.81 | 0.965 ± 0.031 | |
|
| ||
| Loganin | 1000 | 0.995 ± 0.044 |
| 500 | 1.013 ± 0.029 | |
| 250 | 1.036 ± 0.018 | |
| 125 | 1.051 ± 0.038 | |
| 62.5 | 1.029 ± 0.001 | |
| 31.2 | 1.041 ± 0.001 | |
| 15.6 | 1.033 ± 0.006 | |
| 7.81 | 1.016 ± 0.036 | |
|
| ||
| Sweroside | 1000 | 1.028 ± 0.008 |
| 500 | 1.021 ± 0.005 | |
| 250 | 1.032 ± 0.008 | |
| 125 | 1.043 ± 0.013 | |
| 62.5 | 1.009 ± 0.042 | |
| 31.2 | 1.001 ± 0.010 | |
| 15.6 | 1.029 ± 0.017 | |
| 7.81 | 0.939 ± 0.022 | |
|
| ||
| Cornuside | 1000 | 1.068 ± 0.015 |
| 500 | 1.030 ± 0.018 | |
| 250 | 1.012 ± 0.000 | |
| 125 | 1.074 ± 0.040 | |
| 62.5 | 1.023 ± 0.030 | |
| 31.2 | 1.026 ± 0.016 | |
| 15.6 | 1.019 ± 0.029 | |
| 7.81 | 0.959 ± 0.019 | |
|
| ||
| 4NQO | 1.25 | 3.365 ± 0.516 |
In the antigenotoxicity test, 4NQO exhibited obvious genotoxicity, inducing SOS repair more than 3-fold above that of the vehicle blank. Incubation with loganic acid did not significantly reduce 4NQO induction factors. However, loganin, sweroside, and cornuside apparently reduced the amount of 4NQO that caused DNA damage, as mean induction factors were lowered to below 3 in cells incubated in the presence of these iridoids (Table 3).
Table 3.
Antigenotoxicity test in E. coli PQ37.
| Compound | Concentration (µg mL−1) | Induction factor (mean ± standard deviation) |
|---|---|---|
| 4NQO | 1.25 | 3.365 ± 0.516 |
| 4NQO + loganic acid | 250* | 3.278 ± 0.260 |
| 4NQO + loganin | 250* | 2.497 ± 0.821 |
| 4NQO + sweroside | 250* | 2.259 ± 0.325 |
| 4NQO + cornuside | 250* | 2.587 ± 0.199 |
*Iridoid concentration; 4NQO concentration is 1.25 µg mL−1.
4. Conclusions
The UPLC-TOF-MS method reported has been shown to be useful for secondary metabolite profiling of Cornus mas fruit. With this method, a total of ten phytochemicals were identified, including five organic acids and four iridoids. To our knowledge, this is the first time that 1–4 and 6–10 have been identified in C. mas fruit. Loganin, sweroside, cornuside, and loganic acid will provide valuable information for chemical taxonomy. Iridoids, together with other characteristic components, can be used for identification, authentication, and standardization of C. mas fruit raw materials and commercial products. The iridoids in the fruit did not display any toxicity. On the other hand, these iridoids exhibited potential anti-genotoxic activity. Our findings also warrant future research on the safety and efficacy of C. mas.
References
- 1.Rop O, Mlcek J, Kramarova D, Jurikova T. Selected cultivars of cornelian cherry (Cornus mas L.) as a new food source for human nutrition. African Journal of Biotechnology. 2010;9(8):1205–1210. [Google Scholar]
- 2.Hassanpour H, Hamidoghli Y, Samizadeh H. Some fruit characteristics of Iranian cornelian cherries (Cornus mas L.) Notulae Botanicae Horti Agrobotanici Cluj-Napoca. 2012;40(1):247–252. [Google Scholar]
- 3.Seeram NP, Schutzki R, Chandra A, Nair MG. Characterization, quantification, and bioactivities of anthocyanins in Cornus species. Journal of Agricultural and Food Chemistry. 2002;50(9):2519–2523. doi: 10.1021/jf0115903. [DOI] [PubMed] [Google Scholar]
- 4.Demir F, Kalyoncu IH. Some nutritional, pomological and physical properties of cornelian cherry (Cornus mas L.) Journal of Food Engineering. 2003;60(3):335–341. [Google Scholar]
- 5.Ercisli S. A short review of the fruit germplasm resources of Turkey. Genetic Resources and Crop Evolution. 2004;51(4):419–435. [Google Scholar]
- 6.Ercisli S. Cornelian Cherry germplasm resources of Turkey. Journal of Fruit and Ornamental Plant Research. 2004;12:87–92. [Google Scholar]
- 7.Celik S, Bakrc I, Şat IG. Physicochemical and organoleptic properties of yogurt with cornelian cherry paste. International Journal of Food Properties. 2006;9(3):401–408. [Google Scholar]
- 8.Brindza P, Brindza J, Tóth D, Klimenko SV, Grigorieva O. Slovakian cornelian cherry (Cornus mas L.): potential for cultivation. Acta Horticulturae. 2007;760:433–438. [Google Scholar]
- 9.Brindza P, Brindza J, Tóth D, Klimenko SV, Grigorieva O. Biological and commercial characteristics of cornelian cherry (Cornus mas L.) population in the gemer region of Slovakia. Acta Horticulturae. 2009;818:85–94. [Google Scholar]
- 10.Güleryüz M, Bolat I, Pirlak L. Selection of table cornelian cherry (Cornus mas L.) types in çoruh valley. Turkish Journal of Agriculture and Forestry. 1998;22(4):357–364. [Google Scholar]
- 11.Didin M, Kızılaslan A, Fenercioglu H. Suitability of some cornelian cherry cultivars for fruit juice. Gida. 2000;25(6):435–441. [Google Scholar]
- 12.Klimenko S. The Cornelian cherry (Cornus mas L.): collection, preservation, and utilization of genetic resources. (Journal of Fruit and Ornamental Plant Research).Protection of Genetic Resources of Pomological Plants and Selection of Genitors with Traits Valuable For Sustainable Fruit Production. 2004;12:93–98. [Google Scholar]
- 13.Marinova D, Ribarova F, Atanassova M. Total phenolics and total flavonoids in bulgarian fruits and vegetables. Journal of the University of Chemical Technology and Metallurgy. 2005;40(3):255–260. [Google Scholar]
- 14.Pantelidis GE, Vasilakakis M, Manganaris GA, Diamantidis G. Antioxidant capacity, phenol, anthocyanin and ascorbic acid contents in raspberries, blackberries, red currants, gooseberries and Cornelian cherries. Food Chemistry. 2007;102(3):777–783. [Google Scholar]
- 15.Tural S, Koca I. Physico-chemical and antioxidant properties of cornelian cherry fruits (Cornus mas L.) grown in Turkey. Scientia Horticulturae. 2008;116(4):362–366. [Google Scholar]
- 16.Yilmaz KU, Ercisli S, Zengin Y, Sengul M, Kafkas EY. Preliminary characterisation of cornelian cherry (Cornus mas L.) genotypes for their physico-chemical properties. Food Chemistry. 2009;114(2):408–412. [Google Scholar]
- 17.Pawlowska AM, Camangi FF, Braca A. Quali-quantitative analysis of flavonoids of Cornus mas L. (Cornaceae) fruits. Food Chemistry. 2010;119(3):1257–1261. [Google Scholar]
- 18.Du C-T, Francis FJ. Anthocyanins from Cornus mas . Phytochemistry. 1973;12(10):2487–2489. [Google Scholar]
- 19.Du CT, Francis FJ. A new anthocyanin from Cornus mas L. Hortscience. 1973;8(1):29–30. [Google Scholar]
- 20.Jensen SR, Kjaer A, Nielsen BJ. The genus MComus: non-flavonoid glucosides as taxonomic markers. Biochemical Systematics and Ecology. 1975;3(2):75–78. [Google Scholar]
- 21.Alicja K, Antoni S, Anna S, Jan O. Sposob otrzymywania kwasu loganowego, Biuletyn Urzedu Patentowego (Bulletin of the Patent Office) no. 2, p. 4, 2010, http://ipu.uprp.pl/portal/web/guest/wydawnictwawupbup.
- 22.West BJ, Deng S, Jensen CJ, Palu AK, Berrio LF. Antioxidant, toxicity, and iridoid tests of processed Cornelian cherry fruits. International Journal of Food Science and Technology. 2012;47(7):1392–1397. [Google Scholar]
- 23.Fish F, Lampert I, Halachmi A, Riesenfeld G, Herzberg M. The SOS chromotest kit: a rapid method for the detection of genotoxicity. Toxicity Assessment. 1987;2(2):135–147. [Google Scholar]
- 24.Wei S, Chi H, Kodama H, Chen G. Anti-inflammatory effect of three iridoids in human neutrophils. Natural Product Research. 2013;27(10):911–915. doi: 10.1080/14786419.2012.668687. [DOI] [PubMed] [Google Scholar]
- 25.Dinda B, Debnath S, Harigaya Y. Naturally occurring secoiridoids and bioactivity of naturally occurring iridoids and secoiridoids. A review, part 2. Chemical and Pharmaceutical Bulletin. 2007;55(5):689–728. doi: 10.1248/cpb.55.689. [DOI] [PubMed] [Google Scholar]
- 26.Shi J, Li CJ, Yang JZ, Yuan YH, Chen NH, Zhang DM. Coumarin glycosides and iridoid glucosides with neuroprotective effects from Hydrangea paniculata . Planta Medica. 2012;78(17):1844–1850. doi: 10.1055/s-0032-1315394. [DOI] [PubMed] [Google Scholar]
- 27.Jiang W-L, Zhang S-M, Tang X-X, Liu H-Z. Protective roles of cornuside in acute myocardial ischemia and reperfusion injury in rats. Phytomedicine. 2011;18(4):266–271. doi: 10.1016/j.phymed.2010.07.009. [DOI] [PubMed] [Google Scholar]
- 28.Legault R, Blaise C, Rokosh D, Chong-Kit R. Comparative assessment of the SOS chromotest kit and the mutatox test with the Salmonella plate incorporation (Ames test) and fluctuation tests for screening genotoxic agents. Environmental Toxicology and Water Quality. 1994;9(1):45–57. [Google Scholar]
- 29.West BJ, Deng S, Jensen CJ. Nutrient and phytochemical analyses of processed noni puree. Food Research International. 2011;44(7):2295–2301. [Google Scholar]